


Viking
-
Posts
4,689 -
Joined
-
Last visited
-
Days Won
35
Content Type
Profiles
Forums
Events
Posts posted by Viking
-
-
2 hours ago, John Hjorth said:
Thank you all for your posts containing your personal considerations, It's a fascinating discussion going on in this topic by now. Please continue - I hope you will.
Where do you consider the big Canadian banks to be situated in this actual situation for Canada?
My guess is the Canadian big banks will be fine. Unless we have a bit of a crash in the housing market (driven by economic recession - and an increase in unemployment). Not likely, from my perspective but possible. I think the big Canadian banks are cheap. They are a regulated oligopoly - they have morphed into a utility type of investment. For example, the returns for investors (as a basket) have tracked close to the dividend yield for the past 5 years. At current prices (20% off highs) probably a decent entry point - unless Canada has a hard landing like the US in 2008.Part of the challenge today is the data on housing is very poor. The lending process is a mess. The pandemic turned everything on its head. The government (federal and provincial) have been asleep at the wheel in terms of spike of permanent / nonpermanent residents. Taxes (as a % of selling price) on a new build has gone from 10% eight years ago to 30% today (didn’t matter when prices were going up 8% per year. Zoning (controlled my minipitailites) is archaic and driven by NIMBY - not in my backyard. Oh, and interest rates are about 6.25% and new buyers have to have the income to qualify at and 8.25% rate (called a stress test).
The average price of a detached house in greater Vancouver is $2.4 million. The average price for a condo/apartment is $800,000. The average salary in Vancouver is $69,000 (25% of this will go to income taxes). At a 8.25% qualifying mortgage rate the math doesn’t work (my attempt at humour).
-
2 hours ago, SharperDingaan said:
Some add on's:
A great many investment properties sit unoccupied/partially vacant. A first great wave of new housing will be their return to market, as/when landlords finally have to dump &/or re-purpose vacant office space; & everyone is screaming as to how 'awful' Canadian real estate investment is. Multiple towers worth of condominium units all rushing the exit at once, & new condo's getting cancelled (freeing up construction workers).
A second wave of new housing (largely housing new Canadians/first time buyers) being the result of policy action. Probably a version of the 1970's MURB for qualified first time buyers, with a low DP and a non-transferable 25 year term fixed rate mortgage at 3-5%, backstopped by the BoC; sell the place, & the low rate mortgage is immediately repaid. Zoning amended to accommodate brown-field tear-downs & replacement with similarly zoned but larger buildings. Whichever political party implementing it, probably remaining in power for a consecutive 3-4 terms.
Lot of disruption, but with it - opportunity.
SD
@SharperDingaan you highlight the thing i have never understood. How can Canada have a housing crisis (driven partly by lack of supply) when it was in a multiyear construction boom of epic proportions?
I hope that you are right and there are a lot of units sitting empty that will now be put now to productive use.
-
12 hours ago, John Hjorth said:
Who do you think this real estate situation in Canada combined with the interest rate increases is going eventually going be a pitty for, @Viking [and others, too] ?
@John Hjorth despite my post above, i am optomistic. The fact we have a crisis (in Vancouver/Toronto) the politicians now have the cover they need to do what needs to be done. Vancouver had lots of land… we just need to densify the downtown areas (imagine if Manhattan or downtown Copenhagen only allowed single family homes to be built with big yards?).And we are beginning to see real change and my guess is we are just getting started:
- zoning rules have changed in Vancouver from a single family bias to a multi family bias.
- Federal and provincial governments are implementing new policies to try and stimulate supply of multifamily buildings
@SharperDingaan i never thought about the supply of workers shifting from building condos to building affordable multifamily units (being encouraged by governments). perhaps the pivot can happen a little more quickly than i initially thought.
Address is also from the demand side: This is the quicker way to address the problem. My guess is we also will get a slowdown in the number of foreign students/immigration/foreign workers. As better information/stats becomes available the federal/provincial governments are going to be forced to do something - or they will likely get hammered in the next election.Who loses? My guess is the people who have too much debt. So anyone who bought in the past 5 years and are carrying a big mortgage. Maybe 10% of homeowners today, so in the big scheme of things not a big number.
The fundamental issue is prices are simply too high. IF interest rates stay elevated, my guess is we will see price slowly come down (over a couple of years. Maybe 10 or 15% in nominal terms. Factor in inflation and you get a 25% correction in real terms over a 3 year period. Nothing catastrophic.
The market will find a new equilibrium.
-
1 hour ago, TwoCitiesCapital said:
Supposedly they are linked, but weren't CRs high while interest rates were low in the late 2010s?
And now CRs have been low for a bit while interest rates have been rising quite a bit?
And the higher interest rates go destroys more capital keeping CRs low due to higher underwriting prices?
The rationale of why they are linked makes a lot of sense to me, but I'm not seeing it in the results. At what point does the "rationale" assert itself? And why has it not been asserting itself in the last 5-7 years?
I think the last true hard market in PC insurance was around 2004. That suggests the insurance cycle can run in a 20 year cycle from hard to soft and back to a hard market. At the same time, you also have an interest rate cycle. Interest rates peaked in 1980 and the trough was 2020. That 1/2 cycle in rates was 40 years.
What does this tell us about how to value Fairfax today? I am pretty sure the two are linked. But i have no idea how to overlay that linkage to how i value Fairfax.
Perhaps management is the key. Good management teams will usually thrive over time. Bad management teams will usually struggle/fail. And cycles will happen like they always do.
-
10 minutes ago, Spekulatius said:
The higher long yields are an indication of the economy doing better than expected. Looks like we have no problem with 5% interest rates, at least the doom and gloom that was predicted did not happen.
My understanding is the move in bond yields the past month or so is being driven primarily by supply / demand dynamics. Supply is vastly outstripping demand. And I think this is expected to continue the rest of this year.
Higher interest rates. Oil over $90. Something to monitor... Historically speaking, if this lasts for any length of time, it usually starts to create some stress. And I am in Canada, and high interest rates are a completely different animal here - this is like impacting my assessment big time.
-
Cash. It has been a great year. Time to get more defensive. Lock in gains. Back up to 30% cash. Get paid close to 5% risk free to sit in the weeds and wait and see what Mr Market pukes up next. The move higher in bond yields is what i am watching right now. How high can they go?
i am not turning bearish. Or bullish.
-
52 minutes ago, Crip1 said:
Respectful disagreement discussions allow far better opportunity to learn than any other, so thanks to all for the viewpoints and the means by which said viewpoints are presented.
A perfect crystal ball does not exist, so nobody is going to be right. What looks to be clear now is that Fairfax is in the middle of an extraordinary (albeit finite) growth period where the hard market is juicing the returns for the company. I think that Viking makes a compelling case that 2023 – 2025 will show extraordinary returns, so I like the idea of using his 3 year projection (with a haircut if one is so inclined). As the ’23-’25 projections are not guaranteed, any projections beyond that time are most certainly unknown. Munger_Disciple’s projections (Combined Ratio, returns on Fixed Income and Equity Portfolios, etc) present a reasonable look at what we can expect 2026 and beyond.
The goal would be two fold. First, look at Viking’s projection to calculate the annual cash flows between now and 2025. Second, using the size of the company at the end of 2025, apply the MD’s methodology to project the next 3-5 years cash flows. From there, the company will clearly still have a value which we can approximate as BV at the end of the 3-5 year period. Finally, discount all of these back to present value and that will give us an implied value now. The more that value is above current price, the better a buy the company is today (and, of course, if that value is less than current price, the company is not worth the investment.
Obviously, there are so many variables that this cannot be counted upon with precision. Rather, it gives an idea of what the company should be worth right now. Any attempts to be more precise are likely going to be fruitless, rather, we’re going to have to be happy with being approximately right as opposed to being precisely wrong.
-Crip
@Crip1 well said. What are your thoughts about the interplay between underwriting profit and investment returns? Are they linked? Can we put numbers to each?
At the end of the day, publicly traded P/C insurance companies need to make a 8-10% ROE over time. The CEO’s want to hit their bonus payouts and also keep their jobs.
As a result, i think CR and investment results are linked. Let’s assume fixed income yields stay at the elevated levels we are seeing today. Can a 100 CR get a company to a 10% ROE? Maybe Fairfax today because of the leverage they have with float. But i think most P&C insurers would struggle to deliver an ROE of close to 10%. Given most have taken a capital hit on their fixed income portfolios due to rising interest rates i just don’t see a big or rapid turn to a soft insurance market. Bond yields are still too low. And insurance companies lots of near term risks they need to build into their models when pricing (elevated catastrophe losses, reinsurance costs, inflation etc).
-
25 minutes ago, Munger_Disciple said:
More importantly, you seem to be thinking that $160 per share earnings for the next couple of years are already in the bag.
@Munger_Disciple to be clear, i may have a lot of conviction in my estimate for 2023. I have never said any estimate is ‘in the bag’. That, of course would be idiotic. As we move to 2024, the estimate gets less clear. 2025 even less. And i don’t even attempt to forecast 2026 as there are too many moving parts.
You have built an estimate… i have built an estimate. We both have provided our logic. Discussing the build is how we learn. I appreciate the opportunity to debate.
—————Below is what i said in my response to you two days ago
What is the major flaw with my estimates?
Am I being way too optimistic? Perhaps. But my problem the past 3 years is I have been way too pessimistic with my forecasts - they have consistently been way too low.
I lean heavily on what I think i know today. I only go out max 3 years with my forecasts. And I admit my year-3 forecast is not as clear as my year-1.
As new news comes in I update my forecasts. Quickly. If bad news starts to pour in I will take down my estimates. Same if the opposite happens and good news comes in - I'll take up my estimate. So far, I have only been making upward revisions.
Another flaw with my forecasts is I do not incorporate compounding in very well. So my estimates in 2024 and 2025 for asset growth is too low. Higher assets likely means higher earnings. This is a big reason I think my forecasts are mildly conservative (overall).
-
56 minutes ago, UK said:
However, what is also interesting:
And while such distress does seem to be fueling an increase in properties available for sale, there’s still such a shortage of inventory that prices haven’t substantially fallen. It’s all threatening to further aggravate the shortage of all housing types in Canada, hurting homebuyers and renters alike. “Everything is in a really bad place right now,” said Danielle Levy, a real estate broker in Toronto who works with both buyers and renters. “People aren’t able to afford the rent. People are not able to afford paying their mortgage. People are not able to fulfill their goal to purchase a home to start a new life with their families. We need a lot more supply in the market.”
It seems this is also the case in other previously hot markets, like Australia, Great Britain etc. This article points to some interesting reasons:
Like:
In many English-speaking countries, inspired by Victorian worries about “slums”, planning laws tended to prioritise detached houses. For urban planners, such as Ebenezer Howard, density was seen as akin to crowding. In packed industrial hotspots, “downzoning” and slum clearance were used to flatten cities and spread them out by force. The writer George Orwell was sceptical of the proceedings: “If people are going to live in large towns at all they must learn to live on top of one another,” he declared. But he reckoned that many workers in Britain did not “take kindly to flats”. Today far fewer citizens of English-speaking countries live in flats than elsewhere. In England 80% of people now dwell in houses, and just 6% in flats in buildings taller than three storeys. In France 44% of people live in apartments, as opposed to houses. In cities including Dublin, Los Angeles and Sydney, sprawl is running out of road. At the densities allowed by law, almost all of the land within a reasonable commute of city centres has already been “built out”. Instead, new subdivisions are built in separate towns, perhaps 50 or 60 miles away from the core, with residents typically facing punishing commutes by car to work. (In Britain these workers typically leap over the “green belts” around cities within which construction is mostly illegal.)
Anyway, maybe except for the Sweden and some regional markets, so far housing prices seems to be holding up or even begin to rise again in some places.
When it comes to housing, Canada is facing the perfect storm.
1.) First we blew a housing bubble that is probably bigger than the the US housing bubble that popped in 2008. So we have crazy high prices.2.) All mortgage rates here are variable, with crazy low teaser rates. Those teaser rates are now resetting, with most resetting in 2024 and 2025. The parallels with US housing in 2006-2007 are frightening.
3.) Bubble high real estate prices + 6% mortgage rates = $3,000/month to rent a one bedroom. That is the math for a new investor. Rents on new rental units coming to market have doubled in the past 2 years.
3.) Rents in Vancouver are controlled by the government. Same for older housing stock in Toronto. So in the same building two of the exact same units can rent for $1,500/month and $3,000/month. So no renters can afford to move today - your rent is going to double if you do. The rental market is effectively frozen.
4.) Supply always has been tight and vacancy rates in Vancouver and Toronto have always been extremely low (2% or less).
5.) Demand- the number of international students has increased in recent years from a run rate of 200,000 per year to about 800,000 today. The net add has been 600,000. Why the increase? International students pay up to 6x the amount for tuition compared to a Canadian student. International students are driving the budgets of universities now. The provincial/federal governments usually fund education but international students have now become the golden goose for most institutions. Provinces and feds love it because they can spend $ on other priorities. Of course, no one asked if we have the housing to support an increase of 600,000 people.
- the Federal government also decided recently to boost immigration to 500,000 per year. GDP/capita has been falling for years in Canada. Fix? More people. Total GDP grows (easy way to paper over the problems under the surface).
- temporary foreign workers. We also have a shortage of workers so we have also been bringing in 200,00 or so foreign workers each year.
When you add the three together… Stats Canada just admitted they have undercounted the number of new people coming to Canada by 1 million people.
6.) Supply. The Bank of Canada is trying to slow the economy to get inflation under control. How? Higher interest rates. This lowers activity in interest rate sensitive parts of the economy, primarily housing. And it is working. New building permits are down a lot. New construction is slowing. Fewer units will be coming to market looking out a couple of years.
So we have a really messed up situation. Market was already super tight. Supply is constrained. Demand is through the roof and growing - the governments are not changing any of the rules (students, immigration, foreign workers) - at least as of today.
Housing looks like it is going to be the dominant issue in this country moving forward.
-
1 hour ago, UK said:
Below are a few quotes from the article. The tide is going out in Canadian real estate and we are beginning to understand who has been swimming naked. The additional problem for real estate investors in Vancouver is rent increases are dictated by the provincial government (2% in 2023, 1.5% in 2022). Older housing stock in Toronto is rent controlled (i think). If rates stay high (which is what it looks like) a lot of ‘investors’ in Vancouver/Toronto are going to learn that leverage can be a bitch:1.) much higher interest rates - variable rate mortgage
2.) falling housing prices
3.) limited ability to increase rents
“The problem facing Canada’s real estate investors, whether they’re buying a new property or they have a floating-rate mortgage on one they already own, is that the math simply doesn’t work at today’s interest rates. Modeling by the Bank of Montreal shows that in Toronto, anyone using a mortgage with a standard 20% down payment to buy a rental property at today’s prices, charging today’s rents, would be signing up to lose about C$1,000 (roughly $738) each month.
These cashflow calculations have been negative since 2016, but investors were generally willing to overlook that because part of those payments were paying down the mortgage’s principal, thus building equity in the investment. But in the last year, the cashflows have gone so deeply negative, it even offsets those equity gains, the BMO modeling shows.“
“Rental amounts aren’t going up fast enough to cover for the huge increase in interest rates,” he said. “Effectively what we do is we flush out all the people who are holding their breath. That’s what we’re starting to see here.”
-
For those who are looking to follow oil more closely the podcast below is done daily with different guests. Some are quite good. I wonder if oil is going to be the big story for the rest of 2023. If oil keeps going higher and busts through $100 it is going to have significant consequences on some things.
Like inflation. And interest rates. Higher for longer is looking more and more likely every day.
Up here in Canada, i think we might be seeing things starting to crack in the economy due to higher interest rates. We have had a monster housing bubble and everyone here has essentially what is a variable rate mortgage with a teaser rates that all going to reset over the next 30 months. Borrowers are going from 3ish % to over 6% when they renew. A segment of the population is screwed (those who bought high in recent years and have a big mortgage).
It is worse for investors (who bought recently). In Vancouver, the rental market is rent controlled. So your mortgage skyrockets higher and the government allows you to increase rent a maximum of 2% in 2022. Housing inventory is starting to move higher in Toronto and Vancouver - this will be something to watch in the coming months.
My favourite line in the video below was something like “i got duped by the fallacy of peak oil decades ago. The new fallacy that will be disproven in another decaade? That demand for oil will peak soon.”
If you watch the video start at the 7 minute mark…
-
@blakehampton If you haven’t, I would read Chapter 8 of the Intelligent Investor.
“Does the current economic situation particularly stand out to you, or is a mass feeling of uncertainty simply inevitable when it comes to markets?”
Volatility is your friend. Especially if you are young. I think people in their 40’s are young (in investing years). If you are young you should pray for armageddon. Falling stock markets are a gift. The bigger the decline the better. You buy more with the same amount of dollars. When you are really old, that is when you want strong equity markets.
Of course you are not going to be able to time the bottom. My point is, on big declines, find money (bring forward contributions - borrow short term from family etc). Buffett suggests you should buy stocks like you buy groceries - lower prices are better.
Training your brain is one of the keys to successful investing. Watch CNBC less. Read @dealraker posts about buy and hold.
http://csinvesting.org/wp-content/uploads/2012/07/mr-market-by-ben-graham_final.pdf
-
50 minutes ago, StubbleJumper said:
@Viking There's nothing particularly wrong with your earnings estimates for the current year and the next two. A guy could quibble with an assumption or two and shave 10 bucks per share off or add 10 bucks on, but really that doesn't much change the story.
The difference between your two-year forecast and what @Munger_Disciple posted is that you have developed a pro forma forecast for 2024 and 2025 based on your current best estimate of operating conditions for those two years, while he seems to have developed an estimate of normalized earnings, meaning an average earnings level that could reasonably be obtained over the course of an entire insurance cycle (you used the term normalized earnings differently back in January, but typical usage is to essentially average out earnings over a cycle for companies operating in a cyclical industry). You will note that @Munger_Disciple's financing differential (cost/benefit of float minus the fixed income return) is about 4.5% which is what one might expect over a lengthy period.
The advantage of normalizing earnings is that it does enable you to take a mental short-cut and slap a PE ratio on the result. So, the outcome of that thought process suggests that FFH is currently selling at roughly 10x normalized earnings, and those normalized earnings will experience growth over time. In short, that metric shows that FFH is currently cheap without all of the noise associated with the temporary unusual market conditions that currently offer the company an 11% financing differential (ie, ignore the silly current year PE multiples of 5 or 6 or whatever because they is not sustainable over a cycle, and PE analysis assumes long term cash flows).
As I have suggested in the past, over the shorter term, your earnings estimates are more useful to evaluate short-term cheapness. Take current adjusted-BV, tack on your earnings estimates for the next couple of years, subtract off the $10 divvies and you'll have a decent estimate of adjusted-BV as at Dec 31 2025. Slap your preferred p/BV ratio on the result and, voila, you suddenly have a plausible stock price forecast going out two years. If you are conservative like me, you might hair-cut the earnings for 2024 a bit and 2025 a bit more out of an abundance of caution, and you might be circumspect about your p/BV ratio (ie, do you select 1.0x or do you go all out and declare that its worth 1.5x?). But, based on the current stock price and a reasonable estimate of accumulated earnings over the next couple of years, FFH appears to be cheap.
Ten years from now, we might end up looking back and declaring that FFH wasn't just cheap in Sept 2023, but that it was outrageously cheap in retrospect. I am willing to run that risk of retrospectively declaring it outrageously cheap and regretting that I didn't choose a larger position size. But, on a prospective basis, I am unwilling to declare it outrageously cheap because the other side of the insurance cycle will eventually come and sizing up my position beyond where it currently sits is an enormously risky thing in that context (ie, if something is outrageously cheap and one is relatively certain about that analysis, what does the Kelly Criterion instruct us to do?).
Anyway, on this board, we are all very likely to make a pile of money from FFH over the next few years and our preoccupation during 2023 has been arguing about precisely how large our winnings will be...
SJ
@StubbleJumper Yes, i agree that @Munger_Disciple and i are both coming at this from very different perspectives. But sorry, i can’t reconcile the two estimates - they are simply too far apart. They both can’t be right (or even close).If Fairfax earns $160/share each of the next three years there is no way the shares are worth anything close to $845/share today.
Anyways, i love the debate. But time to get some sleep

-
9 hours ago, Munger_Disciple said:
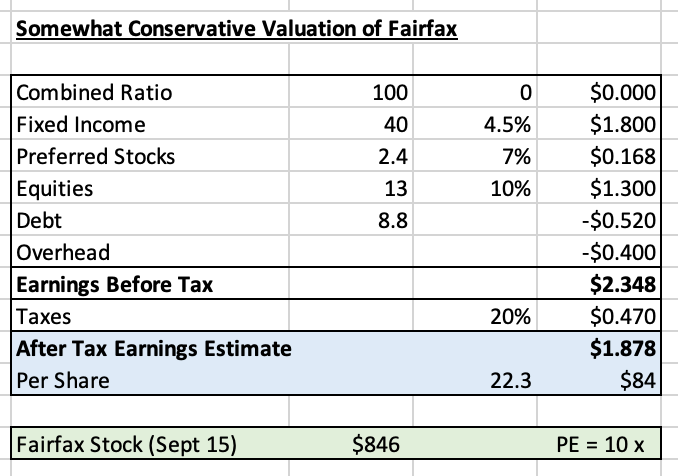
Somewhat Conservative Valuation of Fairfax
I know several members on this board are posting super low valuations of FFH. I wanted to independently estimate for myself a very crude, somewhat conservative (but not a totally low ball estimate) earnings power of Fairfax.
Assumptions:- Combined ratio of 100%. So float is cost free but there is no underwriting profit. I know people are throwing around way better numbers for CR but let us keep in mind that the goal of the best insurer on the planet (Berkshire) is to underwrite at 100CR over the cycles.
- As of Q2, Fairfax had cash+fixed income securities of $40.6B. Given the short duration of FI portfolio, I assume that this bucket earns 4.5% for the next few years.
- Fairfax has $2.4B of preferred stocks. Let us also assume that this bucket earns 7% (remember this is a crude+conservative estimate).
- Fairfax also has a total of $13B of equity securities+investment in associates+stake in Fairfax India. Let us assume that this bucket earns 10%.
- Fairfax has $8.8B of debt costing $520mm in interest payments & annual corporate overhead of $400mm.
I ignored everything else (remember this is a crude estimate) and assumed 20% corporate tax rate. So I get an earnings figure of $1.9B after tax. So that gives a P/E ratio of roughly 10 for Fairfax. Pretty decent value but not as ridiculously cheap as others claim.
To help investors value a stock, Warren Buffett tells the story of Aesop: "a bird in the hand is worth two in the bush."
According to Buffett, investors need to determine 3 things:
- How many birds are in the bush?
- When are you going to get them out?
- How sure are you?
The prevailing interest rate is also important:
- If interest rates are 15%, then two birds out in 5 years makes sense.
- If interest rates are 3%, then two birds out in 20 years makes sense.
-----------
@Munger_Disciple Thanks for taking the time to put together an earnings estimate for Fairfax. It is great to get different perspectives.
When I read your estimate above I immediately thought: "two birds in the hand are worth one in the bush." Of course, I know this was not what you are trying to say. But that was my take-away from your estimate.
Let me explain. Let's start with your estimate:

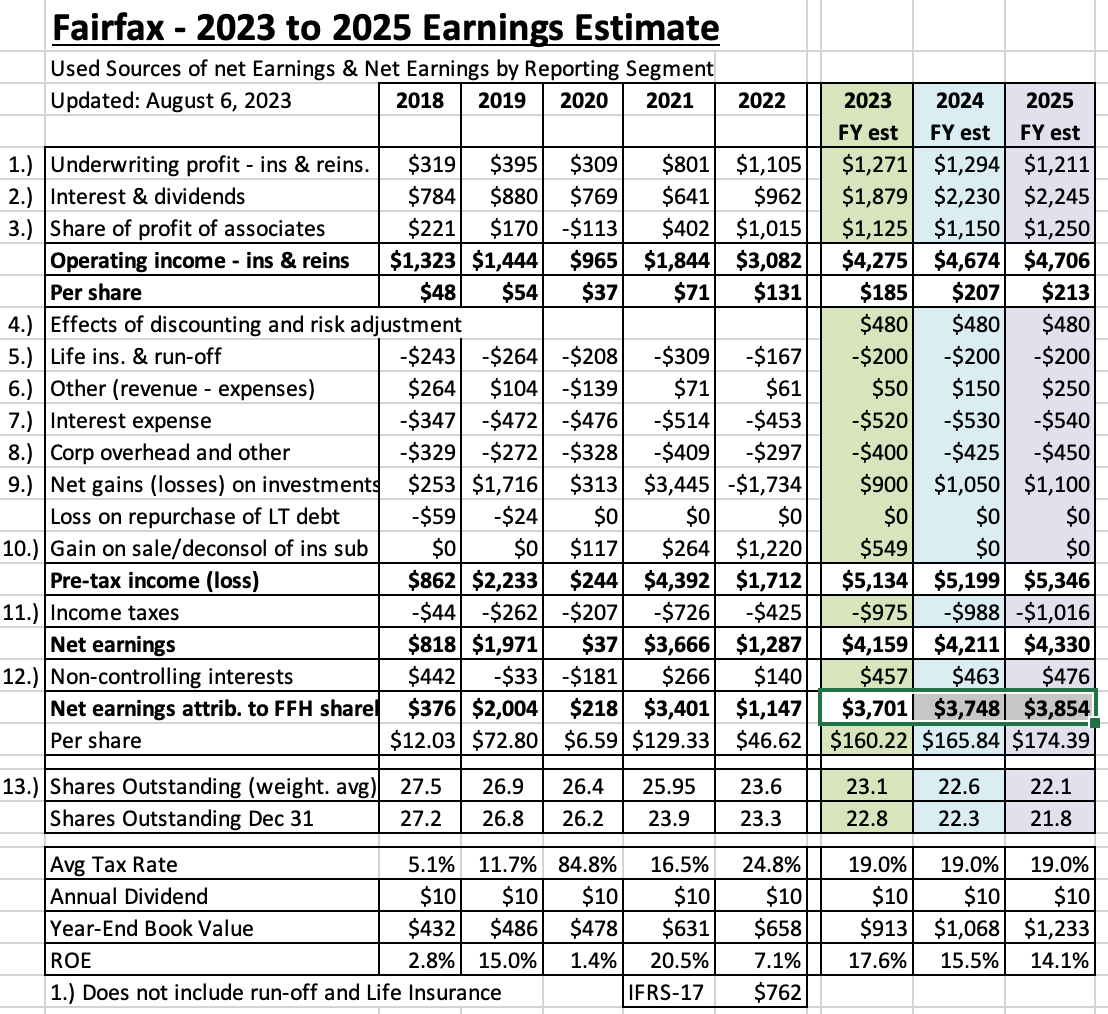
Now let's pivot to my current estimate for 2023. My current estimate is Fairfax will earn $160/share in 2023. We are almost 9 months into the year. Yes, something bad could happen. But something good could also happen. My view is the tail risks to my forecast (too high or too low) are about equally distributed. So I think $160 is a reasonable number.
What about 2024? I am at earnings of $166/share for 2024 and $174 for 2025. I think my 2024 and 2025 estimates are mildly conservative.
Let's compare out two numbers: You are at $84/share and I am at $160/share. You are 1/2 of my number. That is a big difference.
So what explains the difference?
Let's compare our estimates.
1.) Underwriting: Your CR is 100 and mine is 94.5 for 2023 and 95 for 2024.
Your rationale: You say Warren Buffett's goal is 100.
My rationale: That is where Fairfax is currently tracking (the last 3 years).
Yes, we likely are late in the hard market. But everything I read suggests the hard market is likely to continue into 2024. Reinsurance (property cat) just started its hard market.
Will Fairfax's CR trend higher in the coming years? Probably. I am modelling 94.5, 95 and 95.5 from 2023-2025. Over time, as I get new information I will adjust accordingly.
Bottom line, Fairfax is tracking to earn $1.27 billion in 2023. Taking that to zero today and every year into the future just seems bizarre to me.
PS: Warren Buffett also thinks float is better to have than an equal amount of equity.
2.) Fixed Income: $40 billion earning 4.5%. We are pretty close here.
The difference is compounding. My guess is the fixed income portfolio will grow in total size at 8-10% per year the next couple of years:
- Top line growth: increased premiums (currently running at 8%) will grow float
- GIG acquisition will boost total investments
- Earnings: 4.5% yield will deliver earnings of $1.8 billion pre tax
My point is the $40 billion will likely be $50 billion by the end of 2025. I also think the yield will be closer to 5% in 2024.
Bottom line, ignoring the power of compounding gives you a lower number here.
3.) Preferred stock $2.4 billion = $170 million. I don't break out preferred stock as a separate line item. Let's assume we are on the same page here (it is a small number)
4.) Equities/derivatives. You are $13 billion at 10% = $1.3 billion. We are off quite a bit here. My tracker has this bucket with a value of $16.9 billion today. This includes some preferred stock ($850 million). I also value the FFH-TRS at notional ($1.6 billion).
For this bucket I am at $2.4 billion for 2024 and growing in future years:
- Mark to market gains on portfolio of $8 billion = $800 million (10%). The FFH-TRS is driving this bucket (every $100 move in FFH = $200 million).
- Dividends = tracking around $140 million per year (includes preferred stock)
- Share of profit of associates on portfolio of $6 billion = tracking around $1.15 billion. Yes, close to 20%. This is a build of the current trend of the companies included in this bucket, driven by Eurobank.
- Associates - YOY change in fair value vs carrying value = $100 million. Although not captured in book value, this is value creation for shareholders.
- Operating companies (Recipe, TCI, Dexterra etc) pre-tax earnings: $150 million.
- Investment gains (sales/revaluation) = $250 million (lumpy)
Let's take $170 million off my number to account for preferred stock already counted in 3 above. That brings my equity number to $2.23 billion. What will cause my number to fall by $900 million to your number of $1.3 billion? An economic depression?
I think my equity/derivative number is going to grow by 10% per year. Like underwriting, we are miles apart here.
5.) Corporate + Interest expense = $400 + $520. We are the same here.
Summary:
Two buckets explain most of the difference in our forecasts:
- Underwriting: you are $1.2 billion below me
- Return equity/derivative portfolio will deliver: you are $900 million below me
It looks to me like you are also assuming Fairfax stops growing today: assets, liabilities, equity.
Fairfax will likely grow its assets significantly in the coming years (organic growth + earnings reinvested). Growth in float will also increase liabilities. And shareholders equity will be increasing (earnings). The power of compounding at Fairfax could be significant the next couple of years (larger in size than anything we have seen).
My current estimate has Fairfax earning $3.7 billion in 2023 and a total of $11.3 billion 2023-2025. That is more than 50% of current shareholders equity. It is a huge number. This is likely coming in the next 10 quarters (2 have already been delivered) - not the next 10 years.
- How many birds are in the bush? $3.7 billion per year and growing.
- When are you going to get them out? One is coming every year (a little plumper).
- How sure are you? Its in line of sight.
Today, Fairfax shareholders currently have one bird firmly in one hand (2022) and the second bird is just about to land in the second hand (2023). The third one is getting ready to take flight. It looks to me like your analysis assumes away 1/2 of the birds - it just pretends they don't exist. Hence my analogy of "two birds in the hand are worth one in the bush" kind of logic.
What is the major flaw with my estimates?
Am I being way too optimistic? Perhaps. But my problem the past 3 years is I have been way too pessimistic with my forecasts - they have consistently been way too low.
I lean heavily on what I think i know today. I only go out max 3 years with my forecasts. And I admit my year-3 forecast is not as clear as my year-1.
As new news comes in I update my forecasts. Quickly. If bad news starts to pour in I will take down my estimates. Same if the opposite happens and good news comes in - I'll take up my estimate. So far, I have only been making upward revisions.
Another flaw with my forecasts is I do not incorporate compounding in very well. So my estimates in 2024 and 2025 for asset growth is too low. Higher assets likely means higher earnings. This is a big reason I think my forecasts are mildly conservative (overall).
20% growth in ROE is a double in 3.6 years (about). I think Fairfax might be able to do that. Looking out 4 years, a double in shareholders equity should result in much higher earnings - Fairfax's track record with capital allocation has been excellent since 2018.
Soft market in insurance? Bear market in stocks? Of course both will happen at some point in the future. Just like they have in the past. And good companies will benefit. And bad companies will fall by the wayside. P/C insurance was in a soft market from 2014-2017. In the last 6 years we have had 3 bear markets in stocks and the biggest bear market ever in bonds. Over the past 3 years Fairfax has thrived. And they didn't have the earnings/cash flow they do now. My guess is Fairfax will be just fine. But I remain open minded.
-
Fairfax Financial and Float - A Deep Dive
In my last post i reviewed P/C insurance float, largely through the writings of Warren Buffett - a pretty knowledgeable guy on the subject. In this post we are going to pivot and apply what we learned to Fairfax Financial.
Fairfax and Float: Summary of the topics we will explore:
- A short review of financial leverage
- Size of float
- Leverage provided by float
- Growth of float
- Cost of float
- Returns achieved on float
- Summary
----------
A short review of financial leverage
Balance Sheet: Assets = Liabilities + Equity
To grow (increase assets) a company can issue a liability like debt (borrow) or equity (shares).
Borrowing (a liability) is simply a way to use ‘other peoples money’ to finance growth / business activities. Using borrowed money to grow/invest is a financial strategy referred to as leverage.
Why use leverage to grow? To increase the return on equity. If equity stays constant but a firm can grow assets, which in turn grows earning, that will result in higher return on equity.
What is the rub? There is a cost to borrow, which is the interest rate charged on the loan. And today, with interest rates elevated, the cost is very high.
What does this have to do with P/C insurance companies?
P/C insurance companies are unique animals. Through the course of their business operations they generate something called float. Float is the money held by insurance companies when they receive premiums that has not yet been paid out to claimants.
Like debt, float is ‘other peoples money’ so it is technically a liability. Like debt, float can be used to purchase investments on the asset side of the balance sheet. The investments purchased with float will then grow total earnings, which results in a higher return on equity for the company.
Growing float (L) = growing investments (A) = growing earnings (E) = higher return on equity (ROE).
What is the rub? There is a cost to float and it is determined by underwriting (combined ratio). If an insurer is able to generate an underwriting profit over time, the cost of float is free (actually better than free… the ‘cost’ is a benefit).
So P/C insurance companies have the ability to use float (leverage) as a low cost way to boost return on equity (ROE).
Let’s now see how all of this applies to Fairfax.
----------
How much float does Fairfax have?
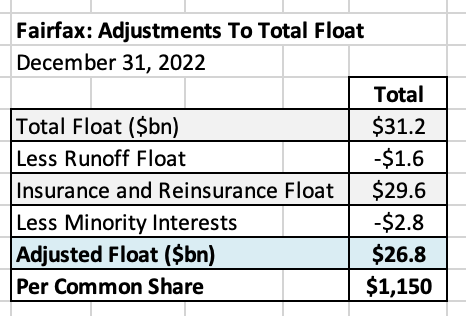
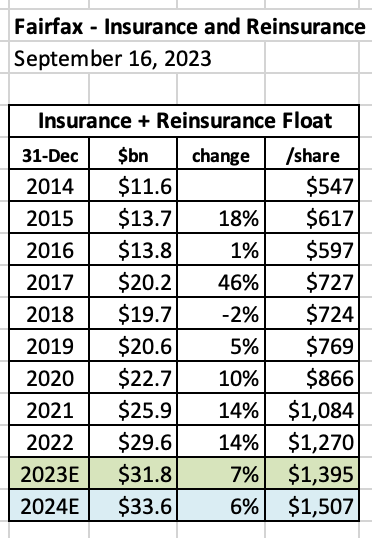
At December 31, 2022, Fairfax had $31.2 billion in total float.
However, to make our analysis more meaningful, we need to make 2 adjustments to this number:
- Remove float from runoff - Fairfax separates runoff when reporting underwriting results so to be consistent we will remove runoff float from our analysis. So in this post we will only be looking at float for insurance/reinsurance at Fairfax.
- remove minority interests - small amounts of Allied World, Odyssey, Brit and International are owned by minority shareholders. We also adjust float to account for this. By removing the share of float that accrues to minority shareholders we are left with the amount of float that accrues to Fairfax’s common shareholders, which is really the number we care about.
After making the 2 adjustments outlined above, at December 31, 2022, Fairfax had $26.8 billion in float working for common shareholders (i am going to call this ‘adjusted float’ in the remainder of this post.) Adjusted float was $1,150/share. Given the growth in Fairfax’s insurance business in 2023, ‘adjusted float’ today is likely well over $1,200/share. Of interest, Fairfax’s share price closed at $846 on Friday (Sept 15).
Now that we know the size of Fairfax’s float, let’s now look at it in relation to Fairfax’s total balance sheet.
----------
What is the leverage provided by Fairfax’s adjusted float?
Common shareholders’ equity at Fairfax was $17.8 billion at Dec 31, 2023. As we just learned above, adjusted float is $26.8 billion. Float is 1.5 x bigger than common shareholders’ equity.
The leverage is 1.5 times (adjusted float of $26.8 / common shareholders’ equity of $17.8). That means every 1% gain just from float will result in a 1.5% gain in common shareholders’ equity (ROE = 1.5%)
So if float delivers an 8% return to Fairfax that will boost common shareholder’s equity by 12% (deliver an ROE = 12%) all by itself.
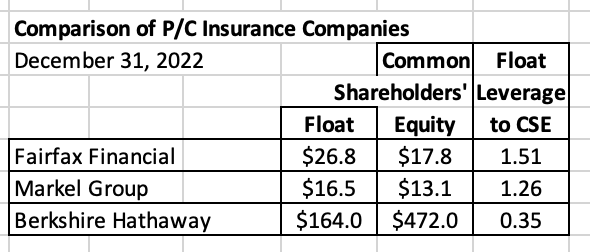
How does Fairfax’s adjusted float and leverage compare to other P/C insurance companies?
Fairfax (at 1.51 times) has more leverage from float than Markel (at 1.26 times). For interest, I also included Berkshire Hathaway. Leverage is much smaller for Berkshire Hathaway (at 0.35 times) compared to Fairfax and Markel and this makes sense given the significant growth of BRK’s non-insurance businesses over the years.
Note: my float number for Markel above is an estimate. Markel does not provide a float number. Float isn’t even mentioned in their annual report, which seems strange given its importance to the returns of the company.
----------
How much has total float grown in recent years at Fairfax?
Please note, in this section we will use the float numbers for insurance/reinsurance (runoff is excluded). However, i did not separate out minority interests. It would have been a lot of work and it wouldn’t have materially changed the conclusions (the growth numbers) - which is what we care about here.
The float of insurance/reinsurance at Fairfax has been growing rapidly for many years:
- 2014 to 2022 (8 years): total float grew 155% or at a compound growth rate of 12.4% per year.
- 2015-2017 growth was fuelled primarily by acquisitions (Brit, international, Allied World).
- 2020-2022 growth was fuelled primarily by organic growth (hard insurance market).
- 2023 and 2024 should see solid growth in float driven by continuation of the hard market and the GIG acquisition.
The management team at Fairfax has done a fantastic job of growing float over the past 8 years. And the prospects for continued growth are strong.
What is the cost of float? What is the trend?
Like borrowing money, float is a liability. Like all leverage (i.e. debt), float can be both good or bad - and this depends on the cost paid over time to hold the float.
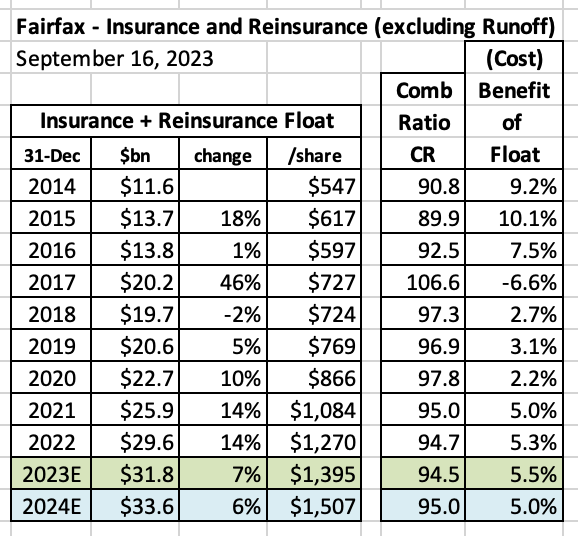
The ‘cost’ of float is measured by looking at underwriting results and the combined ratio. Fairfax excludes runoff when it reports underwriting results and the combined ratio (CR) so we can use their numbers in this section.
Summary:
- From 2014-2022 the CR averaged 95.7
- From 2018-2020 the CR ticked higher and averaged 97.3
- From 2021-2022 the CR ticked lower and averaged 94.7
- For 2023 my current estimate for the CR is 94.5
Fairfax has consistently earned an underwriting profit on its adjusted float. That is a big deal. It means that is has been able to secure $26.8 billion in adjusted float on very favourable terms. In fact the ‘cost’ of float is better than free - it is a benefit. I know, that is crazy - but it is true.
This is why Buffett has said in the past that he views float as being more valuable than a similar amount of equity. That statement is a real mind bender.
What is driving the improvement in the combined ratio?
My guess is two factors are driving the improvement:
- The hard market in insurance (that began in Q4, 2019) resulting in higher prices and better terms and conditions.
- Slow incremental improvement in the quality of Fairfax’s collective insurance businesses (resulting in better underwriting) driven by Andy Barnard and the leaders of the various insurance companies.
So float has been growing at 12.4% per year for the past 8 years. And the ‘cost’ has actually been better than free - a ‘benefit’ - over the same time frame.
But the story gets even better. Why? Return.
----------
What is the return Fairfax has been earning on its float?
Fairfax has $26.8 billion in adjusted float that is fully invested and earning a return for Fairfax shareholders.
For reference, the total investment portfolio at Fairfax was about $55.5 billion at Dec 31, 2022. Adjusted float of $26.8 billion represents 48% of total investments. It is significant.
In this section we are going to look at Fairfax’s return on total investments (a number we have a fair bit of confidence in). We are not going to try and break out Fairfax’s returns specific to float (which is a part of total investments). Again we are coming at this analysis at a very high level. If we subscribe a lower than average return to float (by assuming it is more skewed to short term fixed income investments) we would then need to attach a much higher return to Fairfax’s non-float investments to get to the correct average number. Instead, we are going to keep our analysis simple and use Fairfax’s average return on total investments as a very rough estimate for what is being earned on adjusted float.
From 2018-2022, Fairfax’s return on total investments averaged about 5.1% per year. Not surprisingly, the big drag was the fixed income portfolio. Fairfax’s interest and dividend income (a reasonable proxy for the return on the fixed income portfolio) delivered an average return of about 2.3% from 2014-2022.
Today? In 2023, Fairfax is tracking to earn an 8.6% return on its total investment portfolio. That is 69% more than the average of 5.1% of the past 5 years (2018-2022). That is a meaningful increase (big understatement!).
What are the biggest drivers of the increase in total return?
- Interest and dividend income, which is estimated to deliver a return of 4.5% in 2023. My current guess is interest and dividend income will increase to about 5% in 2024, which is more that double its run rate from 2014-2022.
- Equity markets have also rebounded YTD in 2023.
- Since 2018, very good capital allocation decisions - with the benefits increasingly showing up in reported results.
What about future returns?
Fairfax has extended its fixed income portfolio from 1.2 years at Dec 31, 2021 to 2.4 years at June 30, 2023. This locks in higher interest rates for the next couple of years. It seems reasonable to expect the management team at Fairfax to continue to make good capital allocation decisions.
Bottom line, Fairfax looks well positioned to continue to deliver strong investment returns moving forward. My current estimate has Fairfax earning a return of more than 8% on its investments in each of 2023, 2024 and 2025.
Ok. Let’s try and summarize everything.
----------
What have we learned about Fairfax and its float?
- ‘Adjusted float’ is $26.8 billion. It has been compounding at better than 10% per year for the past 8 years.
- ‘Cost’ of float is actually a benefit and the benefit has increased in recent years.
- The average return Fairfax is earning on its total investments is currently tracking to be 8.6% in 2023, up from an average of 5.1% from 2018-2022.
When looking at float, all three of the most important metrics are moving to the benefit of Fairfax and its shareholders. It is large and increasing in size. It is being obtained at a very favourable cost - better than free. And the return being achieved on its investments has spiked and the higher number looks sustainable.
So how does float fit into Fairfax’s valuation today?
This is where things get interesting.
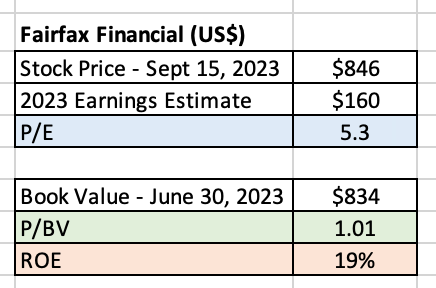
Fairfax’s stock is trading today at $846 which is about the same as book value ($834 at June 30, 2023). Mr. Market is saying that Fairfax is worth a little more than book value = common shareholder’s equity = $19.4 billion at June 30, 2023.
Mr Market appears to be assigning little value to the adjusted float that Fairfax has of $26.8 billion ($1,150/share) at Dec 31, 2022. Assigning a very low value to adjusted float might have made some sense when interest rates were very low. But in the current environment, where interest rates are high and likely to stay high, this makes no sense.
This perhaps explains why Fairfax trades at a PE of 5.3 x 2023E earnings (my current estimate of $160/share).
Perhaps Mr Market does not yet appreciate how large the increase in earnings from adjusted float is likely to be in the coming year(s) and the impact that will have on ROE at Fairfax (at 1.5 x leverage).
What did Fairfax have to say about float in its most recent annual report?
Fairfax 2022AR: “For our stock price to match our book value’s compound rate of 17.8%, our stock price in Canadian dollars should be $1,375. And our intrinsic value exceeds book value, a principal reason being that our insurance companies generate huge amounts of float at no cost. This is the reason we continue to buy back our shares as we continue to think they are very cheap.”
Fairfax has resumed buying back stock in August and September.
-
7 hours ago, TwoCitiesCapital said:
We can hope, but I just don't have the confidence interest rates will be at their current levels in 12-18 months.
I know what the Fed is saying. I know what they're currently doing. But this is also the same Fed that has forecasted interest rates to stay low through 2022 and then ran into 9% inflation with a ton of egg on their face.
I don't have any confidence in their projections of rates beyond a 3-month time horizon.
Because Fairfax has extended duration to 2.4 years I don't think where interest rates go in 12-24 months matters all that much anymore. My view is the management team will navigate their way though it - just like they have since 2018. Extreme volatility has been very good for the team at Hamblin Watsa and Fairfax shareholders. Active management is able to take advantage of the extreme dislocations when they happen. The $2 billion PacWest loan purchase (expected to deliver a total return of 10%) being the most recent example.
-
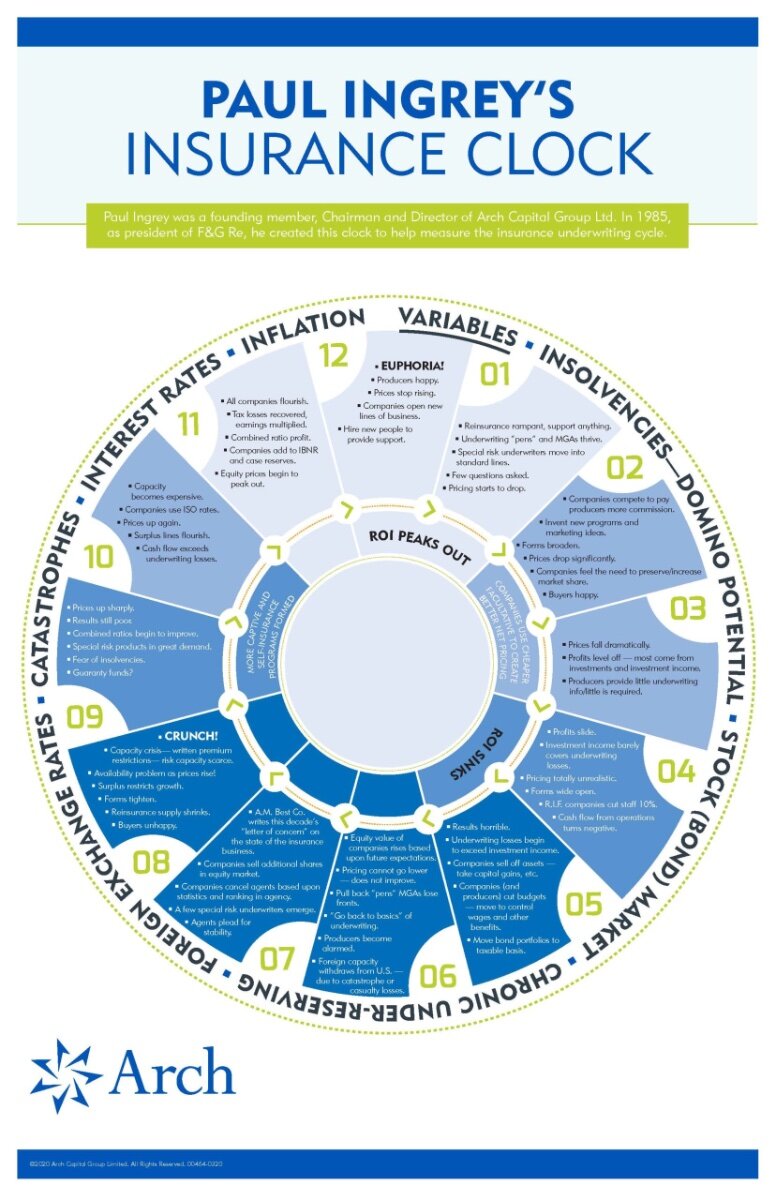
Comments on status of hard market from CEO of Arch Capital on their Q2 call (July 27):
“We often refer to the insurance clock developed by to help illustrate the insurance cycle. You can find the clock on the download cap for this webcast or on our corporate website. If you can't do the clock right now, just picture a traditional clock dial. For some time, we've been hovering at 11:00, which is one we expect most companies in the market to show good results as rate adequacy improves and loss trends stabilize.
“Last year, a popular topic on earnings calls was whether rate increases were slowing or what the rates were even decreasing. These are classic signs of the clock hitting 12 when returns are still very good, but conditions begin to soften. Yet here we are in mid-2023 and conditions in most markets remain at 11:00. We've even checked the batteries in the clock and they're just fine. The clock isn't broken. It's just that the current environment dictates an extended period of rate hardening.
“So what's sustaining this hard market? Well, I believe it's a relatively simple combination. Heightened uncertainty is driving an imbalance of supply and demand for insurance coverage. Since this hard market inception in 2019, we've had COVID to war in Ukraine, increased cat activity and rising inflation, all of which create significant economic uncertainty. Underwriters have had to account for more unknowns. Beyond those macro factors, industry dynamics also play a role in sustaining the hard market. Generally, in adequate pricing and overly optimistic loss trend assumptions during the soft market years of 2016 through 2019 have led to inadequate returns for the industry.
“The impact of these factors should cause insurers to raise rates and purchase more reinsurance in a capacity-constrained market with limited new capital formation. Put it all together, and it may be a while before the clock strikes 12 and we begin to move beyond this hard market.”
-
1 hour ago, MMM20 said:
Doesn't sound like it's worth starting my new P&C insurer yet then.
Is that good for FFH? Asking for a friend.
Food for thought for those who are convinced the hard market in insurance HAS to end soon. Imagine a world where Fairfax continues to grow top line insurance by 8% in both 2023 and 2024 (further increasing float). And interest rates remain higher for longer. That is probably a reasonable base case today. -
2 hours ago, UK said:
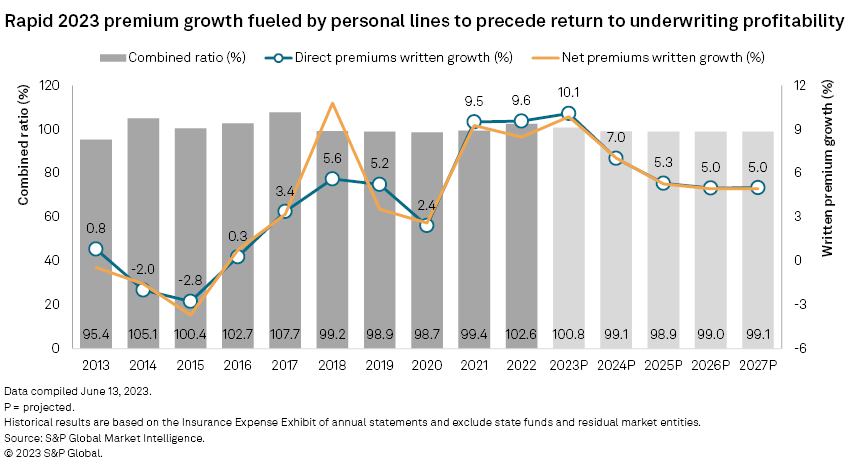
Wow, what a passimism from 2025, never saw this, what is the source of this table?
US P&C Insurance Market Report: Profitability to remain elusive in 2023 -
Like Indiana Jones, today we are going to set out on an adventure in search of long lost treasure. Something that most investors appear to have forgotten about. What do the legends tell us? Does it really exist or is it just a myth?
What am i talking about?
P/C insurance float (I’ll just call it ‘float’ moving forward).
Float is such a big (and important) topic we are going to tackle it in two posts. The first post (below) will focus on the theory - what it is and why P/C investors should care. The second post will then apply the theory to today using a real company - Fairfax Financial. My plan is to have the second post completed and out on Sunday.
Ancient history
Thirty years ago, talking about float was all the rage for P/C investors. Read old articles on investing in P/C insurance companies and a discussion of float will usually be front and center. And the champion of float from that era was, of course, Warren Buffett and his company Berkshire Hathaway.
So what happened?
Why has float apparently settled into into the dustbin of history and become a relic of the past?
- Due to competitive insurance markets, industrywide underwriting profit has remained illusive for the past decade. At the same time, top line organic growth slowed to a crawl.
- Returns on investments fell: P/C insurers put most of their investments into fixed income instruments. In their battle with deflation, global central banks took interest rates all the way into negative territory. The US 10 year treasury traded at a yield below 0.60% in August of 2020 and traded with a yield below 1.5% for much of 2021.
S&P Global: US P&C Insurance Market Report
Float lost its value
Breaking even on underwriting for a decade while returns on investments plummeted made having float far less valuable than at any point in recent history.
Another smaller factor: over the years, P/C insurance has become a much smaller part of Berkshire Hathaway’s business model. What did Buffett have to say about float in his 2022 letter to shareholders? Float is mentioned 4 times in one short paragraph - telling investors to go somewhere else if they wanted to learn more. Does this sound important to you? So ‘float’ also lost its biggest cheerleader.
Does this mean… Float is dead? Long live float?
No, of course not. Just because float is no longer appreciated (or followed) doesn’t mean it doesn’t matter. In fact, for those paying attention, the world has changed again. The conditions that made float a big deal 30 years ago have returned:
- Insurance has been in a hard market since about Q4 of 2019 - above average insurance companies are seeing improving underwriting results (cost of float) and significant top-line growth (supply of float) over the past four years.
- Global central banks now have an inflation fight on their hands - and ‘higher for longer’ is becoming the new mantra for interest rates. Fixed income yields have spiked higher across the curve. The 10 year US treasury closed today with a yield of 4.32%, a level where it last traded at in 2007. As a result, returns on float are improving greatly.
Both of these developments make having float today extremely valuable.
Except remember… pretty much everyone has forgotten about float.
What’s old will be new again.
Well, my guess is this is about to change. I think investors are going to get interested in float again.
What is going to cause the change?
A new generation of investors are about to discover something Warren Buffett hit on when he bought National Indemnity back in 1967: float, under certain conditions, can be a license to print money. Those ‘certain conditions’ have returned. And in recent years some insurance companies have started up the printing presses and are now starting to print money. More than anyone imagined possible.
==========
P/C insurance float: the basics
Let’s first do a quick review of float. Float is deceptive. It is kind of like compound interest as a concept. It is easy to define but very hard to actually understand.
Who better to teach us about P/C insurance float than the old master, Warren Buffett himself.
Float: the basic building block to use to evaluate a P/C insurance company
Back in the 1990’s, Warren Buffett was using P/C insurance as the core engine to drive Berkshire Hathaway’s profit growth. GEICO was purchased in 1996 and General Re was purchased in 1998. Given P/C insurance’s importance to Berkshire Hathaway shareholders, Buffett provided the following as a guide to help them understand P/C insurance as an investment.
BRK 1998AR: “With the acquisition of General Re — and with GEICO’s business mushrooming — it becomes more important than ever that you understand how to evaluate an insurance company. The key determinants are:
1.) the amount of float that the business generates;
2.) its cost; and
3.) most important of all, the long-term outlook for both of these factors.”
Well, Warren appears to be saying float is the most important thing to understand when evaluating an insurance company. Interesting, given how little press float gets today from analysts and investors.
What is float?
BRK 1998AR: “To begin with, float is money we hold but don't own. In an insurance operation, float arises because premiums are received before losses are paid, an interval that sometimes extends over many years.”
Float is money a P/C insurer has that it can use to invest. It is an asset but it is a liability (not equity). It is kind of like a very sticky deposit at a bank (a deposit is also a liability for the bank).
Because float is a liability, it is also leverage. Like all leverage (i.e. debt), float can be both good or bad - and this depends on the cost paid over time to hold the float.
What is the cost of float?
BRK 1998AR: “Typically, this pleasant activity (the insurance business) carries with it a downside: The premiums that an insurer takes in usually do not cover the losses and expenses it eventually must pay. That leaves it running an "underwriting loss," which is the cost of float. An insurance business has value if its cost of float over time is less than the cost the company would otherwise incur to obtain funds. But the business is a lemon if its cost of float is higher than market rates for money.”
Underwriting determines the ‘cost’ of float.
This point is critical. Over time, if an insurer can produce an underwriting profit on its insurance business that means the cost of its float is actually a benefit - that is better than free. That means the insurer is actually getting paid to hold the float. This is far better than ‘the cost the company would otherwise incur to obtain the funds.’
Float is a pile of money that an insurance company can actually earn two income streams from: underwriting (if float is obtained at a benefit) and investing.
Sounds like Buffett was on to something.
To summarize: according to Buffett, a good P/C insurance company:
- Has a large amount of float
- Is a good underwriter - is able to generates the float at a favourable cost (ideally a benefit)
- Has a good long term track record - of both growing float and as a solid underwriter
Buffett’s secret sauce: P/C insurance float
Buffett’s genius has really been two pronged:
- Use P/C insurance float as an ever-increasing low cost (free) source of capital/leverage used to push profits even higher.
- These growing profits were then continuously reinvested into great companies/equities (outside of insurance) that have also become compounding machines over time and pushed profits even higher.
OK. So there is a quick review of float, explained with the help of Warren Buffett.
To help us understand float even better, let’s look at it now from a balance sheet perspective.
==========
Float and the balance sheet
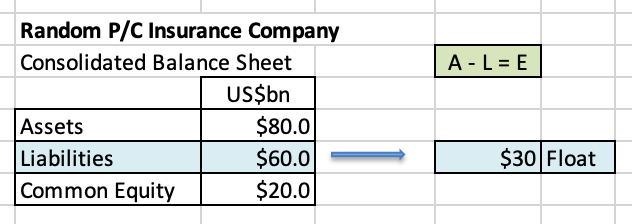
Let’s create an imaginary insurance company - called Random P/C Insurance Co - and create a fictitious balance sheet.
Our company has $80 billion in assets, with $60 billion in liabilities and $20 billion in common shareholders’ equity. Of the total liabilities of $60 billion, float is $30 billion. The summary of the balance sheet is below:
We are also going to assume common shareholders’ equity = book value.
We are going to make up more numbers below. We are using numbers that make our calculations easy. Please don’t focus too much on the exact numbers. Instead, focus on the information they are trying to convey - especially about leverage.
Cost of float
Let’s assume our insurance company is a slightly above average underwriter with a combined ratio (CR) of 96 - this translates into a ‘benefit’ of float (better than free - our company is actually getting paid to hold their float).
Return on investments (which includes float)
Let’s assume our insurance company is above average in terms of the return it earns from its total investments (which includes float) - let’s assume it earns 8% on average.
We are also going to assume there are no taxes.
The return of Random P/C Insurance Co
When we put the two together we get:
- Benefit of float (CR of 96)
- Return on investments = 8%
Let’s assume Random P/C Insurance Co earns a total return of 10% on its float.
This means our insurance company is earning the following:
- $30 billion float x 10% = $3 billion.
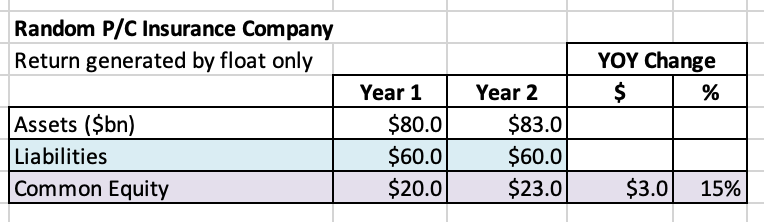
Can we calculate the actual leverage provided by the float?
Yes. Total earnings from float of $3 billion will flow though the income statement and increase retained earnings, which will then flow though to the balance sheet and increase both assets and common shareholder equity by $3 billion.
So a return from float of 10% results in an increase in common shareholders' equity of 15%.
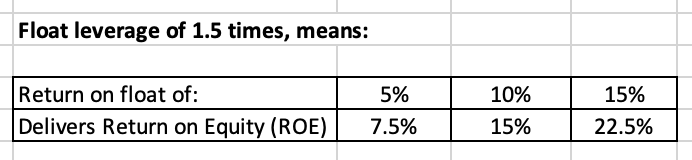
The leverage can be calculated as follows: total float / common shareholders' equity.
In our example
- float of $30 billion / common shareholders' equity of $20 billion = 1.5 x leverage
Common equity, debt and total investments
The above increase in common shareholders' equity was driven solely by float. A company is also going to generate earnings from its common shareholders’ equity - the funds provided by shareholders. Perhaps it also uses a little debt to generate more earnings. Any returns generated by its other investments (those other than float) need to be added to the numbers above.
==========
Below Buffett summarizes how float fits into the big picture
Berkshire Hathaway 1995AR: “In more years than not, our cost of funds has been less than nothing. This access to "free" money has boosted Berkshire's performance in a major way.
“Any company's level of profitability is determined by three items:
1.) what its assets earn;
2.) what its liabilities cost; and
3.) its utilization of "leverage" - that is, the degree to which its assets are funded by liabilities rather than by equity.
“Over the years, we have done well on Point 1, having produced high returns on our assets. But we have also benefitted greatly - to a degree that is not generally well-understood - because our liabilities have cost us very little. An important reason for this low cost is that we have obtained float on very advantageous terms. The same cannot be said by many other property and casualty insurers, who may generate plenty of float, but at a cost that exceeds what the funds are worth to them. In those circumstances, leverage becomes a disadvantage.
“Since our float has cost us virtually nothing over the years, it has in effect served as equity. Of course, it differs from true equity in that it doesn't belong to us. Nevertheless, let's assume that instead of our having $3.4 billion of float at the end of 1994, we had replaced it with $3.4 billion of equity. Under this scenario, we would have owned no more assets than we did during 1995. We would, however, have had somewhat lower earnings because the cost of float was negative last year. That is, our float threw off profits. And, of course, to obtain the replacement equity, we would have needed to sell many new shares of Berkshire. The net result - more shares, equal assets and lower earnings - would have materially reduced the value of our stock. So you can understand why float wonderfully benefits a business - if it is obtained at a low cost.”
Float is better than equity?
This question is a bit of a mind bender. Because of its unique ‘cost’ (i.e. low cost or even a benefit), in the past Buffett has said that he views float as being better than equity.
BRK 1997AR: “Since 1967, when we entered the insurance business, our float has grown at an annual compounded rate of 21.7%. Better yet, it has cost us nothing, and in fact has made us money. Therein lies an accounting irony: Though our float is shown on our balance sheet as a liability, it has had a value to Berkshire greater than an equal amount of net worth would have had.”
Well, suggesting float is better than equity is perhaps a bridge too far. However, I think we can conclude that float matters a great deal. Especially today (in a high interest rate world).
Conclusion
OK. So now we know what float is and the key metrics to use to evaluate P/C insurers. Who should we start with? That is an easy question to answer. In our next post (coming Sunday), we will do a deep dive on float at Fairfax Financial to see what we can learn.
==========
How Warren Buffett Achieves Great Returns Every Year - Advantages of Insurance Float
-
1 hour ago, Spekulatius said:
Looks to me like inflation is picking up again due to rising energy and commodity prices. I think it's well possible that we have seen the bottom in inflation or are close to it.
The tricky thing about inflation is just when you think you have it licked it pops higher again. At least that was the experience in prior inflationary episodes. Central banks are starting to look and sound like they think they have inflation licked. I am not so sure.
Here in Canada we have record government spending.. that continues to increase. We also have a severe housing shortage so all levels of government are now rallying to try and get more housing units built (yes, at the same time the Bank of Canada is trying to slow housing). Rental prices continue to increase (at least in Vancouver) driven by record low vacancy rate. Minimum wages in almost all jurisdictions are up meaningfully year over year. Wealth effect has minted millions of millionaires (housing bubble) over the last decade - these people continue to spend. Much higher interest rates is spiking interest income of savers (like my mother-in-law) and that new meaningful income stream is leading to increased spending. Oil spiking is now feeding through to increases at the gas station….
In my province we are building a massive hydro dam in the north east of the province. We are building two large pipelines (one to Vancouver and the other to Kitimat) thousands of miles long at something like triple the original cost. A LNG facility is being built in Kitimat. The Province is also doing a massive rebuild of the infrastructure destroyed by record flooding 2 years ago (all over the province). Forest fires just wiped out hundreds of expensive houses in the interior - now those all will get rebuilt. Oil and gas and mining is all doing well. I could go on and on.
This is just my long winded way of saying that i agree with you. This suggests to me we might see higher for longer when it comes to interest rates. Like perhaps well into next year. And if inflation actually pops again perhaps we see central banks actually tighten even more.
I really have no idea. So no strong conviction. But it is super interesting…
-
On 9/14/2023 at 8:14 AM, Hamburg Investor said:
Hi, this is my first post here, as I just joined, but have been following here for a long time. I am a Fairfax Shareholder since 2013. It's always been one of my Top5 holdings. Over the last year I bought more and more and it's my biggest stock holding today. I am German and live in Hamburg (sorry for my english...).
Totally agree, @Thrifty. I replied to Viking at Seeking Alpha regarding the assets topic here; unfortunately they kicked Vikings and my postings (don't know why...?) and as Viking asked me to join I just did and now I just thought to write that down again, why I think Assets should grow way stronger and more in a range of $4bn to $9bn per year over the next couple of years:
At the core my question was, if asset growth isn't a function of earnings and growth (... decline. ..) of float. So maybe something like: Add 1. Earnings (Dividends, interest, Earnings from profitability in insurance) to 2. return of stock portfolio (e. g. assuming 10% growth but subtracting dividends again, so not double counting) to 3. the swap (so assuming a price increase of Fairfax of e. g. 10%/year for being conservative and do the math, how the Swap as an asset develops from year to year...) to 4. growth of float (GIG to come...). Subtract taxes, overhead costs, runoff dividends, buybacks (although the last too add to growth of intrinsic value, but not to asset growth; but buybacks help accelerating the "per share" assets. One could assume reinvesting the dividends, for getting the IRR...). I am pretty sure I missed something and might be wrong with this or that, but maybe the direction of thinking is ok? Anyway, if one does that, you'll get way more assets growth from year to year. As Thrifty shows here, the asset base has grown around $3bn per year since 2 years, and then there have been headwinds to asset growth like the massive devaluation of bonds. So why should assets growth go back to $1bn?
Another perspective regarding asset growth could be to just look at Prems outspoken goal to grow Fairfax intrinsic value with a rate of return of 15% on average over the very longterm. If you think he'd manages that, then the assets (minus dividend, minus buybacks) should roughly grow at the same pace. So maybe 15% growth minus 1.5% (div) minus 3.5% (buybacks) for 10% asset growth/year (and around 13.5% assets per share growth). If you'd invest the divs back to Fairfax and leave away taxes and assume a buying price of 1.0 book, then the investors personal growth in Fairfax assets would again roughly equal that 15%.
And then I think, Prem wouldn't tell us shareholders 15% as a goal, if he would assume, reaching 15% being a "hard to do" thing. My best guess is that he'd communicate with a margin of safety. He'd tell us 15%, if he'd think that's safe and 16% or even 18% being a "maybe", but not the other way around. In fact he has reached some percentage points over that 15% CAGR over 37 years and this with just over a decade of zero rate interest in the rearview mirror (so just leaving a pretty hard time for insureres behind us, not to mention the soft market, growth beating value, the deflation insurance, that I wouldn't call a bet...). Look at Prems CAGR before interest went down.And then there's another question: When, if not now, should Prem make over 15% to get to that average of 15%? When if not in a hard market, in times where value outperforms growth, when the companies CR is well below the first 20 years of Fairfax and below the 37y average? And then there's GIG, Digit, Eurobank, the Swap, Fairfax India at depressed valuation, all those wholly owned little insurance companies over the world really growing strong on average... Long story short: I think, Fairfax might grow intrinsic value (and asset base + divs + buybacks) well over 15% and should grow not below 15%. Therefore personally I think 15% for the next few years being conservative, so with a margin of safety included (of course it still could come worse as always, but I think this being a nice margin of safety, others may disagree, which is fine).
One note regarding relative valuation: The S&P500 is valued a bit above a PE of 25. Fairfax is valued at a PE of 6 (or 5). At the same time Fairfax roe (15%) might be above that of the S&P500 (return has been around 11.8% on average, so roe should be around that percentage too...). So Mr. Market seems a little bit weird again wanting 4 (or 5) times as much from me for each share of the markets "okay" earnings then for Fairfax "good earnings". If Fairfax would triple tomorrow and I had to choose either taking the S&P500 or Fairfax as a holding for 10 years, I personally wouldn't bet on the S&P500 being the better investamnt over the next 10 years.
@Hamburg Investor thank you for coming over to the dark side and joining CofBF. The more discussion and debate we can get the better. We are all trying to learn (and hopefully make a little money along the way).Your post above outlines a major flaw with my 3 year forecasts for Fairfax: i am likely being too conservative for 2024 and 2025. Part of this was by design. When i started at Kraft many years ago one of my first bosses taught us newbies the art of sandbagging when building a forecast (very important when your quarterly bonus payout was tied to it).
On reflection i likely need to make some adjustments to parts of my 3 year forecast (i feel a little like i am getting my hand slapped by senior management - a little sandbagging was ok… but too much got you into trouble).
What am i missing? Two things:
1.) capital allocation skills of Hamblin Watsa: they have been hitting the ball out of the part since 2018 when it comes to capital allocation.
2.) power of compounding - well understood by members on this board:
- a 15% return per year is a double in less than 5 years.
- a 20% return is a double in about 3.5 years.
So yes, i need to get more realistic with my estimate for how fast investments (and returns from those bigger numbers) will be growing in the coming years. Growth of growth is the secret sauce that is now kicking in at Fairfax (due to double digit growth in insurance and investments AND improving underwriting and much higher investment returns).
Today, Fairfax is delivering a 20% ROE. I think they will be able to deliver a high teens ROE over the next three years (2023-2025).
I like my earnings per share estimate of $160/share for 2023. My estimates for 2024 ($165) and 2025 ($174) need to move higher.
-
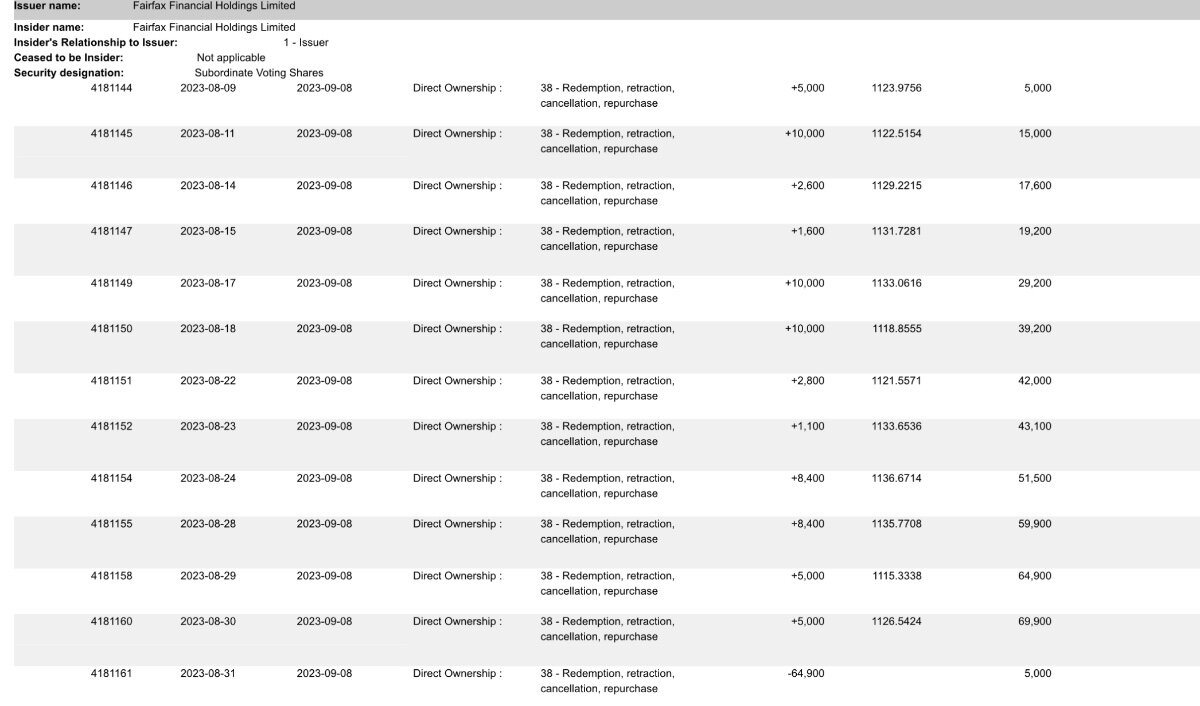
23 minutes ago, SafetyinNumbers said:
Fairfax buybacks in August
@SafetyinNumbers thanks for posting. It is nice to see the backbacks happening again. I am hopeful Fairfax can keep taking out a minimum of 2% of effective shares outstanding each year - keeping the trend in recent years going. The buybacks also signal the company continues to see their shares as being undervalued. Obviously shares aren’t as cheap as prior years but the company’s earnings and prospects have improved greatly in recent years. -
10 hours ago, glider3834 said:
Yep they have secured 55.3%, subject to customary approvals, and you are right it will take time to get regulatory approvals
@glider3834 thanks for posting. I missed this last transaction. Great news. I was wondering if Eurobank was going to have to pay an additional premium to get over 50% and the answer is no. When they went to €2.35/share they had their ducks in a row to get +50%. Smart.


Bank of Canada: Have we entered a new era of structurally higher interest rates?
in General Discussion
Posted
I heard this on a podcast a while back (not sure which one). I did a quick search online and found the following article:
“For a typical wood-frame condo development in Vancouver, the fees represent 29.25 per cent of the unit’s final purchase price.”
- https://biv.com/article/2023/07/government-fees-inflate-risk-uncertainty-bc-builders#:~:text=Municipal fees account for the,is attributed to regional fees.
“Government fees imposed on a project can range from those that cover infrastructure-related needs (DCCs and development cost levies), community contributions that will offset density (CACs), a federal goods and service tax (GST), building and development permits, property transfer taxes and the speculation and vacancy tax.
“ In Vancouver, there is also the additional empty homes tax and a public art fee, according to a February 2023 Urban Development Institute, Pacific Region report.
“The total cost of government fees represents 32.72 per cent of rent that the end-user pays in a typical wood-frame, purpose-built rental development in Vancouver.
“Municipal fees account for the majority of this total at 44.27 per cent; federal and provincial fees account for 28.39 and 24.15 per cent, respectively. The remaining 3.18 per cent is attributed to regional fees. For a typical wood-frame condo development in Vancouver, the fees represent 29.25 per cent of the unit’s final purchase price.”