


Viking
-
Posts
4,689 -
Joined
-
Last visited
-
Days Won
35
Content Type
Profiles
Forums
Events
Posts posted by Viking
-
-
I am surprised by the complacency in financial markets to what is going to be happening shortly in the middle east. Israel is going to hammer on those responsible for atrocities committed. I was listening to the Israeli ambassador yesterday on Bloomberg Surveillance… frightening was is likely coming.
The issue for financial markets are tail risks. How big does this war become? Of course, today we do not know (it is unknowable today). My read is this has the potential to get very messy very fast.
What to do as an investor? Holding some exposure to oil makes sense to me. As well as having a little cash to be able to be opportunistic depending on how things play out.
-
14 hours ago, nwoodman said:
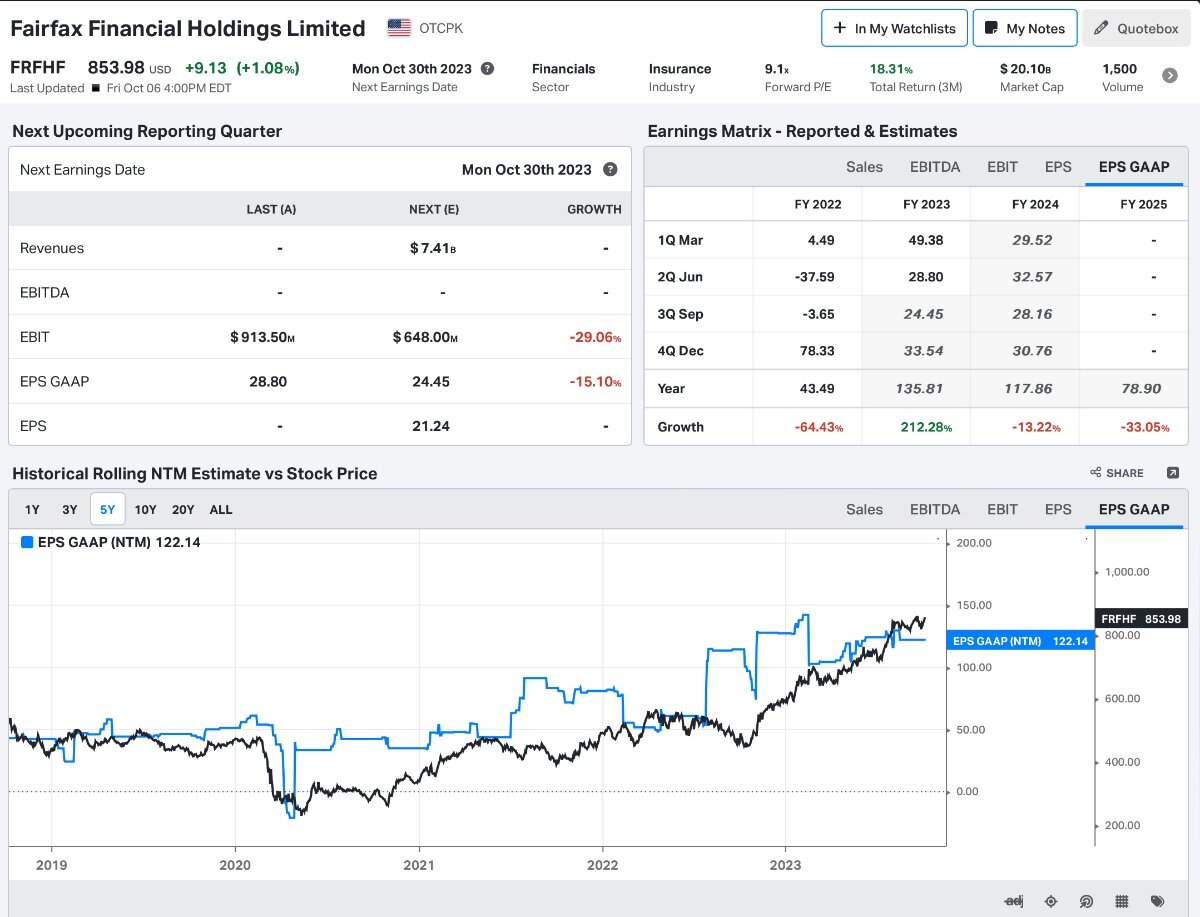
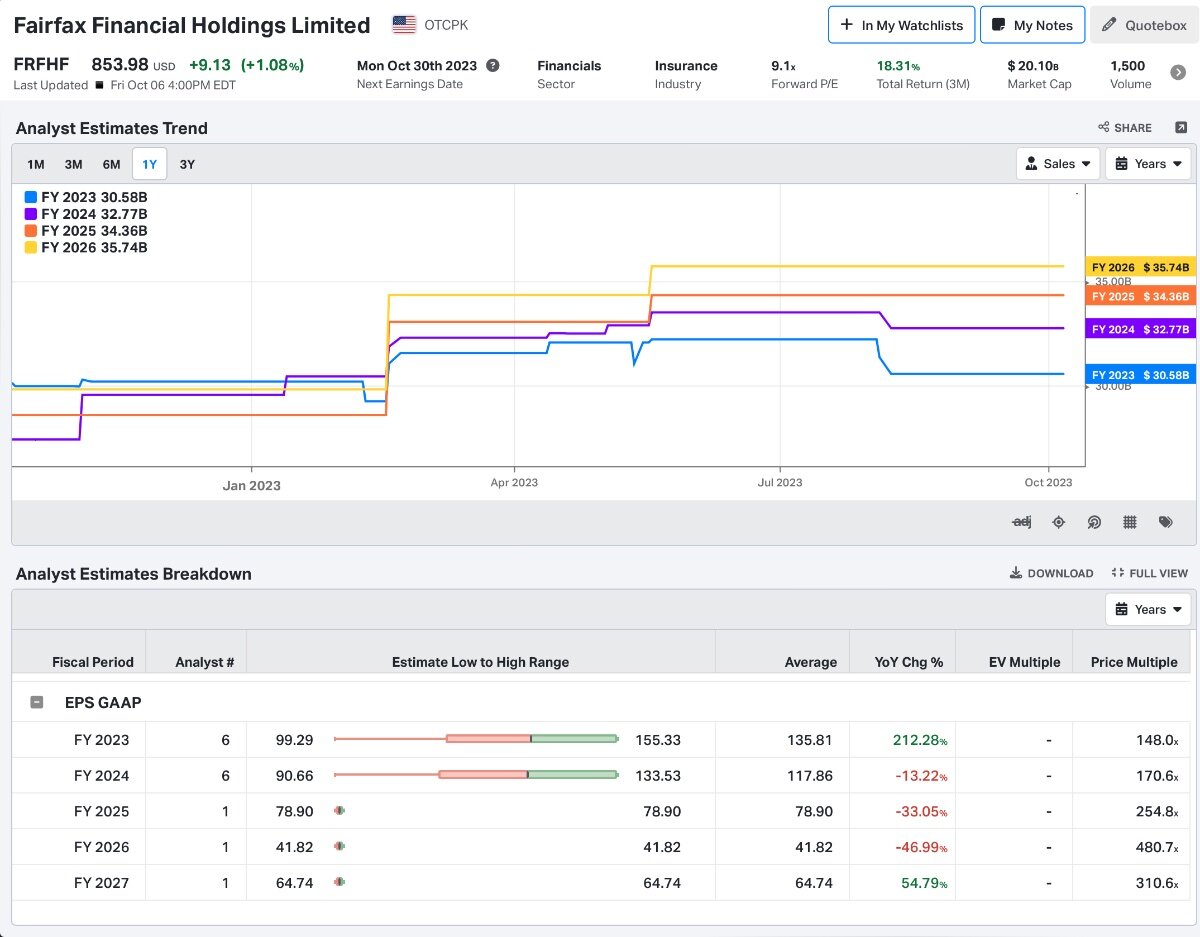
@Viking Great work as always. Agree capital allocation/deal flow is key moving forwards. Higher for longer definitely helps though, if nothing else it keeps the proverbial foot on the competition’s throat. Analysts forecasts are still very much in the “they screw it up” and interest rates fall fast. FWIW (not much) this is the view of the few: FY23 $US135, FY24 $US118 and FY25 $US79 they then fall of the proverbial cliff (our Morningstar friend no doubt). A very different view indeed.
In terms of capital allocation, I see a minimum 10% just via Omer’s buybacks, then around 12-15% buying back their own shares. So they should have no problems reallocating incremental capital at sensible rates at least for the next few years. Even then, I don’t believe that the 11-12% compounding machine, that has been in operation for 30+ years, is broken. You have to keep telling yourself that if these “analysts” were any good they would be running their own book.

@nwoodman my guess is analysts struggle with the volatility in Fairfax’s earnings. The industry views volatility as ‘risk’ and as a big negative (hence, big hair cut to earnings). Which just seems a little bizarre to me.
i think analysts also struggle with the current size of the spike in earnings. They don’t trust its staying power - lots of posters on the board also don’t trust the sustainability of earnings.
So estimates for 2024 are lower than 2023. And estimates for 2025 are lower than 2024 (much lower than 2023). Makes no sense to me.
-
FYI, I did an edit to this note on October 11 to incorporate feedback received from other board members over the past 5 days (since my original post was made).
---------
Below is an update my 3-year earnings estimate for Fairfax. Please note, forecasts are a guess at a point in time. To state the obvious, things are constantly changing. As a result, annual forecasts can become outdated quickly.
Summary
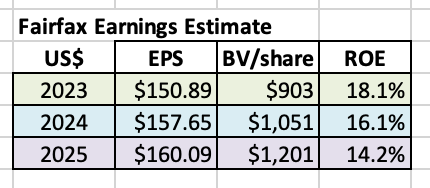
My estimate is Fairfax will earn about $151/share in 2023.
- Shares closed on Oct 11, 2023 at $840, so the current PE = 5.6
- BV = $834, so the current P/BV = 1.01
What could we see for EPS in Q3?
For Q3, 2023, my guess is EPS will come in at around $20/share.
- Underwriting profit: likely a tailwind, given the mild hurricane season.
- Interest and dividend income: likely a tailwind.
- Unrealized gains from equities: likely a tailwind. My tracker has the gains at $266 million. But equity market averages were down about 4% in Q3 so the holdings I don't track might be a headwind.
- Unrealized losses from fixed income: likely a headwind, given the big move in bond yields further out on the curve. In Q2, the mark to market loss from bonds was $405 million; perhaps we see a loss of $250 million or so in Q3?
- Currency will be a headwind given the strength of the US$ in Q3.
I am forecasting earnings of $151/share for 2023. Reported earnings in 1H were $84/share, so that leaves about $67/share to come in the 2H. An estimate of around $20/share for Q3 and another $45/share for Q4 seems reasonable (this assumes the gain from the GIG transaction falls in Q4).
2023-2025 Forecast
Most line items in my forecasts have been changed a little to reflect ‘new news.’ A couple of weeks ago i updated the ‘interest and dividend’ bucket and this bumped the estimates higher for 2024 and 2025. I also reduced ‘net gains (losses) on investments’ a little in 2023 to reflect the spike in bond yields we are currently seeing.
The hardest piece to forecast with Fairfax is capital allocation. Fairfax looks poised to generate a significant amount of earnings from 2023-2025 (our forecast period). But we don’t know today exactly where the future cash flows will be invested. Looking at the last 5 years, the management team has been outstanding with capital allocation. My guess is they will continue to make good decisions (on balance) and this will benefit shareholders - providing a possible tailwind to my forecasts.
I am assuming interest rates remain roughly at current levels. Of course, this will not be the case.
Below is an 8-year snapshot for Fairfax. It communicates in a concise manner the dramatic transformation that has happened at this company, beginning in 2021. Look at the trend in operating earnings - it is a pretty amazing story. Fairfax today is like a phoenix, rising from the ashes of its past, renewed and stronger.
What are the key assumptions?
1.) underwriting profit: Estimated to increase to a record $1.27 billion in 2023.
- I am forecasting Fairfax’s combined ratio (CR) to remain flat at 94.5 in 2023, and then to increase modestly to 95 in 2024 and 95.5 in 2025. For each year, I am assuming a ‘normal/historical’ level of catastrophe losses.
- The Gulf Insurance Group (GIG) acquisition should add about $1.7 billion to net written premiums when it closes (Q4?).
- Everything I read suggests the hard market will continue in 2024, although at a slower pace.
- Bottom line, low double digit growth in net premiums written seems reasonable for 2024.
2.) interest and dividend income: Estimated to increase to a record $1.9 billion in 2023.
- Interest rate pickup: the average duration of the fixed income portfolio was 2.4 years at June 30, 2023. A significant amount of the fixed income portfolio matures each quarter allowing Fairfax the opportunity to reinvest the proceeds at much higher interest rates. A pickup of $20 million per quarter seems reasonable.
- New business: PacWest loans will deliver incremental interest income (of $80-$90 million?) beginning in Q3, 2023. I am modelling an increase of about $20 million per quarter.
- GIG should add about $2.4 billion to the total investment portfolio when it closes.
- Eurobank: the plan is to start paying a dividend in 2024. If this happens, we might see dividend income increase by up to $70 million.
- Potential headwind: Short-term treasury rates might come down more quickly than expected in 2024 (2 rate cuts are currently expected in 2H 2024). If this happens, interest income on cash/short term balances could decline in 2H 2024.
3.) Share of profit of associates: Estimated to increase to a record $1.075 billion in 2023.
- Earnings at Eurobank, Poseidon/Atlas, EXCO, Stelco and Fairfax India, in aggregate, should continue to grow nicely. I am watching interest costs at Poseidon; this could be a headwind.
- 2023 headwind: Resolute Forest Products was sold earlier in 2023. It contributed $159 million in 2022.
- 2024 headwind: I estimate GIG will contribute $100 million in 2023. To reflect the GIG transaction, I removed $100 million from my 2024 estimate.
4.) Effects of discounting and risk adjustment (IFRS 17).
- Interest rate changes are an important driver for bucket. Rising interest rates have caused this bucket to increase. Given I am forecasting interest rates moving forward to remain about where they are today, I am reducing this number for 2024 and 2025. My estimates here could be a little messed up.
5.) Life insurance and runoff.
- This combination of businesses lost $167 million in 2022. I am forecasting this bucket to lose $225 million in each of the next three years. This is hard to know.
6.) Other (revenue-expenses): improving results from consolidated holdings.
- In the near term, we could get small write downs in both Boat Rocker and Farmers Edge. With Covid in the rear-view mirror, earnings at Recipe could move higher ($100 million per year?). Earnings at Dexterra are growing again. AGT is a sleeper holding. Grivalia Hospitality is in its peak investment phase; earnings could grow nicely looking out a year or two. This bucket is poised to grow nicely for Fairfax in the coming years. Yes, the results will be lumpy.
7.) Interest expense: A slight increase to the current run rate.
8.) Corporate overhead and other: A slight increase to the current run rate.
9.) Net gains on investments: Estimated to come in around $550 million in 2023. Unrealized losses in the fixed income portfolio was a headwind in Q2. This likely continues in Q3, 2023.
My estimates for 2024 and 2025 assume (this is very general):
- Mark-to-market equity holdings of about $7.8 billion increase in value by 10% per year, or $800 million.
- A small bump of $100 to $200 million per year for additional gains (equities and fixed income).
10.) Gain on sale/deconsol of insurance sub: This is a wild card. This is where I put the large asset sales. In 2022, it was the sale of pet insurance business. In 2023:
- Ambridge: closed May 10, 2023 and resulted in a pre-tax gain of $259.1.
- GIG: expected to close in late 2023 at which time Fairfax will record a pre-tax gain of $290 million.
For 2024 and 2025, I estimate no gains from sales/write up of assets. There likely will be something:
- Perhaps we get a Digit or AGT IPO.
- Perhaps Fairfax sells another holding for a large gain.
This ‘bucket’ is likely where I will be most wrong with my forecast. Developments here will likely have a material positive impact to Fairfax’s reported results (earnings and book value).
11.) Income taxes: estimated at 19% (historical average rate)
12.) Non-controlling interests: estimated at 11% (historical average rate)
13.) Shares Outstanding: Estimated that effective shares outstanding is reduced by 400,000 per year. This is a little lower than the recent run rate for buybacks.
Notes:
- Underwriting profit: Includes insurance and reinsurance; does not include runoff or Eurolife life insurance.
- Interest and dividends: Includes insurance, reinsurance and runoff.
Return on Equity Calculation
Return on equity (ROE) is calculated below using ‘average equity’ which is:
- (PY ending BV/share + CY ending BV/share) / 2
I think most of the industry (other P/C insurance companies, analysts) calculate ROE using an average number for equity. So, this makes my estimates more comparable with industry numbers.
From 2023-2025, my average estimated ROE for Fairfax is 16.2%. The average ROE from 2018-2022 was 10.1% so Fairfax is ‘kicking it up a notch.’ This is not surprising given the increase we are seeing in operating income (considered the high quality part of earnings).
-
On 10/5/2023 at 4:55 PM, Castanza said:
Yeah I agree I think there will begin to be a massive push from the top down to get this switch made. You can already see it in the manufacturing.
Will be interesting to see what types of business opportunities pop up in the EV repair industry. It’s going to be a bumpy road imo.
My uneducated guess is the transition will take much, much longer than everyone expects. From everything i read there is simply not enough raw materials to go around. There are important bottlenecks that people are not yet thinking about (like China). And current government policy is being driven by… political objectives… and not based on what actually needs to be done. This of course means we are wasting time.
We will get there. But the process will likely be one step back and then one step forward and then one step back… My guess is it will be painfully slow.
Unless governments start up the printing presses and throw even more money at the transition. Possible. Which of course, will keep inflation high. Which will keep interest rates high.
Bottom line, i am optimistic. But expectations on timing are running way too hot… in my humble opinion.
-
5 hours ago, gfp said:
It still feels like you are getting this backwards. Tell me what accounting treatment other than "available for sale" you think is more transparent? Surely not held to maturity??
@gfp as an investor i want to live in the land of reality. My point is for many P&C insurers, reported EPS and ROE in 2022 is not reflecting what actually happened with their balance sheet. The bonds they hold are worth a lot less today than they were worth in December of 2021. My view is the P/C insurers with long duration portfolios at Dec 2021 are now at a disadvantage versus peers - they are sitting on big losses but more importantly, their pickup in interest income will lag peers for the next year or two.The accounting rules are the accounting rules - i get that. I am not suggesting anything should change. Or that there is a ‘better’ way to report results. Investors just need to be aware of the logic/build.
Allied and Odyssey had their credit ratings upgraded earlier this year by AM Best. One of the reasons cited was improved financial profile of the parent Fairfax - and i am pretty sure AM Best referenced how well Fairfax’s navigated the spiking of interest rates (avoided big losses).
My point is when looking at P/C insurers, understanding their the makeup of their fixed income portfolios is important. What is the duration? What is the credit quality?
I probably should have split my post into two separate posts… but half the time i write a post i am not sure where it will take me when i start… and sometimes the topic is a little furry (for me). I appreciate all the feedback/pushback because as this is how i learn.
My view hasn’t changed. I see the insurers with low duration portfolios in Dec 2021 as being clear winners today. And if we get a recession, insurers with portfolios with higher credit quality will likely be the relative winners. Yes, over a 5 year span this matters much less. But at inflection points i think it matters.
-
17 hours ago, StubbleJumper said:
That's what's really fascinating. If you think back to the spirited discussion on this board in February, the debate was whether FFH had pushed out its duration sufficiently. Some board participants were satisfied with the modest increase in duration but some were disappointed that it hadn't been pushed out 3 or 4 years. Well, perversely, we were all sorta wrong! A better return would have been available by keeping the portfolio in a short duration! However, I still like the risk management aspect of having pushed it out like what FFH has done. They will capture some upside as they roll the maturing securities but there is no major downside for the next couple of years
SJ
@StubbleJumper It will be interesting to look back in 6 months at what we were thinking today... It really does provide a great example of how difficult it is to navigate the current environment.
We have had bear markets is equities in 2018, 2020 and 2022. Perhaps another one in 2023. And we have had a historic bear market in fixed income for almost 2 years now. The kicker is we still don't know the impact higher rates will ultimately have on the economy. Or the future path of inflation (is it dead or does it come roaring back). The dynamism is one of the things I love about investing.
-
19 hours ago, gfp said:
"A couple of insurers do not use ‘available for sale’ accounting. Fairfax Financial and Berkshire Hathaway. "
Thanks for generously sharing your work on Fairfax again Viking. I'm not sure I follow your reasoning on Berkshire completely. You state that Berkshire doesn't use "available for sale" accounting but then quote Berkshire has saying "substantially all of our investments in fixed maturity securities are classified as available-for-sale."
Anyway, if the choice is between available for sale and held to maturity, it seems like AFS is the more honest accounting treatment of the two.
Also for Berkshire's average duration, I believe large portions of the treasury bill position should be included with the 1 and 2 year paper that gets classified as investments in fixed maturities. There is no question that from a bond investment point of view Berkshire has managed the current environment better than Fairfax. What we don't know is if we will feel the same 2 or 3 years from now since Berkshire is unlikely to attempt to lock in current rates for 3 years and Fairfax seems eager to do so. Fairfax is my second largest position and I am (mostly) happy with how they handled the recent rate environment. But while Fairfax was locking up 3.75% reinvestment rates on this year's future maturities, Berkshire was buying 5.5% bills and taking no losses.
@gfp thanks for the feedback and comments. Yes, I made an error with Berkshire so I have edited my post.
The challenge I have with 'available for sale' as an investor is the disconnect between reported EPS/ROE and reported BV. In a rising interest rate world it is pretty big for some insurers. For a fixed income portfolio, I think bond duration and credit quality matters a lot. 'Available for sale' - to me - kind of says it doesn't matter and I am having a hard time understanding that.
In terms of Fairfax, I will be happy if they get things 'approximately' right moving forward. It is unrealistic to expect them to continue to hit the ball out of the park like they have done recently.
-
How Does Fairfax Look When Compared To Other P/C Insurers?
There are lots of methods an investor can use to value a company and its stock price. In this post, we are going to use a method called ‘relative valuation.’ We are going to try and see what we can learn about Fairfax’s current valuation by comparing the company to a group of other P/C insurers.
To state the obvious: all P/C insurance companies have unique business models. For fun, I have also included Berkshire Hathaway.
We are going to keep the analysis very top line. What are the key take aways? Does anything jump out?
Who are we going to look at?
Here is the list of the seven P/C insurers we will compare (in alphabetical order):
- AIG: the fallen star; turnaround
- Berkshire Hathaway: the gold standard
- Chubb: traditional insurer; international
- Fairfax Financial: invests in equities; international
- Intact Financial: largest P/C insurer in Canada
- Markel: Baby Berk; US focus
- WR Berkley: traditional insurer; US focus
Change in Book Value
The most important metric used by investors and analysts to evaluate a P/C insurance company is book value. Yes, it has its flaws. However, it is a good place to start.
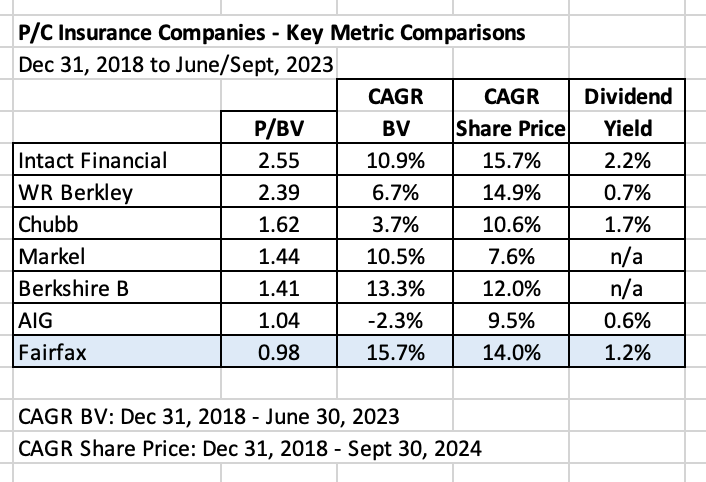
We are going to look at the change in book value from Dec 31, 2018 to June, 30, 2023, or a period of 4.5 years. This is a good length of time to use to understand how each insurer has performed. It also will allow us to compare our 7 companies. We have sorted their results in a table below from the best to the worst performers.
So which company has produced the largest increase in BV over the past 4.5 years?
Fairfax Financial.
Fairfax has increased BV by 93% over the past 4.5 years, a compound rate of 15.7% per year.
Were you expecting that? I bet you weren’t expecting that.
Five of the seven companies paid a dividend (and WR Berkley also paid a special dividend). I did not include this in my Total or CAGR calculation as I don’t think it would have changed the order.
Change in Share Price
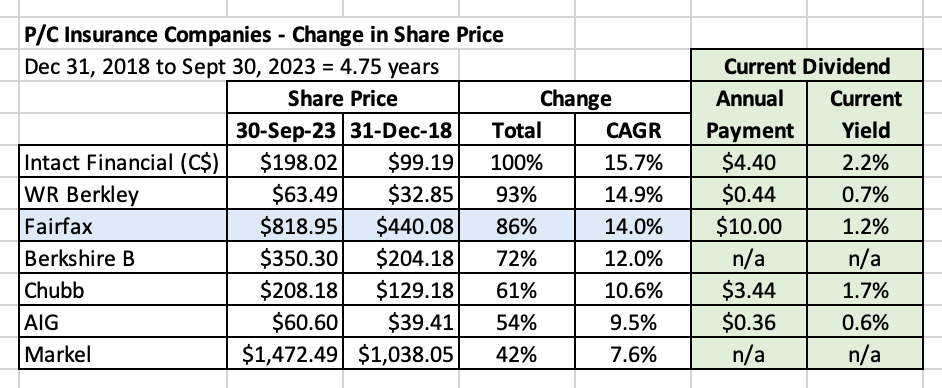
Next, we are going to look at the change in the share price from Dec 31, 2018 to Sept, 30, 2023, or a period of 4.75 years. Once again, we have sorted the results in a table from best to worst performers.
Which company has produced the largest increase in share price over the past 4.75 years?
Intact Financial is the winner here. This is not a surprise to anyone living in Canada. Intact is by far the largest P/C insurer in Canada and the company and stock have been outstanding performers for many years. WR Berkley and Fairfax also delivered strong increases.
Performance for most P/C companies has been good to very good. This makes sense because there are lots of quality companies on this list. And the hard market in P/C insurance began in about Q4 2019 and that has been a big tailwind.
Now let’s put book value and share price together.
Price to Book Value
Both Intact and WR Berkley trade at the highest P/BV multiple. This is not surprising given they also saw the biggest increases in share price over the past 4.75 years. These two companies have been compounding machines for investors the past 5 years.
Does anything in the chart below jump out?
The company that has been compounding book value at the fastest over the past 4.5 years is also trading at the lowest P/BV valuation - and it is below 1.
Yes, our friend Fairfax.
Based on P/BV, Fairfax certainly looks cheap but let’s keep digging.
What about future prospects. Stock prices are supposed to be forward looking.
What about earnings expectations for 2023?
This is where things get a little messy.
Why?
Average duration and ‘available for sale’ accounting.
Please note: I am not an accountant. There may be errors in my analysis – you are warned. With what follows, I am not trying to say that insurance companies are doing anything wrong. They are following the accounting rules as they are laid out. My point is investors need to be aware of the ‘grey zones’ when it comes to accounting and reported results. Eyes wide open.
Most insurance companies have most of their massive fixed income portfolio stuffed in the ‘available for sale’ bucket for accounting purposes. As a result, gains and losses do not flow through to net income. Gains and losses instead flow through to ‘accumulated other comprehensive income’ (AOCI) and book value.
For the past 18 months, spiking interest rates is resulting in big unrealized losses in the fixed income portfolios of many insurance companies. But reported EPS looks great. And reported ROE. Yet book value has gotten hit (for some companies).
Let’s look at an example
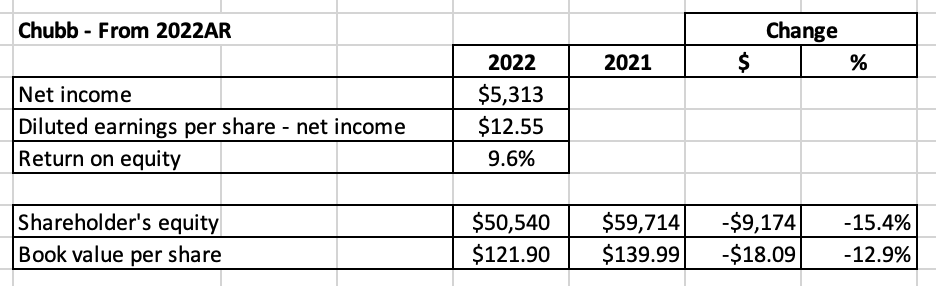
An investor reading Chubb’s earnings report from 2022 will see reported earnings per share of $12.55/share and a reported ROE of 9.6%. Solid year. Right?
Well no. In 2022, shareholders’ equity dropped $9.2 billion. Book value per share at Chubb dropped $18.09/share or 12.9%. Holy shit batman!
Which is it? Solid or terrible?
When there are big changes in book value, investors need to understand what caused the swing and make sure they are comfortable with the reasons.
Evan Greenberg, the CEO of Chubb, is one of my favourite insurance CEOs to listen to during earnings season. This guy is also one heck of a salesman. Here is his explanation for the big drop in book value (the quote below is from Chubb's 2022AR):
"Rising rates and a strong dollar during the year produced sizable mark-to- market losses on our fixed income invested assets, which have temporarily impacted book value in a significant way. For the year, book and tangible book value per share decreased 12.9% and 23.5%, respectively, driven mostly by after-tax net realized and unrealized losses of $10.9 billion in the investment portfolio. Ironically, I view the mark as a good thing because it speaks to future income power. We are predominantly a buy-and-hold, fixed income investor with an average portfolio duration of 4.5 years, so the mark is transitory. In fact, about half of the mark will accrete back to book value over two years."
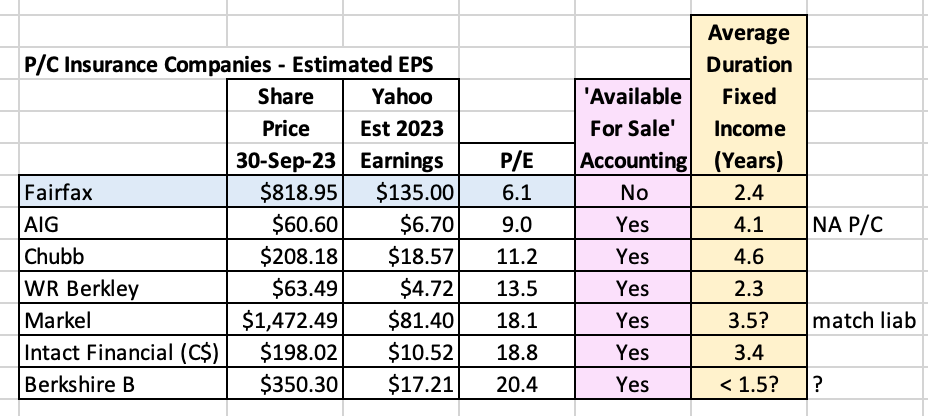
Is this the case with all P/C insurers?
No. Fairfax does not use ‘available for sale’ accounting. As a result, changes each quarter in the value of the fixed income portfolio flow through to net earnings and book value. From what I can see all other six P/C insurers use ‘available for sale’ accounting.
‘Higher for longer’ interest rate regime means that these unrealized losses are likely not going away soon. And with interest rates spiking further on the long end of the curve we are likely going to see more unrealized losses getting booked in Q2 when insurers report. P/C insurers with long duration fixed income portfolios will be impacted more than those with low duration portfolios.
Apples and oranges
But here is the interesting thing. When Fairfax reports, the changes in the fixed income portfolio will be reflected in both EPS and book value. When the other P/C insurers report, the changes in the fixed income portfolio marked ‘available for sale’ will not be captured in EPS. Yes, it will be captured in book value.
When Fairfax reported Q2 results guess what analysts didn’t like? The ‘miss’ on investment gains (losses) that lowered reported EPS a little. It was driven by… drum roll please… yes, unrealized losses in fixed income (as interest rates went up in Q2).
The benefit for Fairfax? Moving forward, should interest rates fall meaningfully then unrealized gains in fixed income will flow though to EPS and book value.
But the big unrealized losses don’t matter… right?
What happens if we get a 1 in 50 year catastrophe in the next year or two while a few of these P/C insurers are sitting on big unrealized losses in their fixed income portfolio? Not likely. But it would create added stress.
Do you think insurance regulators and ratings agencies care about the big hit to shareholders’ equity/balance sheet of some insurance companies? My guess is they do.
This is probably another reason (along with a few others) that explains why the hard market is continuing.
There is another more immediate reason investors should care
Opportunity cost. As important as underwriting profit is, the biggest driver of earnings for P/C insurance companies is interest and dividend income. Especially moving forward with interest rates at 15 year highs.
The insurance companies with low duration fixed income portfolios are able to pivot faster into much higher yielding securities and the significantly higher investment income will earn through very quickly. This is a big earnings advantage that low duration P/C companies will have over long duration peers for the next couple of years.
What is the average duration of fixed income portfolios?
It should be noted, at Dec 31, 2021, Fairfax had an average duration of 1.2 years on its $37 billion (at the time) fixed income portfolio. In 2H 2021, they sold $5.2 billion in corporate bonds and at a yield of 1% (and booked a realized gain of $253 million). Fairfax has slowly been extending duration over the past year and it now sits at 2.4 years.
Who was the other company with a super low duration on its fixed income portfolio at Dec 31, 2021? Berkshire Hathaway. Fairfax was in good company.
WR Berkley should also get a shout out as they were sitting at around 2.4 years at Dec 31, 2021. Not as good as Fairfax or Berkshire, but much better than peers.
In the chart below is where most P/C insurers sit today with average duration. I guessed at Markel’s at 3.5 years - they only say it matches their liabilities. Please let me know if you know what the actual number is. Same if anyone knows the average duration of Berkshire’s fixed income portfolio. My guess is it is less than 1.5 years. For AIG, I used North America P/C.
Ok, let’s get out of that rabbit hole and return to our next comparison.
What are expectations for earnings for 2023? How do PE’s compare?
To keep things simple, I pulled the 2023 earnings estimates from Yahoo finance for each of our seven companies.
Looking at PE, Fairfax is trading at 6.1, the cheapest valuation and it’s not even close. Because of how it reports changes in its fixed income portfolio, reported EPS is also more representative of economic reality - higher quality.
Why is Fairfax such an outlier? As we discussed already, Fairfax’s $40 billion fixed income portfolio was positioned perfectly for a spiking interest rate environment. Fairfax avoided the losses (which protected its balance sheet). And has been able to quickly pivot and take advantage of much higher interest rates. Interest income is spiking and this is spiking earnings. Investors still do not appreciate (believe?) the speed, size and durability of the increase in interest income.
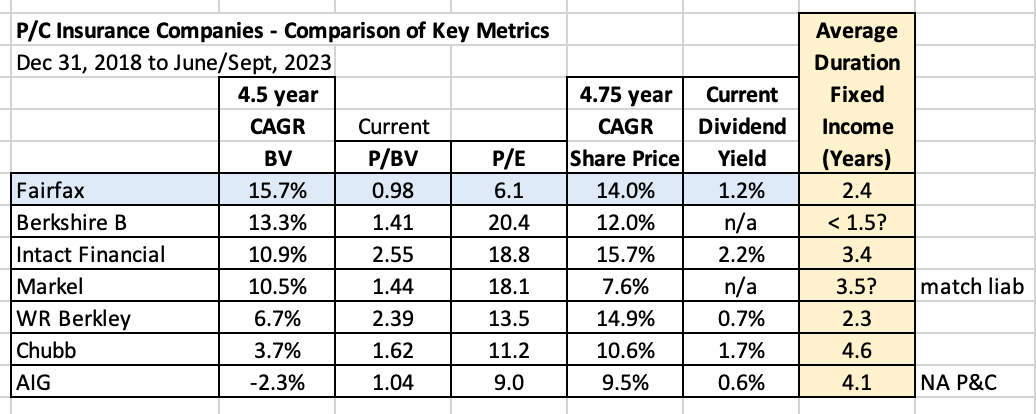
Conclusion: Using ‘relative valuation,’ how does Fairfax look relative to peers?
Which insurance company has delivered the strongest CAGR in book value over the past 4.5 years?
- Fairfax at 15.7% (not including the dividend)
Which insurance company is the cheapest based on P/BV?
- Fairfax at 0.98.
Which insurance company is the cheapest based on PE (2023E)?
- Fairfax at 6.1.
Which insurance company has navigated the spike in interest rates the best?
- Fairfax. And Berkshire would be a close second
“Although expectations of the future are supposed to be the driving force in the capital markets, those expectations are almost totally dominated by memories of the past. Ideas, once accepted, die hard.” Peter Bernstein
The turnaround at Fairfax happened a couple of years ago. Blinded by old ideas about the company, most investors still don’t see it. Even though it has been showing up in much improved results for a couple of years now. That is called a ‘fat pitch’ by the smart guy who lives in Omaha.
————
‘Available-for-sale’: What was said in a few of the annual reportsBerkshire Hathaway - 2022AR page K-75
(d) Investments in fixed maturity securities
We classify investments in fixed maturity securities on the acquisition date and at each balance sheet date. Securities classified as held-to-maturity are carried at amortized cost, reflecting the ability and intent to hold the securities to maturity. Securities classified as trading are acquired with the intent to sell in the near term and are carried at fair value with changes in fair value reported in earnings. All other securities are classified as available-for-sale and are carried at fair value. Substantially all of our investments in fixed maturity securities are classified as available-for-sale. We amortize the difference between the original cost and maturity value of a fixed maturity security to earnings using the interest method.
WR Berkley - 2022AR page 68
(D) Investments
Fixed maturity securities classified as available for sale are carried at estimated fair value, with unrealized gains and losses, net of applicable income taxes, excluded from earnings and reported as a component of comprehensive income and a separate component of stockholders' equity.
Chubb - 2022AR page F-14
e) Investments
Fixed maturities, equity securities, and short-term investments
Fixed maturities are classified as either available for sale or held to maturity. Available for sale (AFS) portfolio is reported at fair value, net of a valuation allowance for credit losses, with changes in fair value recorded as a separate component of AOCI in Shareholders' equity.
Held to maturity (HTM) portfolio includes securities for which we have the ability and intent to hold to maturity or redemption and is reported at amortized cost, net of a valuation allowance for credit losses.
Markel - 2022AR page 10K - 77
c) Investments. Available-for-sale investments and equity securities are recorded at estimated fair value. Available-for-sale investments include fixed maturity securities and short-term investments. Fixed maturity securities include government and municipal bonds and mortgage-backed securities with original maturities of more than one year. Short-term investments include certificates of deposit, commercial paper, discount notes and treasury bills with original maturities of one year or less. Unrealized gains and losses on available-for-sale investments, net of income taxes, are included in other comprehensive income. Unrealized gains and losses on equity securities, net of income taxes, are included in net income as net investment gains or losses. The Company completes a detailed analysis each quarter to assess declines in the fair value of its available-for- sale investments. Any impairment losses on the Company's available-for-sale investments are recorded as an allowance, subject to reversal.
-
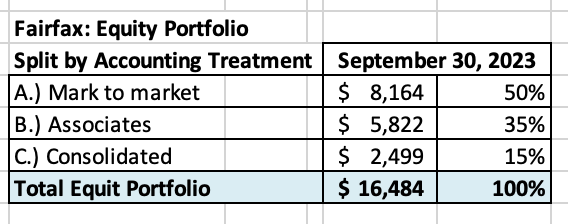
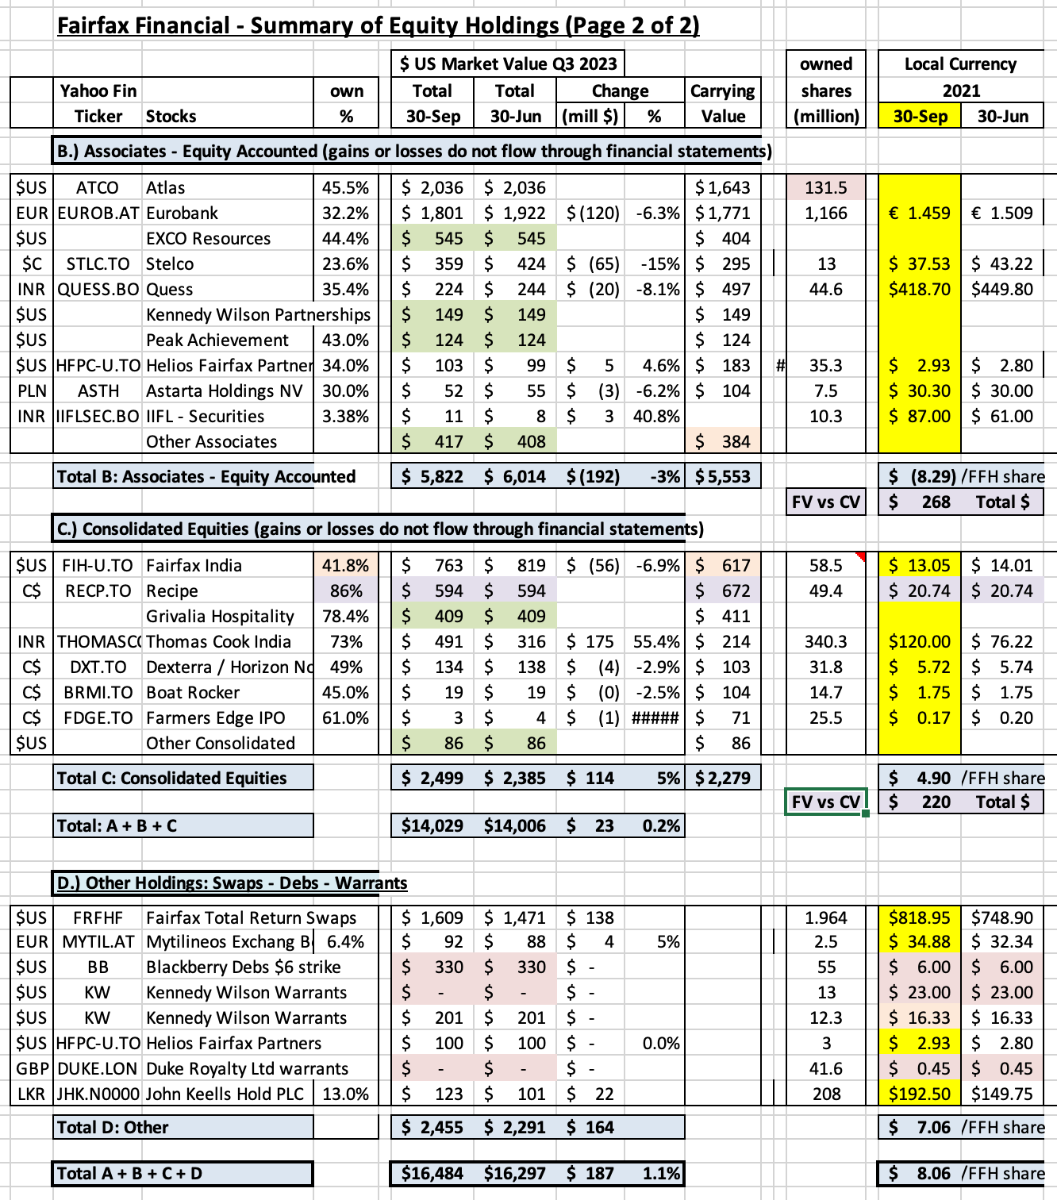
What was the change in the value of Fairfax’s equity portfolio in Q3?
Fairfax’s equity portfolio (that I track) ended Q3 with a total value of about $16.5 billion. This was an increase of about $187 million or 1.1% from June 30 to September 30, 2023. The increase in the quarter works out to about $8/share.
The S&P500 finished Q3 down 3.6% so Fairfax outperformed by 4.7% which is quite a large margin over three months.
Currency was a big headwind for Fairfax in Q3; the US$ went on a tear higher in September. Fairfax has a lot of international equities so this makes its outperformance in the quarter even more impressive.
Please note, I include holdings like the FFH-TRS position in the mark to market bucket and at its notional value (which was $1.6 billion at Sept 30). I also include debentures and warrants that are in the money in this bucket.
To state the obvious, my tracker portfolio is not an exact match to Fairfax’s actual holdings. It also does not capture changes Fairfax has made to its portfolio during the quarter. As a result, my tracker portfolio is useful only as a tool to understand the probable directional movement in Fairfax’s equity portfolio (and not the precise change).
Please let me know if you see any errors. I do mess up every once in a while.
Split of total holdings by accounting treatment
The split by account treatment is provided below. About 50% of Fairfax’s equity holdings are mark to market and will fluctuate each quarter with changes in equity markets. The other 50% are Associate and Consolidated holdings.
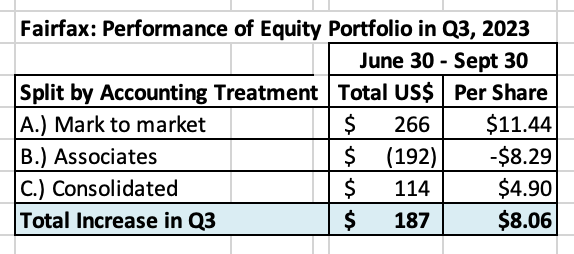
Split of total gains (losses) by accounting treatment
- The total change was an increase of $187 million = $8/share
- The mark to market change was an increase of $266 million = $11.44/share. Only changes in this bucket of holdings will show up in ‘net gains (losses) on investments’ (along with changes in the value of the fixed income portfolio) when Fairfax reports results each quarter.
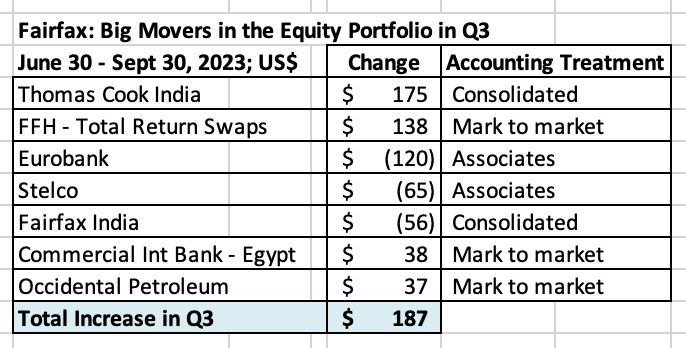
What were the big movers in the equity portfolio?
- Thomas Cook India was the star performer in Q3. Their business was hit hard by Covid. They reported results for the most recent quarter were much higher than expected. Importantly, all parts of the company (including Sterling Resorts) are now performing at a very high (record?) level.
- The FFH total return swap position (giving exposure to 1.96 million Fairfax shares) continues to perform exceptionally well. This position is up +$900 million since it was initiated in late 2020.
- Eurobank got hit by the recent severe weather issues in Greece. Also by ECB announcement? Regardless, Eurobank looks very well positioned. Currency was a headwind.
- Fairfax’s big equity purchase in Q2 was to significantly increase its position of Occidental (its current value is $391 million). With oil spiking over $90, the timing of this purchase is looking pretty good today.
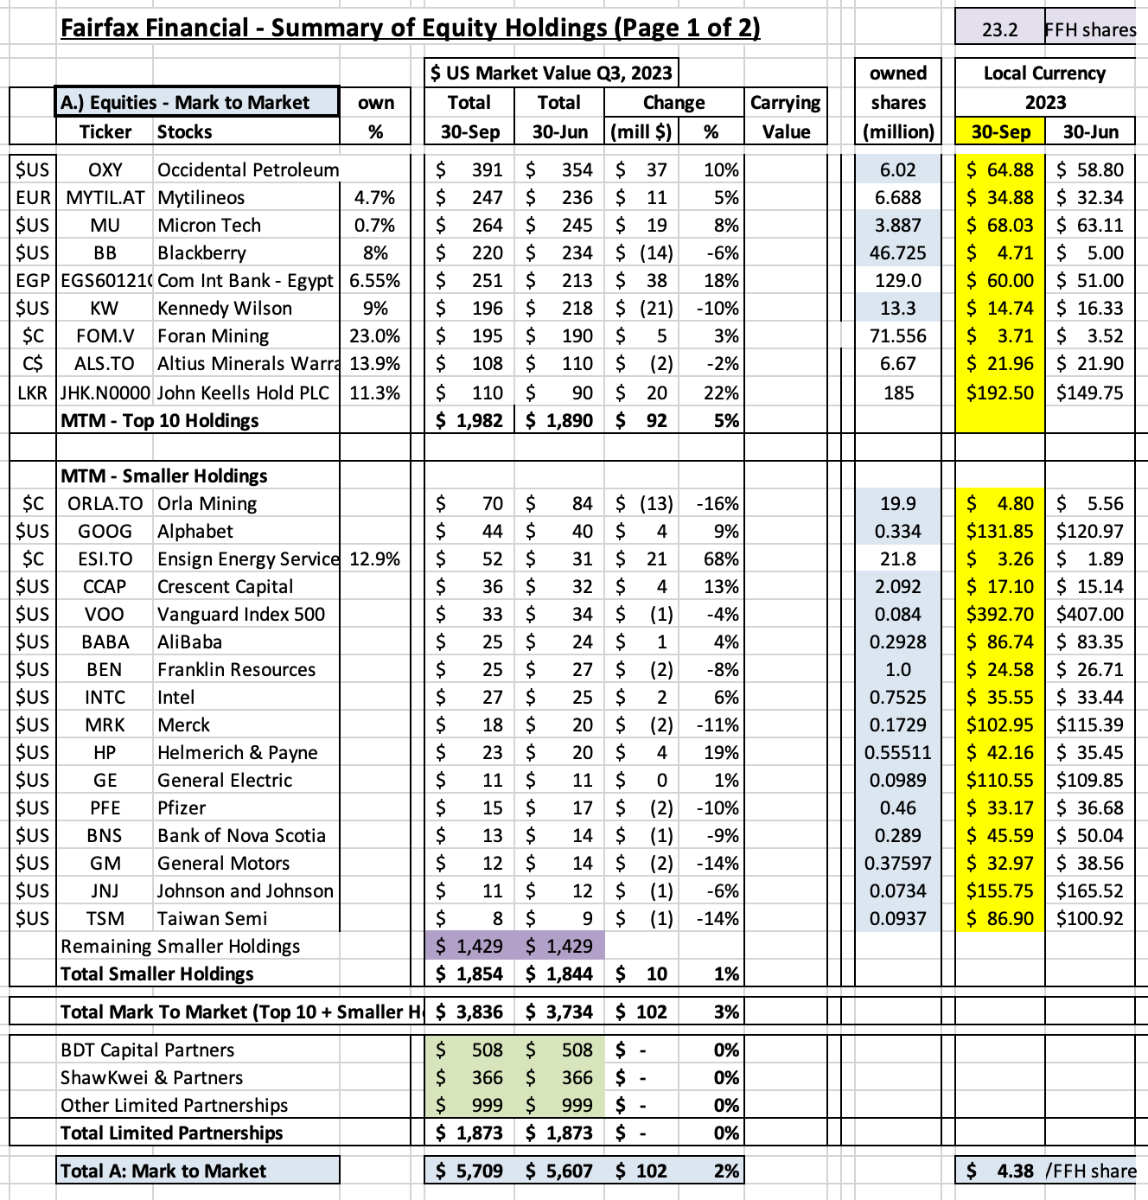
Below is a copy of my Excel spreadsheet (next 2 pages) if you want a closer look.
For Associate and Consolidated holdings, the excess of fair value to carrying value was $488 million or $21/share (pre-tax). Book value at Fairfax is understated by about this amount (less the tax impact). What is the split?
- Associates $268 million = $11.56/share
- Consolidated $220 million = $9.48/share
-
59 minutes ago, nwoodman said:
Nah, should have had my morning coffee before posting
 There has been some rumours doing the rounds about the ECB raising the minimum reserve requirements (MRR). Morgan Stanley did some modelling attached, TLDR minimal impact on Eurobank. I guess I am just a little surprised as I figured this would be up and to the right given the low valuation but Greece has been suffering their share of misfortunes of late.
@nwoodman Thanks for the colour on Eurobank. I was wondering what was up with the share price. The important think to me is the health of the underlying business. As long as that keeps improving i am not too fussed about the share price. -
23 hours ago, Castanza said:
Thanks for sharing your thoughts.
Been following Canadian housing loosely for a few years now ever since my BIL built a beach cottage for ~200k all in then sold it to some guy from Toronto for ~600k barely 3 years later….
A LOT of people up there bemoaning how easy it is to flip houses. When your barber starts talking about real estate flips it’s time to pay attention.
https://x.com/jonflynnrestats/status/1697757207574503482?s=46
Follow a few Canadian Relators on Twitter. Any you would suggest?
@Castanza I think the best person to follow to understand Canadian housing is a guy named Ron Butler (@ronmortgageguy). He is a mortgage broker. He also has a YouTube channel. He is old school and very opinionated... and he is very crusty (swears a lot). But he is pretty rational - so he is a pretty good counter balance to the realtors on Twitter. His outlook is probably too negative/bearish.
Mark Mitchell follows housing current events pretty well. He is on YouTubeI also follow Steve Saretsky (@SteveSaretsky). He is in Vancouver and that is my market. I find he is pretty good for a local perspective - and pretty balanced (for a realtor). Steve also is on YouTube and also likes to talk about Macro and Canada (The Loonie Hour)
-
24 minutes ago, Ulti said:
Viking…. I’ m curious….How does this tie into Canada’s immigration policy (if it even does.) If Canada allows wealthier immigrants and immigrants of high needs into the country, would this not cushion the RE market somewhat… And is this RE problem mainly tied to Toronto and Vancouver areas…( I’m an ignorant USA southerner )
Your question has a couple of layers.
1.) supply / demand. Record numbers of people coming to Canada matters (immigration/international students/foreign workers). I think it might be as high as 1.2 million people over the last year. Canada’s population is about 40 million. This has created a housing crisis - we simply do not have the housing today for this level of new residents to work. This is a political time bomb that has been ticking for a few years… and it looks ready to go off at any time…
But this level of new demand will work to keep real estate prices high.
2.) per capita GDP in Canada has been falling for the past 5 years. We have a sick economy (back to that housing thing). So the government (all levels) views immigration/international students as cash cows for all the money they bring into the country. The revenue from these groups are built into budgets of governments/universities. If they slow the numbers their budgets go further into deficit (they are already running record deficits).
3.) My read is Toronto and Vancouver are at the epicentre. But the real estate mania is everywhere in Canada. In my old home town in rural BC (a 7.5 hour drive from Vancouver) a 1,400sq ft house on a busy street sold in 2022 for $500,000. Today listings there are through the roof (nothing is selling). Prices have come down about 20% from their highs in that market. Perhaps a canary in the coal mine.
-
2 hours ago, no_free_lunch said:
Right now, it feels a little like early 2008. Back then they were raising rates, home prices were shaky but still stable, the stock market was doing ok, just a little dip here and there.
I am watching Canada to see what happens here. 5 year mortgages (or less) are the norm and by most metrics we have higher mortgage debt levels, so we should see sooner the impact of rising rates. Perhaps though, rates will push through to commodity prices and that will soften the blow but I think this Canada is a good bellweather.
The situation in Canada is frightening. The more i think about it, the more our situation is beginning to parallel the US in 2006 or 2007. The key is ‘higher for longer.’ If rates stay around current levels for the next year i think we will see the beginning of big problems in the housing market in Canada. The cracks are there already.Higher for longer, if it happens, means our mortgage market today is just like the wacky mortgage market the US had in 2005-2007. People don’t see it… the real estate market here is definitely giving off ‘Big Short’ vibes right now. Maybe i need to go to a local strip club and do some proper research. I was listening to a local real estate podcast (the Tom Storey show) and the guest realtor they had on said repeatedly “we all know real estate prices only go up.” She sounded like a nice lady… reminded me of ‘its just a gully.’
The issue was crazy low teaser rates… these allowed people to buy a house to live in they could not afford. But why let a good thing go to waste? Many Canadians became real estate ‘investors’ and started buying multiple real estate properties as well.
The big difference in the US and Canada is the crazy low low teaser rates in Canada have been available for a decade. This has allowed fortunes to be made on real estate in a very short period of time. I have been one of the winners (although i now rent - i cashed out my winning ticket in 2021). Canada’s entire economy became focussed on one asset class: real estate (as a % of GDP). And Canadians are obsessed with real estate. Low teaser rates for a decade have blown a real estate bubble of epic proportions.
In Canada when people buy a house it is usually done with a mortgage that has a variable interest rate (changes immediately when rates change) or a 5 year fixed interest rate. I think amortizations can be a max of 30 years.
For 40 years, a variable rate mortgage was a winning horse - for these borrowers interest costs kept falling every year. During covid variable rate mortgages dropped below 1%. More risk averse Canadians take out a 5 year fixed rate mortgage. These also fell over 40 years and bottomed at 1.39% during covid.
As interest rates fell for 40 years straight, well house prices have done the opposite and gone straight up for close to 20 years. Guess how much house you can ‘afford’ if you pay under 1.5% on your mortgage? House prices in Canada experienced their blow off top in Feb and March of 2022. The increase has been epic.
Today a 5 year fixed rate mortgage is about 6.2%. Variable rate mortgages are higher than this. ‘Higher for longer’ means any Canadians who have an oversized mortgage (there are more than a few) are screwed. So where is the carnage? Everything looks ok?
Most of the variable rate mortgages have a uniquely Canadian twist… they are called ‘adjustable’. If interest rates go higher the borrower can pay more in interest and less in principal - but the total mortgage payment does not change. To make the math work, the amortization period is extended. Lots of variable rate mortgages in Canada now have 40 or more year amortizations (yes, when 30 is the max) and some are as high as 70/years. Some of these mortgages are so far offside that the total mortgage payment is no longer covering all the interest costs - the mortgage balance is actually increasing for these loans.
Here is where the story gets interesting. All mortgages in Canada will reset every 5 years (variable and fixed rate). That means about every year 20% of all mortgages will be up for renewal. This is when everything gets ‘trued up’ - total payment and amortization. Of course, 6.2% is NOT generally workable if you have a large mortgage.
So ‘higher for longer’, if it lasts, is a death sentence for Canada’s housing bubble. But it will take another year or so to become more apparent.
Investors are starting to cry uncle. Since about 2015 most real estate purchases in Canada for ‘investing’ were already cash flow negative - even at the low ‘teaser’ mortgage rates. House prices were going up 6-8% per year. Being mildly cash flow negative was simply a cost of doing business.
At 6.2% today investors are getting taken out behind the woodshed - their monthly costs and losses have mushroomed in the thousands of dollars. The icing on the cake is, in Vancouver and some parts of Toronto, landlords can’t raise their rent much (Vancouver allowed a rent increase of 1.5% in 2022 and a 2% rent increase in 2023). And the price appreciation has stopped.
So investors are screwed. But they are a hardy lot. And, after all, interest rates WILL come back down. Canadian housing ONLY goes up. What is a rational investor to do? Buy and hold. Hang in there.
Well, losing thousands of dollars every month eventually works it magic. Like a splash of cold water on the face, ‘investors’ are starting to - well - run out of cash to burn. Not surprisingly, we are seeing higher rates hit the investor part of the market first. For sale inventory is starting to build - and about 50% of it appears to be from investors.
Where this gets interesting is where we go from here. If inventory continues to build and we start to see prices fall 10%. If you are an investor and you are deeply cash flow negative AND real estate prices start to correct lower… you are worse than screwed. Now you risk getting wiped out financially. Leverage is a bitch when it goes against you.
Within the investor segment, the condo pre-sale market could get very ugly in the coming year. Lots of ‘investors’ put down a deposit years ago on a unit that they intended to flip at a much higher price once it was completed. This strategy was a license to print money for years. These ‘investors’ can’t now sell the unit when it comes to market as the selling price is going to be below their agreed to purchase price so they will lose their deposit (or more). And they can’t buy the unit either - they do not quality for a mortgage at 6.2%. Lots of people own multiple units like this. A legal shitstorm in the making.
For borrowers who live in their residence this whole thing gets complicated. Canadians are very resilient at finding solutions - so i am not sure how it plays out here. Other than mortgage payments are going through the roof for those carrying large mortgages. But it will take a few more years to fully play out.
The big banks will work with mortgage holders. They will extend amortizations to take the sting away a little. The Liberal government will also likely try and do something.
So perhaps we muddle through. ‘Higher for longer’ will be the key of how this plays out. But the storm clouds are forming. And it looks like it might actually pick up enough speed to become a hurricane…
-
 1
1
-
-
Great discussion. Some thoughts:
- where are the body bags hiding from the spike at the long end of the curve? Wo are the big losers here? What should be avoided?
- how high could the yield on the 10 year go? 5% or higher?
- does the US 10 year treasury set the value of all other investments?
- if so, what is the move higher in the 10 year treasury tell is about other asset classes?- i am a total return investor. I don’t really care where it comes from.
For me, the most interesting development in 2023 is the resilience to higher interest rates in the US. Its like higher rates don’t matter. Businesses (issued debt and locked in low rates for a few years) and consumers (locked in low rates on 30 year mortgages) in the US both made smart decisions during covid so higher rates are not affecting many. And governments aren’t interest rate sensitive (with spending). At least thats the case today.
What happens in the US matters in the rest of the world. Other part of the world are much more sensitive to higher rates (like Canada).
I know we are supposed to ignore macro. If interest rates at the long end of the curve continue their march higher I think we will get some wonderful opportunities to ‘buy low.’ Because, contrary to what we have learned in 2023, interest rates really do matter. A lot.
Where will the opportunities come from? No idea right now. And that is one of the things i love about investing.
The value (optionality) of having a little cash on hand is going up. And you are getting paid 5% while you wait. Cash as an investment is looking very good to me today (for a part of ones portfolio).
-
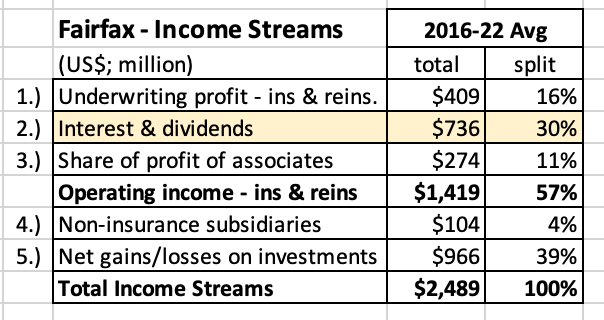
2023 Interest and Dividend Income - Earnings Update
The key to forecasting is getting the ‘big rocks’ right. From an earnings perspective, there is no more important item to Fairfax today than interest and dividend income. From 2016-2022, this one ‘bucket’ represented a total of about 30% of Fairfax’s various income streams. With ‘higher for longer’ increasingly becoming the new reality for interest rates, interest and dividend income will likely increase in the near term to represent close to 40% of Fairfax’s various income streams.
If we can get can get our estimates for this part of earnings modelled properly we should be well on our way to coming up with a quality earnings estimate for the company as a whole.
Interest and dividend income is quite simple. It is relatively easy to calculate. It is usually not very volatile quarter to quarter. And it is pretty predictable, looking out a couple of years. This is why interest and dividend income is considered the highest quality source of earnings for an insurance company.
Bottom line, interest and dividend income is important to Fairfax (and investors) because of its size, growth and its quality.
Interest and dividend income - components
Fairfax reports ‘interest and dividend income’ as a line item on its Consolidated Statement of Income. It is made up of three parts:
- Interest income: received from the fixed income portfolio (cash, short term investments, bonds, derivatives and other invested assets)
- Dividends: received from equity portfolio (common and preferred stocks)
- Investment expenses: paid to Hamblin Watsa
When looking at ‘interest and dividends’ for Fairfax, dividends now represent less than 10% of the total. Interest income represents more than 90% of the total, so this is what we are going to focus on.
Before we do the deep dive on interest income at Fairfax, let’s step back a look at the big picture.
—————
What did we learn in financial markets this week?
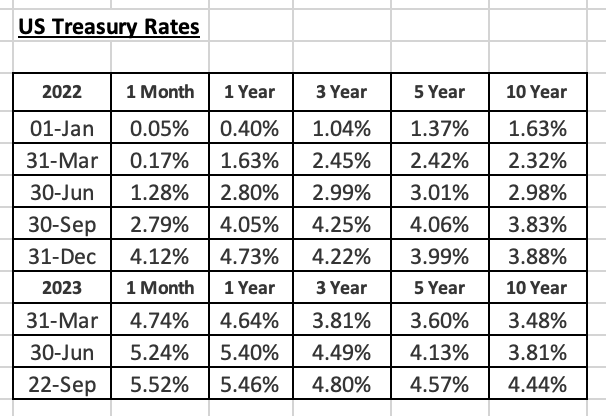
Like a splash of cold water to the face, financial markets are waking up to the likelihood that interest rates are not coming down any time soon. At the longer end of the curve, despite the big move that has happened over the past month, bond yields look like they could be headed even higher.
What is ‘higher for longer?’
Higher for longer is the realization from financial markets that the Fed will likely need to keep interest rates elevated well into 2024. The Fed met this week and they delivered this message loud and clear. US economic growth continues to surprise to the upside. Employment is strong. Oil is back over $90. Although it has come down, inflation remains stubbornly high.
Further out on the curve, bond yields have reached new cycle (16 year) highs. Financial markets are likely saying they don’t think higher interest rates are going to cause a recession - the economy can handle higher interest rates. The current supply / demand situation also suggests rates further out on the curve might go even higher: issuance (supply) of longer dated treasuries has increased while demand remains muted and this has pushed prices lower (and yields higher). This supply/demand dynamic is expected to persist in 2H 2023.
What were financial markets thinking at the end of 2022?
At the end of 2022, financial markets were expecting a recession in 2023. And it was expected the Fed would be cutting the Fed funds rate by 100 basis points in 2H 2023.
Financial markets were completely wrong in December 2022. Today, they are now expecting Fed fund rate to peak near 5.5% in January 2024. And from there to slowly drift a little lower but to still be over 5% in July of 2024.
Yes, financial markets could be wrong again. Bottom line, ‘higher for longer’ appears to be what has been getting priced into financial markets in recent weeks.
Source: https://x.com/asif_h_abdullah?s=21
What does all this mean for Fairfax?
‘Higher for longer’ is a big deal for Fairfax. They have a $40 billion fixed income portfolio. As we discussed, interest and dividend income is already the largest driver of earnings for Fairfax. So an already big number is going to get even bigger.
The fixed income portfolio of Fairfax has a very short average duration of 2.4 years at June 30, 2023. This means a significant amount of their portfolio continues to mature each quarter. Compared to all other P&C insurers (not named WR Berkley - who is also at 2.4 years), Fairfax is able to reinvest a significant portion of their fixed income portfolio at still increasing interest rates. This means the quarterly run rate for interest income will likely continue to move meaningfully higher in the coming quarters.
As a result of ‘higher for longer,’ estimates for interest and dividend income for Fairfax will need to be updated - yes, it is going higher. And given the importance of interest and dividends, this means earnings estimates will also need to go higher. Analysts are going to feel like they are living their own version of the movie Groundhog Day. However, we will not wait until Fairfax reports Q3 results to ‘discover’ what we already largely know - we are going to update our forecast for interest and dividend income in remainder of this post.
—————-
Interest Income - a deep dive
Two items drive interest income:
- The size of the fixed income portfolio
- The average yield earned on the investments held in the portfolio
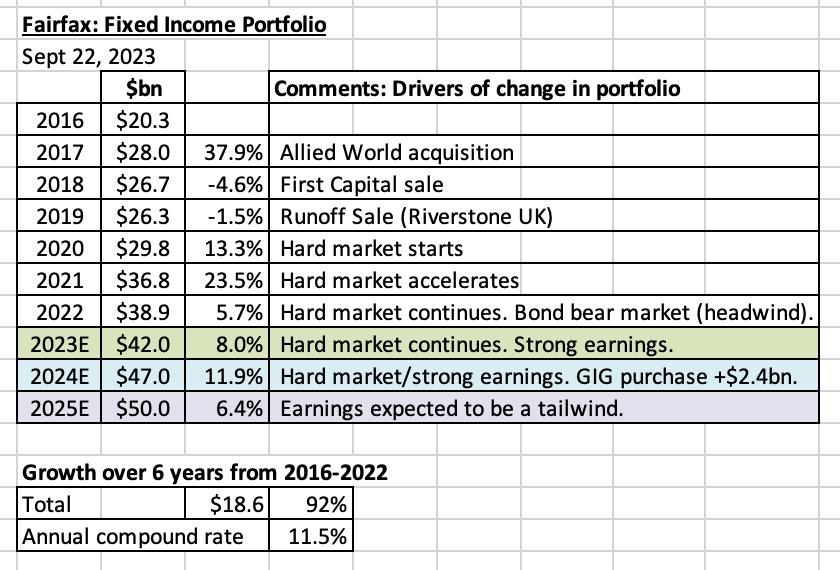
How big is the fixed income portfolio at Fairfax?
The fixed income portfolio at Fairfax increased in size from $20.3 billion in 2016 to $38.9 billion in 2022. The total increase was 92% and the annual compound growth rate was 11.5%.
My forecast is for the size of the fixed income portfolio to:
- increase 8% in 2023 to $42 billion. This will be driven by growth in premiums from the continuing hard market. It will also be driven by earnings, some of which will likely be reinvested in fixed income securities. The continuing bear market in longer dated bonds is a small headwind (as the value of these securities fall).
- increase 12% in 2024 to $47 billion. Similar to 2023, this will be driven by the hard market and growth in earnings. The closing of the GIG acquisition will add $2.4 billion to fixed income portfolio. This may happen in Q4 of 2023.
- increase 6.4% in 2025 to $50 billion. This is a very rough number. Strong earnings are expected to be a tailwind. We will fine tune this estimate when we get into 2024 as we get more information.
Bottom line, we are seeing strong growth in the size of the fixed income portfolio at Fairfax and this should continue moving forward.
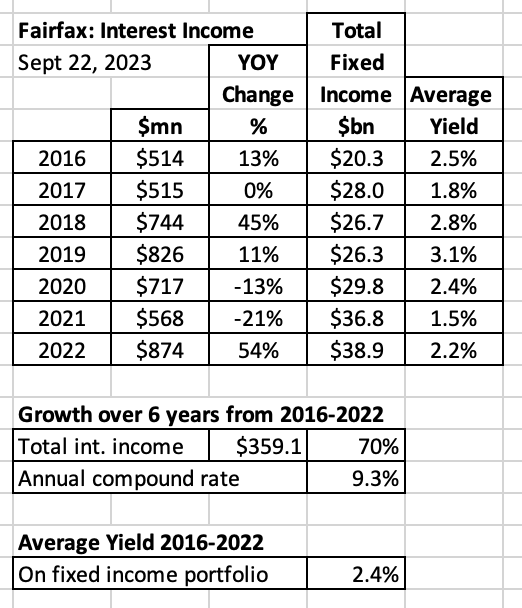
How much did Fairfax earn on its fixed income portfolio? A look back.Total interest income at Fairfax increased from $514 million in 2016 to $874 million in 2022. The total increase was 70% and the annual compound growth rate was 9.3%.
The average yield on the fixed income portfolio from 2016-2022 was 2.4%. Yes, that is a low number. From 2016, Fairfax has been positioned very conservatively with their fixed income portfolio (high quality and low duration).
Green shoots: in 2022, interest income was $874 million, an increase of 54% over 2021. This was a new record for Fairfax.
Active management matters again - duration and credit quality
One of their best investment decisions ever: in Q4, 2021 Fairfax shortened the average duration of their fixed income portfolio to 1.2 years. They also shifted to holding mostly government bonds. Of note, in Q4 of 2021, Fairfax sold $5.2 billion in corporate bonds at a yield of 1% and realized a $253 million gain (these bonds were purchased in March/April of 2020 when credit spreads blew out due to covid).
And in 2022, the fed moved to aggressively moved to increase interest rates which unleashed hell on bond (and stock) markets. Of course, with their fixed income portfolio sitting at 1.2 years average duration, Fairfax avoided billions in losses on their fixed income portfolio. This positioning also allowed Fairfax to quickly benefit from much higher interest rates. Interest income bottomed out in Q4 2021 and has been relentlessly moving higher every quarter since then (more on this below).
In 2022 Fairfax began extending duration to 1.6 years. And in 1H 2023 average duration has been increased further to 2.4 years. This is locking in higher rates for years into the future.
‘Higher for longer,’ with yields on longer dated treasuries hitting 16 year highs this month, Fairfax has a wonderful opportunity to extend duration even more. This will be something to watch for when Fairfax reports Q3 results.
Quality management: lead by Brian Bradstreet, the fixed income team at Fairfax/Hamblin Watsa has been executing exceptionally well in recent years. This is not surprising - their track record over the long term has been outstanding. Another misunderstood and under appreciated part of Fairfax.
The move in US treasuries over the past 7 quarters has been epic - and that is not hyperbole.
Fun thought exerciseCan we estimate how much of Fairfax’s $40 billion fixed income portfolio is ‘maturing’ each quarter and what the pickup in yield is when the proceeds are reinvested at todays much higher rates? Let’s assume $2.5 billion is maturing each quarter and the yield pickup is 2%. If close to accurate, this suggest interest income should continue to grow at $50 million each quarter over the prior quarters number. And this should continue for the next couple of quarters.
What to board members think? Too high?
Forecast for fixed income for 2023, 2024 and 2025
Given the importance of interest income to the Fairfax story we are going to get into the weeds a little bit more.
Because so much has changed so fast over the past 24 months, historical numbers are pretty much useless to use on their own to estimate interest income. This is why most analysts have been so wrong with their earnings estimates for Fairfax over the past year. They are primarily using historical numbers to estimate interest income. In another couple of quarters, once interest income ‘normalizes’ then the analysts earnings estimates will better reflect reality.
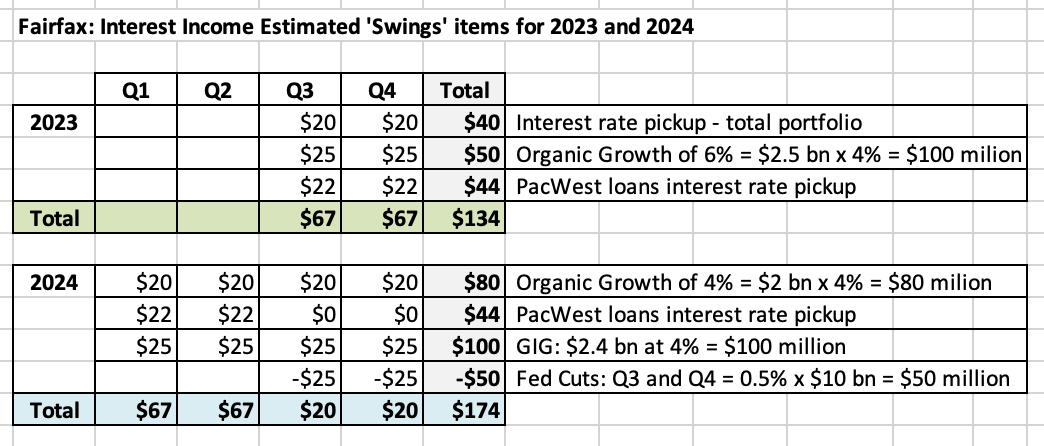
To build an accurate forecast for interest income we do need to start with historical numbers, as they provide a valuable baseline. But we need to use quarterly numbers. And then we need to overlay the new news (I call these ’swings’):
- interest rate pickup - for bonds maturing each quarter which are then reinvested at much higher rates. Let’s assume $20 million per quarter. Likely way low. Is $50 million more accurate as per my numbers above? To be conservative let’s assume there is no interest rate pickup in 2024; my guess is there will be some in Q1.
- organic growth - this is growing the size of fixed income portfolio. Let’s assume an increase in the size of the fixed income portfolio of $2.5 billion x 4% = $100 million per year = $25 million per quarter.
- new business - interest rate pickup: PacWest loans are expected to deliver a 10% total return. Some of this gain will be price. It seems reasonable to assume the yield pickup will be about 4% or 5% = $90 million per year = $22 million per quarter, starting in Q3, 2023.
- new business - increase in fixed income portfolio: when it closes the GIG acquisition will add another $2.4 billion to the fixed income portfolio. Let’s assume an interest rate of 4% = $100 million per year = $25 million per quarter. Let’s start this in Q1 2024. If the deal closes in Q4, as expected, we can move this forward a quarter when we do out next update.
- Fed rate cuts - let’s build in 2 rate cuts from the Fed in 2H 2024. Let’s assume this cut impacts $10 billion by 0.5% = $50 million annual decline = $12.5 million per quarter. To be conservative lets go with a decline of $25 million per quarter.
The key here is to try and understand what the largest drivers of change are and to do a very rough estimate of the impact.
Bottom line, doing our estimate by quarter should add a lot of accuracy to our quarterly and annual estimates.
Step 1: Understand interest income swings by quarter
Below I have tried to capture the big ‘swings’ that will impact interest income moving forward. By breaking down the impact by quarter we now have a rough number we can add to our baseline numbers.
Please note, it is important to get these estimates approximately right. Some will be high. Other will be low. Collectively, they will should be close.
Step 2: Build our annual forecast by quarterTogether with our baseline (historical) numbers, we used the ’swings’ above to help us come up with our new forecasts for the remainder of 2023 and for 2024 and 2025. Note, i did take my ‘swings’ numbers above down a little for each quarter - to add some conservatism.
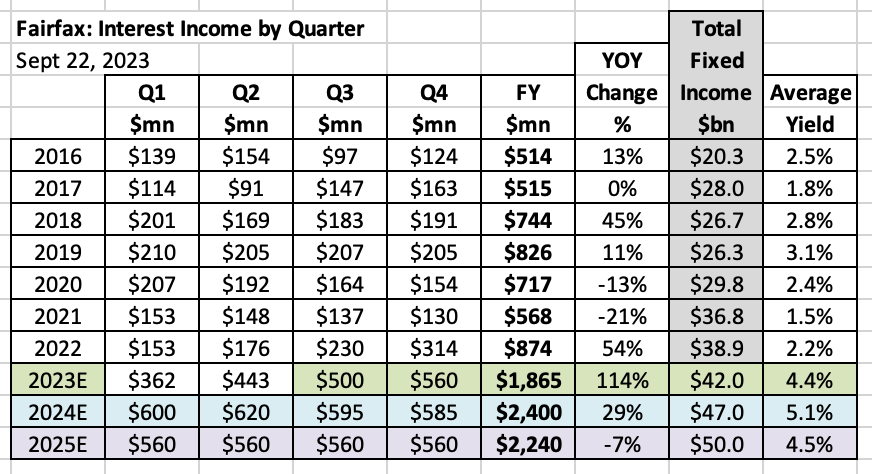
My new forecast for interest income for Fairfax is:
- $1.865 billion in 2023, a YOY increase of 114%
- $2.4 billion in 2024, a YOY increase of 29%
- $2.24 billion in 2025, or a YOY decline of 7%
This results is a portfolio yield of:
- 4.4% in 2023
- 5.1% in 2024
- 4.5% in 2025
The total number of $2.4 billion for 2024 looks high (just because it IS a huge number). But the portfolio yield of 5.1% looks reasonable (remember the Kennedy Wilson portfolio is about $4 billion and it is yielding around 8%). But these numbers are where my logic and math takes me so that is what I will go with for now. As new information comes in (or I discover errors in data to logic) I will update my forecasts.
Important: this is my first stab as this kind of detail. So there will be errors. Please let me know where my logic is wrong so I can make the estimate better over time. Discussing/debating the assumptions/logic with others on the board is when the learning really happens. Thank you in advance

Interest and Dividend Income
Coming full circle, let’s now overlay our new estimate for interest income into our estimate for interest and dividend income.
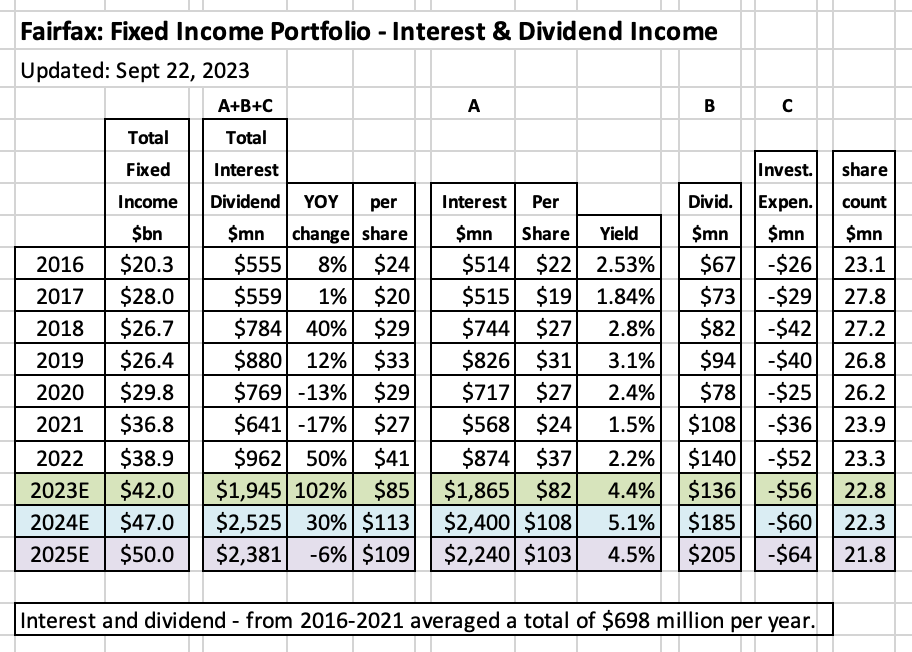
My new forecast for interest and dividend income for Fairfax is:
- $1.945 billion in 2023, a YOY increase of 102%
- $2.525 billion in 2024, a YOY increase of 30%
- $2.381 billion in 2025, or a YOY decline of 6%
Conclusion
Interest and dividend income is the most important income stream for Fairfax. It is poised to increase more than 100% in 2023 and another 30% in 2024.
The driver of this increase is the fixed income portfolio.
- double in size: the total fixed income portfolio more than doubled in size the past 8 years from $20.3 billion in 2016 to an estimated $42 billion in 2023.
- double in yield: The yield on the fixed income portfolio averaged 2.4% from 2016-2022. It is estimated to come in at 4.4% in 2023 and 5.1% in 2024.
A double in size combined with a double in yield is nuts. Investors are getting served up a double-double with Fairfax’s fixed income portfolio (that line will only make sense to Tim’s coffee drinkers).
The story gets better.
Fairfax is positioned perfectly to benefit from ‘higher for longer.’ Fairfax has an opportunity today to lengthen duration. This would then lock high interest income into 2025 and 2026.
What about corporates? Fairfax has the majority of its fixed income portfolio invested in safe but lower yielding government bonds today. What if they start to move out on the curve AND at the same time shift more into corporates. That would likely result in a yield pickup of around 1.5% or 2% over governments bonds. So for all of you out there who are thinking that interest and dividend income will peak out at $2.5 billion in 2024… maybe not.
—————
Dividends
Dividends have increased from $80 million in 2014 to $140 million in 2022, a compound increase of 7.2% per year over 8 years.
Dividends should continue to increase in the future. Eurobank would like to start paying a dividend in 2024. They have discussed 25% as a reasonable payout ratio. If this happens, Fairfax could see dividends increase by up to $75 million just from Eurobank. That would be a 50% increase to dividends. Regardless, we should see this continue to increase in the future as Fairfax grows its equity holdings and as existing holdings increase their payouts.
—————
Where do i go to learn about where interest rates might be going?
I follow a guy named Joseph Wang - The Fed Guy. I have been following Joseph for more than a year and he has been remarkably accurate with his projections for interest rates. Just as importantly, Joseph is a great educator. He lays out his thinking on interest rates (and the Fed meeting last week) in his most recent podcast on September 23.
-
4 hours ago, newtovalue said:
So we're past peak hurricane season and so far no major storms.
Fingers crossed but looks like this season may be milder than in the past. This will be a huge windfall for all the insurance companies that wrote CAT insurance in Florida. I remember BRK had done it - but not sure if FFH - any insight from the board?
Strictly from a financial perspective, we all should be praying for a couple of bad hurricanes. Small hit to short term results. But it would likely extend the hard market another year of two - resulting in higher for longer profits (price increases and better terms and conditions).
I think much of what people are discounting into their models when valuing Fairfax is too pessimistic and one sided. Because each risk has a corresponding opportunity. Discounting the risk and not adding back some of the opportunity is not being conservative. That makes no sense to me.
-
4 hours ago, Haryana said:
My apologies as I may have misunderstood when you said you were 100% Fairfax on 7/11. I guess you meant that your stock position was 100% Fairfax but you still had cash.
@Haryana yes, my July 11 comments was discussing my holdings of Fairfax and Fairfax India. At the time i was 100% Fairfax and 0% Fairfax India. And yes, at the time, i had other investments. Sorry for the confusion. -
@Haryana to be clear, i did not move from zero to 30% cash. I always have a cash balance that i flex up and down depending on the opportunity set. My ‘way overweight’ position in Fairfax has not changed the past couple of months - I continue to think the stock is still wicked cheap (despite hitting all times highs).
—————
Posted on Tuesday: “Cash. It has been a great year. Time to get more defensive. Lock in gains. Back up to 30% cash. Get paid close to 5% risk free to sit in the weeds and wait and see what Mr Market pukes up next. The move higher in bond yields is what i am watching right now. How high can they go?”
“i am not turning bearish. Or bullish.”
-
When it comes to pay, you get what you are able to negotiate. If you have leverage, you earn more. If you have no leverage you earn less. From my perspective, there is no ‘right’ or ‘wrong’ amount. In a tighter labour market, like today, it makes sense labour has a little more leverage (in general) and therefore will attempt to extract more. No idea how it all plays out.
-
Balanced summary of how messed up Canadian / Indian relationship is.
-
This graph illustrates beautifully the difference in the impact of rising interest rates on home owners with a mortgage in Canada and the US. Canadian mortgage holders are being impacted much more quickly than those in the US. And that makes perfect sense given borrowers here have interest rates that are variable or fixed for only 1 year, 2 year, 3year, 4 year or 5 year (mortgages can be amortized for up to 30 years).
Current mortgage rates in Canada are now about 6.2% for a 5 year and higher (for shorter terms). So every year about 20% of borrowers in Canada are now resetting to 6.2% or higher from their old rate which is probably around 3% = double the interest cost.
Hard to see how this does not have an impact on consumer spending / the broader economy over time. The key is how long interest rates stay elevated. On that front, inflation surprised everyone and ticked higher again a couple of days ago.
Source: https://x.com/asif_h_abdullah?s=21
-
11 hours ago, Sweet said:
It’s not September 2020 anymore. I was 90% O&G at the time. I think energy stays a comparatively low multiple investment for many years. For you to make out from here, I think companies have to buy a hell of a lot of shares back, or pay fat dividends and many aren’t. Which comes to the major problem with these sector, in my view management generally is poor and not particularly shareholder friendly. It’s obvious what many of them should be doing yet they don’t do it.
@Sweet i am not sure the names you are speaking of. Note, i am after 15-20% per year returns over the next year in the sector (not 100% in 12-24 month type returns).
I follow Suncor closely. With their windfall profits from energy the past 2 years they have been:
1.) paying down debt aggressively.
2.) buying back stock aggressively (i think 6 or 7% of shares outstanding per year) at very low prices.3.) paying a good dividend (4.4% yield today).
In another 6 months or so they will likely hit their net debt target. At that point, most of the free cash flow will go to share buybacks and probably a higher dividend
The company recently announced a 10% reduction in total workforce that will save it about $400 million per year. The new CEO is laser focussed on making Suncor a simpler, more focussed company. He also looks to be VERY shareholder friendly.
Bottom line, i think there are some pretty compelling opportunities in the energy sector (still). Not as cheap as 2020. But the comlanies are in much better shape (their balance sheets). And the outlook for energy is also much better - oil is at $90 and my guess is it goes higher from here.
OPEC (Saudi’s) appear back in control of the oil market. The US has played its SPR card. I’m not a conspiracy guy… but the Saudi’s and Biden/Democtrats clearly hate each other. What will higher oil prices do you Biden’s chances of reelection in 2024? I think the Saudi’s are VERY motivated to keep prices high for the next year. Russia probably as well - want to get the upper hand in the Ukraine war? Get Trump elected. Geopolitics sometimes matters.
-
You can’t make this stuff up. We haven’t even reached peak coal usage yet. Peak oil or gas?
Global Coal Use Set to Stay at Record Levels This Year, IEA Says
“Lower natural gas prices in the US are also encouraging a move away from coal, the IEA’s report said.”
-
On 1/9/2020 at 5:34 AM, james22 said:
You've recently been writing some very bullish thoughts on the oil and energy sector. What's your case there?
When people get excited about this ongoing cyclical trade, they should look at oil as the ultimate distressed value asset out there. To me, oil stocks are incredibly cheap.
There are technical reasons for that, because of the large passive investment flows, and oil is a smaller and smaller part of the index. Also, there are more and more institutional investors who can’t buy oil stocks anymore because of ESG limitations.
On the other side, there is no sign that oil demand is weakening. Consumption in emerging markets continues to grow, while conventional oil investments have been reduced significantly, precisely because of all this talk that the fossil fuel era is ending.
So in your view, energy the one remaining cheap sector out there?
Yes, without a doubt. But I will freely admit that there are all sorts of technical issues because as I said many investors can’t buy oil stocks anymore. We have this bizarre situation where people can’t buy oil stocks, but people continue to consume oil.
https://themarket.ch/interview/oil-stocks-are-incredibly-cheap-ld.1384
Anyone else see an opportunity?
I'm thinking of making Energy (VGELX) a 5% position.
This post was the first made on this thread back in 2020. @james22 freaking brilliant call. Just as relevant today?Eric Nutall is not my favourite oil analyst… but i do like his chart (i prefer Arjun Murti and Josh Young).


Energy Sector
in General Discussion
Posted
Dinar, i have no idea how it will play out. You can’t model the unknowable. It just looks pretty obvious/clear to me that the risks are at a level we have not seen in a long, long time. Maybe it is a nothing-burger.
Key risk? I think the price of oil matters. If anything happens that causes oil to spike over $100 a barrel or higher… i think financial markets would start to pay a little more attention. If oil went even higher (over $110) … well, i think financial markets would then be paying a lot of attention. Again, this is not a prediction or a forecast. Just something a risk manager might want to think about. Of course, the price of oil is only one of many risks…