Viking
-
Posts
6,052 -
Joined
-
Last visited
-
Days Won
78
Content Type
Profiles
Forums
Events
Everything posted by Viking
-
Outstanding year. Best in company's history. Reported diluted EPS was a strong $214 per share. The number that matters much more - economic EPS - was $269 per share ($214 + $55, from change in excess of FV over CV). BVPS is now $1,260. Q1 is shaping up to be a strong start to 2026: $350 million gain from pending sale of Eurolife's life insurance business in Greece Equities are up ~$1.3B (as of Feb 18) 'Normal' (solid) quarter for insurance

-
@mananainvesting, great point. I know I do not fully understand the effect that compounding is having on Fairfax’s intrinsic value. This is going to be an increasingly important driver of future results (like it was for BRK back in the 1980’s and 1990’s). This is a topic I need to spend some time on.
-
@73 Reds, I am thinking more these days about your comment. What you are asking is: "Was it primarily skill or luck?" that has driven the outstanding results of the past 5 years. If it was skill, it is likely repeatable. If it was luck, it is not repeatable. I am firmly in the "it was primarily skill" camp. And that is for a couple of reasons: They have made an enormous number of good decisions. And a bunch (not a few) have been needle movers. They have made very few poor decisions. And no big bad decisons. The good decisions have been made across all parts of the business: insurance, investment management, capital allocation, strategic I agree the current macro environment is a perfect fit for their style of management/investing. But I don't expect the current macro environment to change - it should remain a tailwind. The challenge with understanding Fairfax today is it has been transformed so much over the past 5 years (structurally and in sources of earnings) we have never seen this version of the company before. This does make it more difficult to look into the future and value the company - but in a really good way. The question is not "Will it be good?" but rather "How good is it going to be?" The really interesting thing to me is the stock is on sale today. It is trading at 1.35x P/BV, and we know BV is materially understated. Mr. Market is pricing Fairfax like it is being run by dummies. Their view is management will make bad decisions/destroy capital moving forward. I love this set-up. I expect the current macro environment to continue to be a tailwind. Based on what I have seen the past 5 years, I think management is very good. I think they will continue to make good decisions moving forward - and continue to compound per share value at above average rates. At the current stock price, I get all the upside for free. It's like getting a call option on Fairfax's management team for free - and it pays out if they turn out not to be dummies. And it pays out spectacularly well if they continue to do what they have been doing for the past 5 years.
-
Annie Duke is one smart cookie…
-
Another way to look at it is through the per share lens = interest income per share. Interest income = rate x size of portfolio At 5% yield, the size of the bond portfolio is increasing ~5%. Lets assume shares outstanding decline by 3%. These two items provide an 8% per share tailwind to interest income. This is before any impact from interest rates. Minority interest are important. Fairfax does not get to keep all the interest income it earns. Buying out Allied World minority shareholders in 2026 would increase interest income per share further - the amount that accrues to Fairfax shareholders. Interest rates are going to go up and down from year to year. What matters is what they do over 5 or 10 years. My guess is Fairfax will be able to earn a solid return on their fixed income portfolio moving forward - I don’t think we are going back to a zero interest rate regime.
-
@Txvestor, great question. The hidden value piece has a lot of layers to it. Here is how I think about it. Let’s assume hidden value is about $4.5B today. Let’s pretend it will get equally realized into earnings over the next 5 years. That would contribute $900 million per year to investment gains (in the form of realized gains). And after 5 years it would be zero. But hidden value isn’t static. It’s like a funnel - a bunch of new HV is getting poured into the top of the funnel each year. So even if you drain $900 million out of the spout at the bottom, it might keep growing in size. For the past 5 years, the amount of HV being poured into the top of the funnel has far exceeded the amount that has been draining out of the bottom of the spout (Fairfax monetizes some HV each year). Hidden value has been increasing at more than $1 billion per year in recent years. And given the improving quality, number and size of associate and consolidated holdings my guess is most years HV is likely to continue to grow in size (what is going in the top will be greater than what is draining out of the bottom). We will have some years when we get a massive investment gain - like when they start to sell down Eurobank, BIAL, Poseidon etc (like in 2022 when pet insurance was sold). This year is a good example. My estimate is Fairfax is going to report about $200 in EPS. At the same time, excess of FV over CV is going to increase by about $1.1B, or $40 per share. This estimate of increase in HV is very conservative (it only captures one source of HV). Bottom line, hidden value is not a static thing (that would be a one time thing). It’s a flow (a recurring thing).
-
The hidden value piece is really interesting piece. It’s not really hidden - it just doesn’t show in accounting results - so we call it “hidden”. Even though a bunch of it can be precisely calculated. And a bunch more can be roughly calculated. And more that Fairfax will announce that will surprise us (like when they sold Eurolife). It is like a 6th income stream that will flow through to future earnings (via investment gains) - we just don’t know the timing. This should add a couple of points to future ROE (on average). Of course, it will be lumpy. As hidden value keeps blowing out (getting larger) it has the effect of increasing future ROE. The more hidden value continues grows the higher future ROE will be. ————— Fairfax’s investment portfolio is performing very well - Fairfax has amassed/curated a wonderful collection of holdings. More and more are falling in to the associate and consolidated buckets (I include the private equity holdings here like BDT, ShawKwei and Waterous III). This suggests the amount of hidden value will be increasing in future years.
-
I think one of the key variables for how Fairfax's invests is volatility. When volatility is high then tend to swing hard - that is usually when they make their big needle mover investments. Think FFH-TRS in late 2020/early 2021. Or taking the average duration of the fixed income portfolio to 1.2 years in late 2021 (and selling all their corporates - yielding 1% at the time). The problem is we have had limited volatility since 2022 (I am talking about an extended downturn, not a 1 month blip). They did a nice job: Capitalizing on the run on small banks in the US (i.e. PacWest) and that has developed into a great investment for them (and KW). Selling pet insurance, Resolute forest Products and Stelco at peak (bubble high) pricing When volatility is muted, Fairfax will do a lot of 'block' and 'tackle' type investments - solid return type things. While biding their time. Some share buybacks. Continue to buy out minority partners. Continue to build positions in stuff they already own (and really like). The key is to stay patient. And not do something stupid. My guess is volatility will come back at some point. And Fairfax will get out their elephant gun. Until then, my guess is they will continue to do a bunch of smart things that deliver a solid return.
-
Getting an Edge with Fairfax - Part 2 How to Get an Edge with Fairfax Over time, five practical approaches can help investors develop an edge. 1. Corner of Berkshire and Fairfax (COBF) https://thecobf.com The Corner of Berkshire and Fairfax forum, founded in 2002 by Sanjeev Parsad, has been an exceptional resource for discussion, analysis, and debate for more than two decades. It remains the single best external source of information on Fairfax. 2. Understand Hidden Value A large portion of Fairfax’s value creation is not captured in reported accounting results. As a result, it does not show up in most analyst models. Fairfax does provide disclosure that helps quantify some of this value — but it is often overlooked and ignored. Hidden value builds primarily through associate and consolidated equity holdings. Two Examples: Example 1: Excess of fair value over carrying value (Non-insurance associate and consolidated holdings; disclosed by Fairfax) 2025E: $2.6B, or $114 per diluted share (pre-tax) Increase of $1B, $44 per diluted share in 2025 Example 2: Fairfax India Both the fair value and carrying value appear materially understated Book value is much higher Intrinsic value is likely significantly higher than reported book value Net result: the asset appears significantly undervalued on Fairfax’s balance sheet and even its own estimate of fair value. There are many more examples – Poseidon, Ki, and others. This is value that has already been created. It is large. And it is growing. Over time, it should become an important source of future earnings – effectively a sixth income stream. The timing is uncertain. But the direction is clear. 3. Understand the Equity Portfolio – Build an Equity Tracker Historically, one of most effective ways to understand (and invest in) Fairfax has been to follow the investment portfolio. At times, there has been a lag between good news in the portfolio and its reflection in the share price. The most famous example was the CDS/equity hedge investment from 2006 to 2009. Like the movie Groundhog Day, this pattern continues to repeat. Roughly one-third of Fairfax’s total investment portfolio is in equities. Performance here materially affects both short- and long-term results. What to do? Build a model. An equity tracker spreadsheet can: Capture each equity holding: share count, price and total value Group holdings by accounting treatment: mark-to-market, associate and consolidated Track performance in real time during the quarter Informational sources: Fairfax disclosures and COBF. Example – Q4 2020 Fairfax owned many cyclical companies. When COVID hit, these holdings fell sharply and remained depressed through much of 2020. Then news of a vaccine broke in November. Cyclicals surged. Fairfax’s equity portfolio rose sharply (by roughly $1 billion). But the stock remained depressed. The equity tracker revealed that the company was actually much cheaper than it appeared — making it easier to take a concentrated position. The tool provides a real-time, granular understanding of what is happening with one-third of the investment portfolio — insights few others have. 4. Understand Earnings and Forecasting – Build an Earnings Model Over the past 5 years, Fairfax has evolved significantly. This has materially impacted its five income streams. The shift to IFRS accounting added more complexity. What to do? Build a model to understand what is happening “under the hood.” An earnings model can: Resemble Fairfax’s pre-IFRS income statement Track the company’s five core income streams Develop individual models for each income stream Enables bottom-up forecasting for the next two years Beginning in 2021, the story at Fairfax improved broadly — across insurance, investments, and capital allocation. There is often a lag between improving fundamentals and when they show up in reported results. The model helps bridge that gap. Key developments: Underwriting Profit (2020 to 2025): hard market + improved underwriting Interest and dividend income (2023 to 2025): spike from higher rates + higher balances Share of profit of associates (2021): spike to $1 billion Non-insurance consolidated companies (2025): breakout year NICC is a good example. Fairfax has been building this group of holdings for years (Recipe, Sleep Country, Meadow Foods, Peak Achievement). Reported earnings were flat for a long time. In 2025, they surged. This income stream now looks positioned to grow meaningfully — like a coiled spring being released. The earnings model connects past decisions to future results. It provides a structured, forward-looking view of fundamentals. It’s like having a crystal ball – it provides the ability to see Fairfax’s future results – insights few others have. 5. Understand Capital Allocation – Build a “Swings Tracker” Capital allocation is central to Fairfax’s long-term value creation. To evaluate management, it helps to track what they actually do with capital. A capital allocation tracker can record each meaningful decision: Date Activity: buy (new/add) or sell (all/partial) Description Amount: use or source of capital Separated by business: insurance and non-insurance The data set goes back to 2010 – 15 years of detail. It helps answer two key questions: How good is Fairfax at capital allocation? Is performance driven by skill or luck? Back in 2021, Fairfax was widely viewed as below average. Over time, the tracker told a different story. The conclusion evolved: Below average → above average → best-in-class. And the pattern increasingly looks like skill — meaning repeatable. Writing as an Edge: The Fairfax Book/PDF Writing is another powerful way to develop and sharpen an edge. Informational edge: Writing forces ideas, data, and assumptions into a clear structure. Information becomes understanding. Analytical edge: Putting thoughts on paper sharpens analysis, exposes gaps in reasoning, and helps distinguish signal from noise. It also creates a permanent record of what you believed and why. Behavioral edge: Writing helps reduce biases and supports disciplined decision-making. Continuous improvement: Successful investing is a journey, not a sprint. Many articles have been edited two or more times. Each revision (usually) improves the thinking. In August 2023, a collection of posts was published: 14 chapters, 192 pages. Today, the working document has grown to 21 chapters and more than 850 pages, with updates roughly every two months. The Fairfax book/PDF and companion Excel workbook (with all models) are available for free at COBF: https://thecobf.com/forum/topic/20253-fairfax-vol-2-100-of-the-best-posts-all-in-one-document/#findComment-526661 Summary Developing an edge with Fairfax has been a five-year journey built on: Curiosity Open-mindedness Continuous improvement The edge comes from combining multiple sources of insight: External resource: Corner of Berkshire and Fairfax (COBF) Company disclosures: Excess of fair value over carrying value Associate and consolidated holdings Custom models: Equity tracker Earnings model Swings tracker (capital allocation) Individually, each provides useful information. The real magic is how all the pieces work with each other. Together, they form a more complete picture — supporting better analysis, better decisions, and, over time, better results. They also help avoid psychological landmines — of which there are many with Fairfax. These tools improve forward-looking understanding, clarify what drives long-term value, and increase the probability of better investment outcomes. In short, they provide a meaningful edge. And what has been the result over the past 5 years? Magic for shareholders. Fairfax’s stock has had a spectacular run. Surprisingly, the stock still appears cheap. It may just be getting started.
-
Getting an Edge with Fairfax - Part 1 Introduction: Why an Edge Matters “An investor needs an edge to outperform the market over time.” — Seth Klarman “Active management requires a reason to believe you have an advantage.” — David Swensen Successful investing begins with a simple premise: You need an edge. Investment edges typically fall into three broad categories: Informational edge – access to better or more complete information. Analytical edge – the ability to interpret available information more effectively. Behavioral edge – the discipline to act rationally when others do not. Having one is good. Having two is better. Having all three is powerful. Fairfax offers the rare possibility of all three. The “Perfect” Set-Up It is very difficult to develop an edge with a large, widely company. Information is abundant, models are standardized, and expectations are calibrated. The ideal setup often looks different: Smaller company – not widely followed Management is not promotional Business model is complex Methods are unorthodox A colorful history that creates lingering scepticism At first glance, that does not sound attractive. But what if that same company: Delivered best-in-class performance over the past five years? Has strong underlying fundamentals? Has a compelling long-term outlook? That combination can create opportunity. Is Fairfax Complex? There is different. And then there is complex. Fairfax is both. Business Model Fairfax operates two very different businesses: P/C insurance and investment management. Most P/C insurers primarily invest in fixed income. Fairfax does far more — equities, private investments, operating companies, and alternatives. This creates additional income streams and provides significant flexibility in capital allocation. Traditional P/C insurers: ~2 core income streams Fairfax: 5 reported income streams + hidden value as a 6th The investment management side is where much of the complexity lies. The breadth of activity is wide, and each type of investment has different accounting treatment. Hidden Value - Accounting Results Understate Economic Results A sizable portion of value creation is not fully reflected in accounting results. Hidden value — particularly in associate and consolidated holdings — represents an important source of future earnings. Fairfax provides disclosures that help quantify the amounts involved. But here is the really interesting part: market participants appear to ignore this value in their analysis and valuation of the company. It is frequently treated as if it does not exist. Time Horizon and Volatility Fairfax runs the business with a long-term focus – the goal is per share value creation. That leads the company to invest in equities, which deliver much better long-term returns than bonds. Many P/C insurance peers, by contrast, are managed with a short-term focus, prioritizing smooth and predictable results. For Fairfax, volatility is opportunity. Exploiting volatility has been one of its super powers and an important driver of long-term results. Market participants, however, often view volatility as kryptonite. Paradoxically, the market penalizes Fairfax for something that is actually one of its strengths. Unconventional Capital Allocators Fairfax’s approach often feels closer to Henry Singleton or John Templeton than Warren Buffett – unconventional, opportunistic and global. And it has worked. The company has delivered a share price CAGR of ~19% over 40 years (US$, with dividends reinvested). Yet despite delivering exceptional long term performance, skepticism remains. Investors frequently react negatively to Fairfax’s equity portfolio without following the underlying companies or considering performance. For example, Fairfax’s 10 largest public equity holdings were up 47% in 2025. Trust Fairfax messed up from 2010 to 2020. While the turnaround over the past five years has been remarkable, rebuilding trust takes time. Institutional memory — especially in Canada — is long. Confidence is improving, but not fully restored. Accounting Fairfax reports under IFRS. The introduction of IFRS 17 in 2023 significantly changed how Canadian P/C insurers present results. For many investors, this makes the numbers harder to interpret and compare to US GAAP-based peers. Change Most companies change slowly. Fairfax has evolved dramatically in the past five years: 2020: A classic turnaround play 2022: Morphed into a value play 2024: Morphed into a quality play The company continues to evolve. That makes it harder to understand — and harder to value. Final Thoughts: Conditions for Mispricing Fairfax is: Different (business model, long-term orientation) Unconventional (capital allocation) Reported under IFRS 17 (adding complexity) Marked by a colorful past (2010-2020 missteps) Evolving rapidly (income streams and structure) These characteristics create both analytical complexity and psychological barriers for market participants. They also create the conditions for mispricing. The Analyst Challenge: A Square Peg in a Round Hole Most analysts cover Fairfax as a P/C insurance company. They apply a standard model designed for traditional insurers. That model works well for most peers. It does not work particularly well for Fairfax. Why? Because it struggles to incorporate: The investment management business Long-term capital allocation decisions Structural changes within the company So why not build a better model? Fairfax is only one company. Analysts cover many. Building a bespoke framework takes time — and there is little incentive to do so. As a result, much of the research on Fairfax focuses heavily on underwriting and interest income, while overlooking the equity portfolio, capital allocation and total expected investment performance. That said, coverage has improved over the past five years. In 2020, very little information was available. Today, some of the research is quite good — though quality remains uneven. (Buyer beware!) This gap creates opportunity for investors willing to do the work.
-
My guess is effective shares outstanding will finish 2025 at about 21 million. Fairfax finished 2013 at 21.3 million, so we are into 2012 levels. In 2010, Fairfax had 20.5 million shares outstanding. My guess is Fairfax will be below 2010 levels by the end of 2026. My point is we aren't at 2015-2017 levels for effective shares outstanding. We are quickly approaching 2010 levels. That is a significant development. Net premiums written: 2010: $4.45B 2025E: $26.6B 15-year increase: $22.15B, or 498% CAGR: 12.7% Importantly, this reflects Fairfax's growth in net premiums over the market cycle.
-
If you include hidden value, Fairfax is trading today at a price to 2026YE BV of around 1 x. For a company compounding at +15% per year that is crazy cheap. The kicker: this is a high certainty investment for Fairfax. I hope they keep taking out 3 to 4% of shares each year. That still leaves them lots of $ to reinvest in other high return / strategic opportunities (grow the top line / strengthen the company).
-
You are focussed on the price Fairfax is paying. Can you tell me what Fairfax is getting from this transaction? "Blind faith in management" This is not a new purchase for Fairfax. They have been partnered with KW for +15 years? They KNOW this company inside out (Wade Burton is on the Board). Further, Fairfax has shown very good judgement over the past 8 years - in terms of which management teams they want to partner with long term. Their 'hit rate' has been very good. I am inclined to give them the benefit of the doubt (with my eyes wide open).
-
Look at what has quietly happened under the hood at Fairfax over the past 5 years. With this deal, Fairfax is locking in another large and growing income stream (the platforms KW is building out). This income stream is part of the fixed income bucket. It is not correlated with the P/C insurance cycle. It is $400 million and growing rapidly. Brilliant. Fairfax will be able to deploy a significant amount of capital into these platforms moving forward - growing the income stream over time (like it has been doing for the past 5 years). Lots of people are all worried about where interest rates go from here... and what it means to interest income moving forward at Fairfax. We have part of our answer today... This deal provides Fairfax with a long runway of opportunities to continue to earn strong returns on its fixed income portfolio. Of course, there is much more to the KW deal. Price is what you pay... value is what you get.
-
+1 He was the GOAT.
-
In terms of what this means for Fairfax, I think it is a mistake to look at KW transaction primarily through the lens of the stock price. From Fairfax's perspective, the stock ownership was 'tablestakes.' The value of the KW relationship is: The real estate partnerships: off the top of my head, I think this has performed well over its life More recently, the $5B mortgage loans/PacWest business (7 to 8% yield?) = $350 million to $400 million per year The key question: What is the value Fairfax is deriving from its many significant partnerships with KW? What is Fairfax giving? KW stock Debentures Capital for real estate partnerships Capital for mortgage platform What is Fairfax getting? Dividends on KW stock Interest on debentures Return from real estate partnerships Return from mortgage platform And today, Fairfax is unarguably buying KW low. It looks like KW' business is stabilizing - this is the perfect time to buy it (much of the risk is gone). Importantly, Fairfax understands KW exceptionally well. Clearly, they really like the management team at KW. This now effectively locks up real estate expertise for Fairfax - across a number of verticals. This is just another example of Fairfax diversifying its business model in an opportunistic and smart way. Investors and analysts probably won't 'get it.' This transaction looks very strategic. It gives Fairfax some things that are very valuable (the platforms KW is building). These provide Fairfax with a great way to deploy large amounts of capital at very attractive rates (much higher than treasury yields). You can almost look at this as a brand new income stream for Fairfax - large and growing (a subset of the fixed income stream). I apologize in advance... my thoughts above are a mess. KW is a really complicated investment for Fairfax (especially for me) - it has a lot of really interesting layers. This could be a good one for Fairfax.
-
Let’s bring the KW discussion to this thread. Another public holding of Fairfax will soon be private. Fairfax will provide up to $1.65B. It will be interesting to see what Fairfax will earn. KW was https://www.fairfax.ca/press-releases/kennedy-wilson-enters-into-agreement-to-be-acquired-by-consortium-led-by-william-mcmorrow-and-fairfax-financial-2026-02-17/ “Concurrent with entering into the Merger Agreement, Fairfax has entered into a commitment letter pursuant to which Fairfax has committed to provide the Consortium with funding up to an aggregate amount of $1.65 billion, which is the amount necessary to fund the cash purchase price in respect of the Transaction, the redemption of those preferred shares of the Company not owned by the Consortium, and certain other amounts required to be paid under the terms of the Merger Agreement. The Transaction is not subject to a financing condition. Following consummation of the Transaction, the KW Management Group, led by William McMorrow, will have effective and operational control of and will continue to lead and have ultimate responsibility for the Company and its subsidiaries. Fairfax is expected to have a majority of the economic interest in the Company immediately following the closing of the Transaction.”
-
@Txvestor, I appreciate the opportunity to discuss Fairfax. Please keep the comments coming. In terms of future compounding, I think ROE = 15% is a good mildly conservative baseline number to use for the next 5 years (as far out as I go). I view this as mildly conservative because of all the hidden value that has accumulated over the past 5 years (and continues to grow) - this will eventually flow into future earnings. I don’t think I have ever pretended 2010 to 2020 did not happen. I just don’t think parts of it are relevant today (I think Fairfax learned from their mistakes made). And every year Fairfax continues to execute well it becomes less relevant (for me). Fairfax approaches all aspects of their business through the lens of value investing (of course, there are other considerations). Given how well they have executed the past 5 years I am ok giving them some rope - from my perspective they have earned it. I don’t have a strong opinion about what they are doing with the average duration of the fixed income portfolio (I think Brian Bradstreet and team are very good). I think it is guaranteed they will make mistakes moving forward. Buffett made lots over his whole career. Investors in Fairfax have been very lucky the past 5 years - the company has been on a hot streak. My eyes are wide open.
-
@Hektor, I think that is what Fairfax wants. But I don’t think it is realistic. And that is because of how Fairfax invests. They are very good. But they tend to be very unconventional. And every decision they make is HIGHLY scrutinized - even the small ones. And they are going to have some clunkers. A couple in a row? Bottom line, one of my high certainty views with Fairfax is the share price is going to be volatile moving forward (like all stocks). And that is what we have seen over the past 4 months (2 fairly large sell offs as their business just keeps chugging along).
-
Fairfax had two periods where results suffered for extended periods because of self inflicted wounds: Bad insurance purchases at the end of the 1990’s Equity hedge (exited 2016) and shorts (ended 2020) The first mistake put insurance on the right path. The second mistake put investment management on the right path. Those are Fairfax’s two businesses. An investor in Fairfax today is getting a company that has learned important lessons. It is battle tested. The amazing thing to me is that the company has been able to compound at 19% for 40 years, despite taking a couple of big missteps. I think that provides a pretty strong indication of the incredible strength of their business model. The interesting thing is we have never seen the current version of their business model before: strong insurance operations + strong investment management + strong capital allocation. And we are getting this at a very low valuation (P/BV = 1.35) and we get all the hidden value for free (+$4B?).
-
I like Singleton as a comparable for Fairfax, but looking through a wider lens: 1. Optimize results at the operating companies. I think many investors are asleep at the wheel on what has happened at Fairfax over the past 8 years on this front and what it means for the company moving forward (quality ofearnings). Insurance really got going on this path in 2011 when Andy Barnard got put into a leadership position. Equities got going on this path around 2018. it has been a long road - but it looks like mission accomplished. Both insurance and equities are both generating an enormous amount of cash for Fairfax. This is a relatively new and very exciting development for Fairfax. 2.) Being maverick at capital allocation. Buying back stock in the 1970’s was considered a dumb thing for a management team to do. Singleton was heavily criticized then. Singleton did it because he was so analytical and rational. He didn’t care what others thought. And he owned/controlled enough of the company he could do unconventional things and not to worry about getting removed. (Does this sound familiar?) I look at Fairfax’s TRS investment as classic Henry Singleton. Also how they use equity of the insurance subs (minority interests) and non-insurance subs (public markets) to raise capital. Again, classic Singleton. Nontraditional. Ignored. Misunderstood. 3.) Of course there is also the share buyback angle. It will be very interesting to see how aggressive Fairfax remains on the buyback front. If the stock remains perpetually undervalued (which also happened with Teledyne) they may get a wonderful opportunity.
-
@longlake95, I appreciate the comment. As I do my updates, I have been able to add more pieces that (hopefully) make them a little better. It is work in progress. I am interested to see what they do with non-insurance businesses moving forward. I don't think they want to become a conglomerate like BRK. But I think they see the value of having a large earnings stream that is separate from the insurance business - makes the company more resilient. One of the things that makes Fairfax so hard to understand is it keeps morphing as a company. Part of this is because of how opportunistic they are - what they do depends on what Mr. Market serves up. Non-insurance is perhaps the best example of that today. That income stream looks like it is breaking out - and it is not on anyones radar. I am putting together a post on why Fairfax is so hard to understand and so misunderstood - and how that can provide an investor with a big edge.
-
@73 Reds, thanks for commenting. I do like to try to lean out a little with my analysis. I agree, most P/C insurance companies have performed well over the past 6 years. I think most will also perform well moving forward - all are going to be gushing cash and most will be aggressive with buybacks. Starting point. This is important. If I had used 5 years as the time frame, Fairfax would have looked even better - its stock price was still depressed at Dec 31, 2020. Instead I decided to use Dec 31, 2019 because this took Covid out of the picture. Now you say "Fairfax started from such a low base". We know that now. But we didn't know that then. Fairfax was not on most investors radar in late 2019. What drove performance the past 6 years. You reference the TRS. Yes it has been an outstanding investment. But Fairfax has have a bunch: Fixed income: taking the average duration to 1.2 years in Dec 2021 was a masterstroke and saved the company billions in losses. Share buybacks: crazy how many shares they bought back (and the price). Selling 9.9% of Odyssey to fund part of the buybacks was a masterstroke. Asset sales: pet insurance ($1 billion gain), RFP (top of lumber cycle), Stelco (top of steel cycle), Orla (after big gain). Equities: Pulled the weeds and watered the flowers: too many examples to list. Their equity portfolio has been significantly upgraded (in terms of quality) and it looks very well positioned today. It has been performing very well. Insurance: in addition to all the above, they doubled the size of the insurance business. The big learning for me over the past 6 years is how good Fairfax is at capital allocation. They have been putting on a clinic. This matters to an investor today because it is capital allocation skill that determines future ROE. To me that is the big disconnect with Fairfax today - the stock is being priced like they are terrible at capital allocation.
-
Two questions for board members: What do board members think of my suggestion in my post above that Fairfax could remain perpetually undervalued as a company? Would perpetual undervaluation be a good or a bad thing for long term investors if that happened? At very high level, it makes capital allocation exceptionally easy - buying back stock will provide the company with a high return/high certainty floor option. Alternative investments will need to meet a very high threshold. The downside is the company will not be able to use overpriced shares as a source of capital (i.e. for a big future acquisition).
-
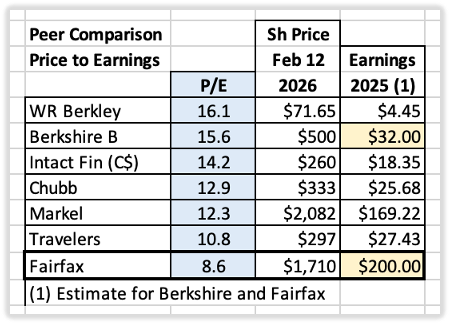
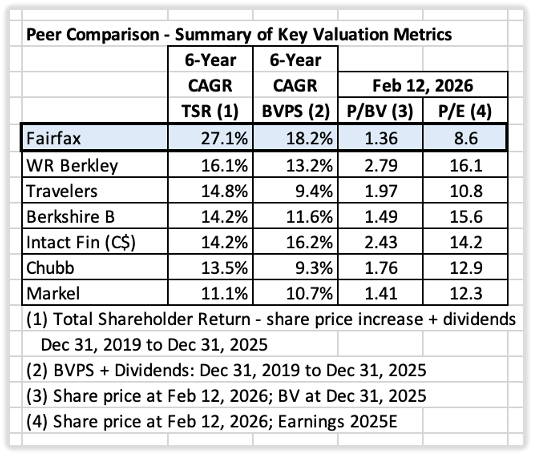
Performance and Valuation – Comparing Fairfax to P/C Insurance Peers - Part 2 Interpreting the Results Whether measured by: BVPS growth + dividends, or Total shareholder return Fairfax delivered outstanding performance over the six-year period from 2020 to 2025—both in absolute and relative terms. What Drove the Results? Steady improvement and strong growth in insurance operations Major gains in the investment portfolio Record earnings generation Best-in-class capital allocation Compounding working its magic A favorable external environment aligned with the company’s capabilities The natural next question: How is the market rewarding this top-tier performance? Valuation Analysis 1) Price-to-Book Value (P/BV) Fairfax P/BV: 1.36 Fairfax has the lowest P/BV in the peer group. Compared to higher-valued names such as W.R. Berkley and Intact Financial, Fairfax trades at a meaningful discount. Importantly, Fairfax’s book value materially understates its economic value. Adjusting for this suggests the company’s economic P/BV is even lower. In other words, the stock is cheaper than it appears based on reported numbers. 2) Price-to-Earnings (P/E) While P/E is not ideal as a stand-alone metric for insurers, it remains useful for peer comparison. Fairfax trailing P/E: 8.6 Once again, Fairfax screens as the cheapest stock in the group—by a wide margin. Summary of Findings Performance Over the past six years, Fairfax has delivered: Best-in-class BVPS growth + dividends Best-in-class total shareholder return Valuation Despite this performance, Fairfax currently trades at: P/BV: 1.36 P/E: 8.6 Both are the lowest among peers. Conclusion: Investors can buy the top-performing P/C insurer—with strong future prospects—at the lowest valuation in its peer group. Interpreting the Disconnect What explains the valuation gap? Management quality? Best-in-class (we have gone into great detail on this important topic in the past) Earnings quality? Highest in the company’s history; durable and repeatable Future prospects? Stronger than ever, with both insurance and investment engines performing at a high level So, what else could explain it? Likely factors include: Smaller company – not widely followed Management is not promotional Business model is complex Unorthodox methods Past trust issues and a colorful history Fairfax remains under-followed. It is hard to understand. It is unconventional. As a result, it is often misunderstood and underappreciated – conditions that can lead to persistent mispricing. This is not a complaint. It is simply an attempt to be rational and grounded. Investors need to operate in the world as it exists—not as they wish it existed. Being Perpetually Undervalued – A Feature, Not a Bug Is owning a perpetually undervalued compounding machine a bad thing? For long-term investors, it can be a meaningful advantage. Benefits for Investors Long learning runway – Time to build conviction Position sizing – Easier to hold a concentrated stake Patience – Less temptation to sell due to overvaluation concerns Benefits for Fairfax Persistent undervaluation creates an opportunity to repurchase shares at attractive prices. This is essentially the “Buffett dream scenario”: A high-quality business earning strong returns on capital while buying back stock at low multiples for years. Each buyback at a low multiple accelerates per-share value creation. Will Fairfax do it? Based on their actions in recent years, yes. Over the past six years, Fairfax has spent $4.5 billion repurchasing shares and reduced effective shares outstanding by 5.8 million (21.7%). Average cost: $773 Share price (Feb 10, 2026): $1,710 Outstanding. How the Big Money Gets Made Fairfax is a compounding machine. These businesses are rare. When you find one, the key is simple: Hold it. Let it compound. Paradoxically, persistent undervaluation can make that easier—and more profitable—over time.