Viking
-
Posts
6,052 -
Joined
-
Last visited
-
Days Won
78
Content Type
Profiles
Forums
Events
Everything posted by Viking
-
I hope the Murad (CEO) manages investors/analysts like Fokion (CEO at Eurobank)… underpromise and over deliver. In terms of amount for a possible dividend, the key will be to do two things. Set it at a rate where: It doesn’t handcuff the business - short or long term. It can be modestly increased each year. It will not be good if Murad overpromises and then under delivers. People are going to give him a chance… but they will probably be quick to exit if disappointed.
-
There is a lot to like about AGT 2.0. Strong founder/seasoned CEO. Clean balance sheet. Strategic transition to more table results already well underway. But it might take two or three quarters to get a cleaner look at the business results (with debt/interest expanse largely eliminated). AGT releases Q4 and YE results on March 16 after market close.
-
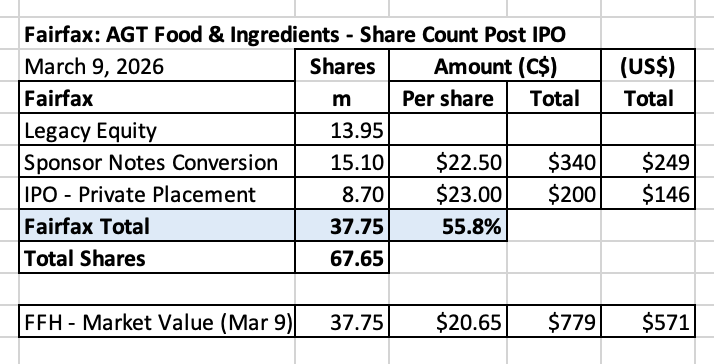
Here is an update on AGT Food & Ingredients - post IPO. Fairfax did two things: Converted sponsor notes to equity = C$340M = US$249M IPO - Private Placement = $200M = US$146M This is a significant equity investment for Fairfax. Of course, they understand the investment very well (having owned it since 2018). The market value of Fairfax's investment in AGT is US$571M, making it something like Fairfax's 10th largest equity holding. But at ~2% of the total equity portfolio, it is a small position. This will be an interesting position to monitor in the coming year. The IPO did not go well. What was the problem? Here are some guesses: AGT is a business in transition - from a commodity to more of a packed goods business. There has been a lot of change happening under the hood at AGT. They had a lot of debt. This has been eliminated (Fairfax converting their sponsor notes to equity, the IPO and private placement with Fairfax). Reputation - AGT. AGT was a terrible investment the last time it was public. Why would they get the benefit of the doubt now? Reputation - Fairfax. The last two take public investments Fairfax sponsored were Farmers Edge and Boat Rocker. Both were train wrecks for minority shareholders. Why would Fairfax get the benefit of the doubt now? AGT is important. Is it an example of 'old Fairfax'? Where minority shareholders lose a bundle? Or does it become an example of 'new Fairfax'? Where minority shareholders actually do well when they partner with Fairfax on an investment? I am betting on the latter (I bought a starter position in AGT on Friday). Fairfax needs to continue to earn back the trust of investors (yes, it remains a work in progress). It has been doing all the right things for the past 5 years. In the coming years, the AGT IPO will provide another important data point.

-
I have begun the process of updating my Excel tracking sheet for Fairfax's equity holdings. The Excel workbook is attached below. Please let me know if you see any errors. Summary of the high-level logic that was used. 1.) Begin with Fairfax’s summary of common stock holdings from page 15 in 2025AR. Update share count and carrying value. Get the spreadsheet to match each of the holdings and each of the totals (Dec 31, 2025): Mark to market Associates Consolidated 2.) Incorporate positions we know about that Fairfax did not included in their summary. Limited partnerships: BDT, Shaw Kwei and Waterous/Strathcona Associates: Waterous/Greenfire (share count) + legacy positions 3.) Add new news from Q1 2026 Increase in Under Armour Small add to John Keells AGT IPO Thanks to @SafetyinNumbers for help with share count for Waterous/Strathcona and Waterous III/Greenfire (estimates as Fairfax did not give actual share count in AR). To state the obvious: the spreadsheet is a very rough estimate. Fairfax Mar 9 2026.xlsx
-
I think it matters what the investment is. Orla is a gold producer. Commodity stocks are not buy and hold type investments. You have to sell them when they go up. Fairfax’s average cost on the common shares was C$4.80/share. They sold 25 million shares at $17.64. This was a 268% gain in ~2.5 years. Outstanding. They still have exposure to 76 million shares. And now that Foran is being taken out by El Dorado, they will have even more exposure to gold (when that deal closes). Fairfax sold RFP at the top of the lumber cycle. Stelco was sold at a crazy high price. Fairfax sold 25% of Orla and locked in a massive return. They have been making obscene money with their resource investments. I hope they keep monetizing some of them - locking in big gains. And redeploying the proceeds into other good opportunities - which is what they have been doing. Also, importantly, Orla has quickly become Fairfax’s 4th largest equity holding - it has become a very large position. Especially for a commodity play. Even after selling 25% of the position it is still the 4th largest holding (at about US$1.4B).
-
Hamas attacked Israel in October of 2023. At the time, Iran was a powerful nation. Its power was amplified through its proxies in Hezbollah, Hamas and the Houthis. Assad was the leader in Syria. Bottom line, the paradigm of the previous 40 years was fully in place - it was an unstable shit show. Fast forward to today… 2.5 years later. Has anything changed? Everything in the middle east has changed. Iran’s power/influence is at its lowest point since the regime came to power. Hamas is in deep trouble. Hezbollah’s power is greatly diminished. Assad is gone from Syria. Israel’s power/influence is growing. Bottom line, I am much more optimistic today about a lasting peace actually happening in the middle east than i was 2.5 years ago. Many of the countries in the region want that (they are trying to improve the lives of their people). It looks like the stars have aligned in the region. There is the potential that the risks from Iran, Hezbollah and Hamas might be permanently altered. The possibility needs to be fully exploited - it is a once in a generation opportunity. A permanently weakened/diminished Iran (the people running the country) would be a wonderful thing for all the people of the region long term. (Yes, coming at a very high cost for some today.)
-
@mananainvesting , that is a great graphic description of what has been going on...
-
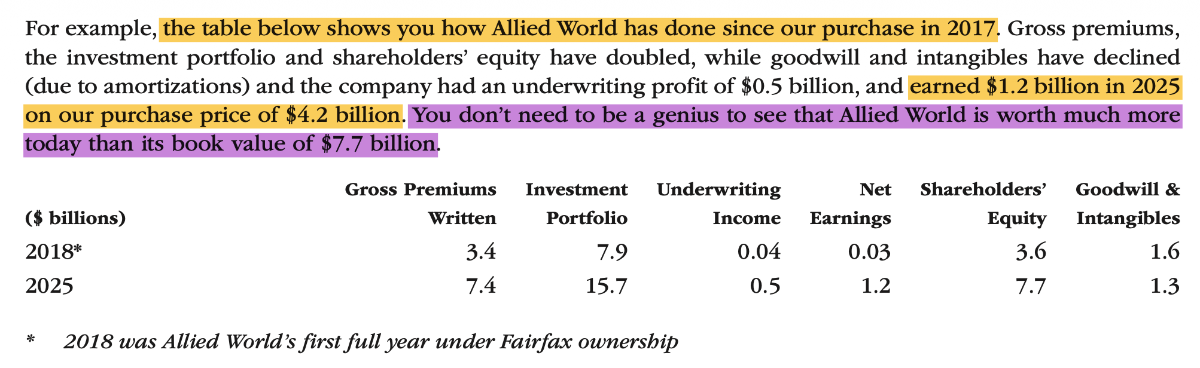
We know Fairfax's book value is grossly understating its economic/intrinsic value. In the 2025AR, Prem was unusually blunt in highlighting this growing discrepancy: "In the past, we used book value per share as a first measure of intrinsic value. Those days are long gone! Our intrinsic value is way above our book value now!" I don't think Fairfax has ever been this clear in its communication on this topic. Investors need to pay attention. In his letter, Prem provided a couple of good examples of where the discrepancy is growing the most: Excess of FV over CV for the non-insurance associate and consolidated holdings, which was $3.1B ($151 per share) at December 31, 2025. This is a very transparent example. In the AR, Prem hints at another example: the MV "could be" understated for many of the private companies in the consolidated non-insurance companies bucket. The fact that Prem felt it necessary to point this out suggests to me that this is likely a material amount. And the disconnect is not limited to the equity holdings. It also involves the insurance subsidiaries. Prem points out that Allied World earned $1.2B in 2025 and had a 2025YE book value of $7.7B. Prem is uncharacteristically blunt in his conclusion: "You don’t need to be a genius to see that Allied World is worth much more today than its book value of $7.7 billion." This is not an example of Prem being promotional. He is simply stating the obvious. I would describe his communication as being more incredulous than anything. Bottom line, what we are seeing play in recent years is Fairfax's intrinsic value per share is increasingly becoming unmoored from its accounting book value per share. Investors (and analysts) who decide to only use BVPS will be analyzing Fairfax with one arm tied behind their back - good luck with that approach. ------------ -----------
-
As I work my way through Prem's letter in the 2025AR I will be positing some random thoughts. Decentralization. Is this important to an investor in Fairfax? Yes. How important? Very. Fairfax is walking the talk when it comes to decentralization - this is one of the core building blocks of its organizational structure, competitive advantages and moat. The number of profit centres in its insurance business continues to increase every year: 2025: 275 2024: 250 2023: 225 2022: 200 We see a similar dynamic at play in its investment management business. In 2025, Quess was split into three companies: Quess, Digitide and Bluspring. Additionally, the Keg was spun out of Recipe (both are still private holdings). Benefits: transparency, accountability and empowerment, resulting in strong employee retention and better business results. This isn't a sexy topic. But it very important for long term shareholders. 2025AR: “We have over 275 profit centres across our group. Each profit centre is focused on a unique set of customers, geographies or products that benefit from market leadership, product knowledge and the ability to provide excellent customer service. These profit centres facilitate transparency, enabling Andy Barnard, Brian Young and Peter Clarke to effectively monitor the insurance operations. Empowerment thrives at Fairfax. We are always working on making our companies more indispensable to our customers.” 2024AR: “We have over 250 profit centres across our group.” 2023AR: “With the addition of added business from GIG, the $32 billion in consolidated gross premiums written is generated through our more than 225 profit centres across the group.” 2022AR: “The $27.6 billion of our consolidated gross premiums is generated through approximately 200 profit centres across the group.”
-
Planting Acorns: A Hidden Driver of Fairfax’s Insurance Growth - Part 2 Monetizing Oak Trees An important part of the Fairfax model is not just planting acorns. It is knowing when to harvest an oak tree. The market often misses this second step. Fairfax is willing to hold businesses for long periods, but it will also sell when the price becomes extraordinary or strategic circumstances change. Three recent examples illustrate the pattern clearly. ICICI Lombard: Pivoting When the Facts Changed ICICI Lombard is one of the best examples of what Fairfax does well as a company. Fairfax entered India early, partnering with ICICI Bank in 2001 to build a property and casualty insurer from scratch. Over time, ICICI Lombard became the largest private P/C insurer in India. Fairfax’s long-term patience, choice of partner, and decentralized approach all worked exactly as intended. But the most impressive part came later. When ICICI Lombard moved toward a public listing, Fairfax faced a choice: accept a much smaller ownership stake or pivot. Fairfax chose to pivot. From 2017 to 2019, it sold its entire position in ICICI Lombard for proceeds of roughly $1.6 billion, crystallizing approximately $1.3 billion of pre-tax value, while simultaneously seeding Digit with Kamesh Goyal. This was not a retreat from India. It was a strategic repositioning to preserve and expand Fairfax’s long-term exposure to the Indian P/C market through a new platform where it had greater influence and upside. First Capital: A Small Seed Becomes a Major Realization First Capital is another excellent example. Fairfax invested just $35 million in 2002 to back Mr. Athappan in building a P/C insurer in Singapore. Fifteen years later, First Capital had become the largest P/C insurer based in Singapore. In 2017, Fairfax sold the business to Mitsui Sumitomo for $1.7 billion and booked an after-tax gain of $1.0 billion — a stunning outcome from a single modest investment. The lesson is not simply that Fairfax found another winner. It is that Fairfax recognized when an asset was worth more to a strategic buyer than it was worth to Fairfax on a stand-alone basis. That willingness to monetize at an exceptional price — and then redeploy the proceeds elsewhere — is a major part of why the acorn strategy creates so much value over time. Pet Insurance: Opportunistic Monetization at the Right Time The sale of Fairfax’s pet insurance business in 2022 offers a third variation on the same theme. What began with the acquisition of Hartville in 2013 and Pethealth in 2014 eventually became a meaningful pet insurance platform within Crum & Forster. Then Fairfax recognized that industry consolidation and unusually aggressive valuations had created an opportunity. JAB acquired the business for $1.4 billion, generating a pre-tax gain of $1.2 billion and an after-tax gain of approximately $934 million. This transaction is especially important because it shows how Fairfax behaves when market conditions become unusually favorable. Management did not cling to the asset out of sentimentality. They sold when the price was extraordinary and redeployed the capital. That is classic Fairfax: open-minded, opportunistic, and rational. The Analytical Problem There is an important implication for investors. This capability cannot easily be incorporated into financial models. Analysts typically focus on near-term earnings drivers such as: underwriting profit combined ratios investment income interest rates catastrophe losses But the acorn strategy behaves very differently. Its outcomes tend to be: Characteristic Description Frequency Infrequent Predictability Low Size Often very large Timing Highly uncertain Impact Material when realized Because analysts cannot forecast these outcomes with precision, they generally exclude them from forecasts entirely. Value only becomes visible after an IPO, sale, or valuation re-marking. This creates a structural bias. Future value creation from these initiatives is systematically underestimated. Why This Matters for Investors Fairfax has compounded shareholder value at approximately 19% annually for nearly four decades. Two engines are usually credited for this performance: P/C insurance Investment management Both are correct. But they are incomplete. A third engine has quietly contributed to Fairfax’s long-term results: building, scaling, and occasionally monetizing new insurance businesses. The acorn strategy has several implications for investors. 1. Earnings Will Occasionally Spike When an acorn is monetized, the gain can be very large relative to Fairfax’s annual earnings. 2. Reported Earnings Understate Long-Term Value Creation Many acorns compound quietly for years before their value becomes visible in financial statements. 3. Traditional Models Miss This Value Because outcomes are unpredictable, analysts generally exclude them entirely. As a result, Fairfax’s long-term earnings power may be systematically underestimated. 4. Capital Allocation Is Better Than It Appears The full value of Fairfax’s capital allocation skill is easy to miss if an investor focuses only on quarterly underwriting profit or interest income. Some of management’s best decisions only become visible years later, when an acorn becomes an oak tree — or when an oak tree is sold at an exceptional price. The Bigger Picture This helps explain why Fairfax is often misunderstood. Many investors still look at Fairfax primarily through a conventional insurance lens. They focus on the combined ratio, reserve development, interest income, or near-term earnings estimates. Those things matter. But they do not capture the full economics of the business. Fairfax is not just an insurer. It is also an allocator of long-duration capital operating inside insurance markets around the world. That distinction matters. It helps explain why Fairfax has been able to create value in ways that are difficult to capture in a standard earnings model. It also helps explain why the company can look ordinary on the surface while something much more valuable is developing underneath. Much of Fairfax’s future value creation is likely already being built today in businesses that investors do not yet fully appreciate. Some of those businesses were planted years ago. Others are only just beginning. Most will develop quietly. A few will become very important. Summary Fairfax’s acorn strategy highlights an important truth about the company’s business model. Much of the value creation occurs quietly and over long periods of time. Fairfax plants small insurance businesses with talented operators, gives them capital and autonomy, and allows time and compounding to do the heavy lifting. Occasionally, one of those acorns becomes a very large oak tree. And sometimes Fairfax monetizes that oak tree and recycles the capital into the next set of opportunities. These initiatives share several characteristics: they are few in number they are difficult to predict they are monetized infrequently when successful, they are very large That is why they are easy to miss. But they should not be ignored. This capability has already created billions of dollars of shareholder value at Fairfax through investments such as ICICI Lombard, First Capital, Pet Insurance, and Digit. More importantly, it is still at work today. Across Fairfax’s global insurance operations, numerous acorns have already been planted. Some were planted many years ago. Others are only beginning to grow. Most will develop steadily. But every few years, one becomes an oak tree. And when it does, the impact on Fairfax — and its shareholders — can be transformative. Appendix: An Example of What is Happening within Fairfax’s Insurance Businesses In 2024, the Crum and Forster published a book, called The Once and Future C&F, to chronicle the company’s 200-year journey. Click the link to get a free PDF copy of the book: https://www.cfins.com/the-once-and-future-cf-landing/ From its humble beginnings as a New York fire insurance company to its status as a market leader in property & casualty, accident & health, and specialty insurance solutions, this book delves into the pivotal moments and the leaders that have shaped the company's legacy. What CEO Marc Adee had to say was very insightful to our “acorn” theory. From page 72 - Once and Future C&F (Marc Adee) Just like the founding fathers of Crum & Forster, I have a Dream Team. I have worked with most of my senior management team for a long time. We may only be part of the way to the 50 years that Lester Parsons’ Dream Team stayed together — since most of us squandered our teen years in school, instead of heading right into insurance — but I feel that some of the years in the trenches should count twice. While I would love to profile everyone here, it would probably get a little corny. I will embarrass a few people to complete the story of the acorns that grew into mighty oaks. Gary McGeddy started the A&H Division in his basement. In 2024, the A&H team will profitably write over $2 billion of gross premium. He and I started our careers with Fairfax the same month in 2000. Gary and his loyal team of associates and partners were along for the whole ride: TIG’s downgrade, Fairmont Specialty’s formation, the merger into C&F. All the while, Gary and his A&H team kept scrapping away — reinventing and upgrading, delivering results and developing their franchise and their people. If that were not enough, in early 2022 Gary noticed that the valuations for pet insurance companies were skyrocketing. While Fairfax is not usually inclined to sell any of their insurance businesses — especially one that was performing as well as Pet — they agreed to see what it might fetch in the marketplace. Thus was born C&F’s first unicorn: we sold the pet insurance business to JAB for $1.4 billion. Gary was good for two acorns (or maybe one acorn and one unicorn). I am excited to see what he will come up with next. Tom Bredahl made the leap from a relatively safe reinsurance underwriting job at Odyssey Re right into the challenging environment that was First Mercury’s restructuring. Several months in, I moved on to run C&F, leaving Tom to complete the actual hard work of building a business. In 2024, the Surplus & Specialty Division will profitably underwrite $1.4 billion of gross premium. Tom and his team were ready with perfect timing to hit what has been an unprecedented shift in business to the non-admitted market — the Golden Age of Surplus Lines. At the same time, S&S developed an innovative niche to address the insurance needs of the dynamic gig economy, which supercharged their business. You don’t get more New York than Marc Wolin and Seneca. Like the original North River Insurance Company, Seneca stuck to its knitting for a long time. When Marc took over as CEO in 2013 (he started at the company in 1989), Seneca started pushing for ways to improve at the margins. By the time Seneca’s main market (New York City property) opened up, Marc and the team were ready. In 2024, Seneca will write $700 million of very profitable gross premium. Marc reinvigorated and reinvented a company that was relatively set in its ways — and is now taking Seneca to new heights. C&F has always straddled the line between the specialty and standard lines worlds. Our Commercial Lines and Executive Risk Division can trace its lineage far back into C&F history, so it is not one of the more recently planted acorns. However, John Binder and his team have breathed new life into some of the long-time C&F product lines — and added a few exciting new ones along the way. They will write $800 million of profitable gross premium in 2024. Culture and performance definitely form a virtuous circle. As I write this, we have an impressively diverse collection of specialty businesses. We have a 10-year track record of growth and underwriting profit - we have more than tripled in size and have a 10-year combined ratio of 98.
-
Planting Acorns: A Hidden Driver of Fairfax’s Insurance Growth - Part 1 An Underappreciated Strategy Behind Fairfax’s Long-Term Value Creation Introduction Great compounders often share a common trait: they plant many small seeds that quietly grow into very large businesses over time. Most seeds never become significant. A few fail. But occasionally one grows into an oak tree — and those few successes generate extraordinary value. Fairfax Financial has quietly applied this strategy for decades within its insurance operations. Fairfax grows its insurance business in three primary ways: Organic growth Acquisitions Planting small, early-stage insurance businesses with exceptional operators The first two are well understood. The third receives far less attention from analysts and investors. Yet historically it has produced some of Fairfax’s largest sources of value creation. Fairfax regularly backs talented entrepreneurs building new insurance platforms. These initiatives typically begin as small investments — what Fairfax leaders sometimes refer to as “acorns.” Over time, some of these acorns grow into very large businesses. And occasionally, when price and circumstances are right, Fairfax monetizes an oak tree and recycles the capital into the next generation of opportunities. This combination — incubation plus opportunistic monetization — is one of the least appreciated features of Fairfax’s business model. A short paragraph from Prem's letter in Fairfax’s 2025AR illustrates the strategy still at work today: “Now in its second year as a public company, Digit Insurance continues to excel under the leadership of Kamesh Goyal. Digit Insurance finished 2025 with $1.3 billion of premium, 5,000 employees and had $113 million in earnings. With the success of Digit Insurance, we have partnered with Kamesh again in India on Digit Life Insurance and a reinsurance company called Valueattics Re. We have invested $80 million for a 34% interest in Digit Life and $16 million for a 65% interest in Valueattics. It is still early days, but Digit Life wrote $185 million of premium in only its second year and Valueattics wrote $20 million of premium in just its first six months.” Fairfax Financial, 2025AR At first glance this appears to be a routine update on an investment. It is not. It highlights one of Fairfax’s most powerful — and least appreciated — competitive advantages. From Acorns to Oak Trees Fairfax’s history includes numerous examples where small initiatives eventually became very large businesses. Digit Insurance is a recent example. Fairfax invested in Digit in 2017 (cost $101 million), backing entrepreneur Kamesh Goyal to build a modern, technology-driven insurer in India. Less than a decade later, that investment was worth $2.039 billion at December 31, 2025. Fairfax’s Investment in Digit Cost (total investment less dividends received): $101M Fair value (Dec 31, 2025): $2.039B CAGR: 41.9% Operationally, Digit continues to scale rapidly: Premium: $1.3B Employees: ~5,000 Earnings: $113M (2025) Digit is now a major insurer in India and continues to grow under Goyal’s leadership. Fairfax planted a small acorn in 2017. Today that acorn has grown into a very large oak tree. Digit is not unique. Earlier generations of acorns produced similar outcomes. Acorn Outcome ICICI Lombard Sold from 2017-2019 for ~$1.6 billion First Capital Sold in 2017 for $1.7 billion C&F Pet Insurance Sold in 2022 for $1.4 billion Digit Insurance $2.039 billion fair value Ki Emerging digital Lloyd’s platform These successes are not frequent. But when they occur, the impact on Fairfax can be enormous. Planting the Next Seeds Importantly, Fairfax does not simply harvest success and move on. Instead, it reinvests alongside proven operators to build the next generation of insurance businesses. Following Digit’s success, Fairfax partnered again with Kamesh Goyal to launch two new ventures. Digit Life Insurance Fairfax investment: $80M Ownership: 34% Premium written (year 2): $185M Valueattics Re Fairfax investment: $16M Ownership: 65% Premium written (first 6 months): $20M Both businesses remain in their early stages, but early growth has been encouraging. Fairfax continues to plant the next generation of acorns. The Fairfax Acorn Framework Fairfax’s approach to building insurance businesses tends to follow a consistent pattern. 1. Back Exceptional Operators Fairfax partners with talented entrepreneurs who want to build an insurance business but require capital and long-term support. Examples include: Kamesh Goyal — Digit Mark Allen — Ki Andy Barnard — Odyssey Marc Adee — Crum & Forster R. Athappan — First Capital 2. Provide Permanent Capital Unlike private equity firms, Fairfax does not operate under short investment time horizons. This allows operators to build businesses patiently through insurance cycles. 3. Maintain Decentralized Control Entrepreneurs retain operating autonomy, which attracts strong leaders who prefer independence over bureaucracy. 4. Allow Time for Compounding Insurance businesses often take years to reach scale. Fairfax’s long-term orientation allows promising initiatives to mature. 5. Monetize Opportunistically and Recycle Capital Fairfax is not dogmatic. When an acorn matures into a business that is worth far more to a strategic buyer — or when the facts change — Fairfax will sometimes sell, realize the gain, and redeploy the proceeds into new high-return opportunities. This final step is critical. It turns the acorn strategy into a repeatable capital-allocation engine. Fairfax as a Venture Capitalist Viewed through this lens, Fairfax operates partly like a venture capital firm embedded inside a global insurance company. A venture capitalist provides capital to promising early-stage businesses in exchange for equity ownership. Most investments produce modest returns. Some fail. But occasionally one succeeds spectacularly. Those few successes generate a disproportionate share of total returns. Fairfax applies this same logic within the insurance industry. Instead of funding technology startups, Fairfax backs: insurance entrepreneurs niche underwriting platforms new insurance markets innovative distribution models The company provides: capital credibility infrastructure patience time And when the moment is right, Fairfax may also monetize the investment and recycle the capital into the next opportunity. That is not traditional insurance-company behavior. It is much closer to venture capital. Fairfax as an Insurance Incubator Over time, Fairfax has quietly become an incubator of insurance businesses. Across the organization, talented operators are given: autonomy capital long-time horizons This decentralized structure attracts entrepreneurs. Marc Adee, CEO of Crum & Forster, described this strategy in his 2024 book Once and Future C&F as “planting acorns that grow into mighty oaks.” Within C&F alone, several specialty divisions began as small initiatives launched by entrepreneurial leaders and eventually grew into large underwriting businesses writing hundreds of millions — and in some cases billions — of premium. Occasionally an acorn becomes valuable enough to monetize. For example, C&F’s pet insurance business was sold in 2022 for $1.4 billion. Acorns Can Be People Too Sometimes the acorn is not a business. It is a person. Prem Watsa highlighted this idea in Fairfax’s 2008 Annual Report when he described hiring Chandran Ratnaswami in 1995: “This may be an acorn for a future oak tree.” Over the following decades Ratnaswami helped build Fairfax’s entire Indian platform, including: ICICI Lombard Fairfax India Thomas Cook India Fairbridge Capital What began as a single hire eventually produced an entire ecosystem of businesses. Another oak tree. This point matters. Fairfax is not simply good at buying assets. It is good at identifying people, trusting them, and giving them the runway to build. Scroll to next post for Part 2
-
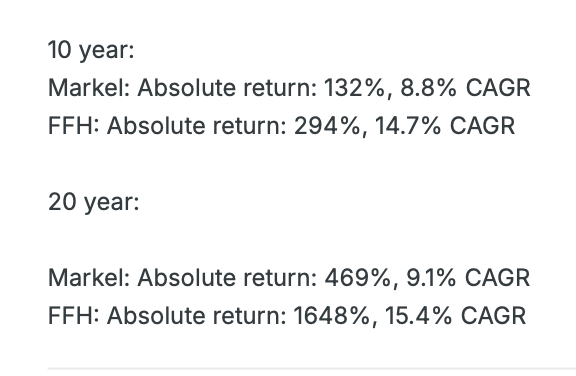
@djokovic1, I agree with your logic. Fairfax's 10 year return is much better than Markel's. But during the first 5 years of the period Fairfax had four large headwinds: Equity hedges - removed end of 2016 Short positions - final short removed end of 2020 CPI hedges - ended 2017 Portfolio was stuffed with shitty equity holdings (Fairfax Africa, APR Energy, Farmers Edge, Boat Rocker etc) The first three items resulted in a cumulative annual expense of $500 million from 2016 to 2020. My rough guess is #4 resulted in another annual expense of @$100 million from 2016 to 2025. It's actually much worse than this - and that is because of something called opportunity cost. It is kind of like compounding working in reverse. Bottom line, the 4 items listed above significantly impaired the performance of Fairfax's investment portfolio from 2016 to 2020 (the first 5 year period). The fact Fairfax has delivered a 14.7% CAGR over 10 years is amazing. What this means is Fairfax performance the past 5 years (2021 to 2025) has been much, much better than what it was from 2016 to 2020 (and what the 10 year average tells us). And that makes sense... a $500 million annual expense was eliminated. And as of today, the 'shitty' equity holdings have (mostly) been fixed. This eliminates another annual expense. And compounding is being allowed to work its magic - on the whole equity portfolio (not just a part of it). Invert What if the opposite had happened? Let's reverse the 5 year performance for Fairfax . Let's pretend what happened in 2016-2020 actually happened 2021 to 2025. And what happened 2021 to 2025 actually happened from 2016 to 2020. I would not own the stock today. Of course, the lesson is (partly) that sequence of returns (and the why) matters a great deal for investors. At least it does for me. Looking at a 10 year CAGR is useful. But it must be done with context - especially for a company like Fairfax that has changed so much over a 10 year period. This also explains why I continue to monitor Fairfax so closely. My eyes are wide open. (No different from any other concentrated position.) -----------
-
@Munger_Disciple, yes, Fairfax does have a big insurance business in the Gulf region. There could well be an impact in the short run. This might also create a hard market moving forward. Which would benefit Fairfax over the medium term. The volatility may also result in more companies deciding the exit the business (like when AXA sold its sizeable insurance business in the region to GIG in 2020) - presenting an opportunity for GIG to grow by acquisition. Bottom line, assessing the impact often comes down to the timeframe one uses. It is very counterintuitive. A good example might by Brit/Lloyds. That was a terrible business during Covid and the immediate years after. And the past couple of years, Brit has been printing money. Short term negative. Medium term positive. (At least that is how it looks to me from a very high level.)
-
@Hamburg Investor, sorry, my previous post was unclear. My reference point was where Fairfax's investment portfolio was sitting a week ago (before the war in Iran started). Feb 27: Fairfax's equity portfolio was up ~$1.3B Mar 5 (a week later): the portfolio is up ~$338M Decline since start of the war: the portfolio is down ~$950M. The drivers of the decline were Greek (Eurobank) and Indian stocks (Thomas Cook India) emerging markets (CIB) and currencies (primarily the Euro). It should be pointed out that compared to Dec 31, 2025, the portfolio is still up a solid $338M. Should Trump decide to end the war, my guess is the portfolio will pop higher. I really like how Fairfax is positioned. And I like the individual companies. Bottom line, this is a good reminder that my short term updates of Fairfax's portfolio should be taken with a strong dose of scepticism (when they move significantly in both directions). Fairfax Mar 5 2026.xlsx
-
@Berk, the possible impact of war in Iran on Fairfax really depends on two things: How long the war lasts. Timeframe used to measure impact on Fairfax: short term (next year) or medium term (next 3 to 5 years). The war is a big negative for countries/regions that import oil/gas. We have seen equities and currencies of these regions sell off (India, Europe, emerging markets). Fairfax owns stocks in Greece and India - these have sold off aggressively over the past week. Exploiting volatility is a super power of Fairfax’s. If this war continues at its current pace for months (unlikely) we will likely see carnage in financial markets. This would present Fairfax with opportunity. Bottom line, my view is the war is a short term negative for Fairfax. And possibly a benefit longer term (should it continue). Of course the most likely outcome is TACO (Trump declares victory and suddenly exits). And that would likely be neutral for Fairfax (we return to the pre-war dynamic).
-
@Duke In Shadows, that is a significant improvement. Well done!
-
This video is a good listen for Canadian board members. I don't agree with everything Doomberg says. What I like is his non-consensus views. Doomberg take (34:20 minute mark): Mental model to understand the war: US is short on air defence missles because of the war in Ukraine. Iran is a war in attrition: US needs a quick knockout blow. As long as Iran can continue to send missles in volume it suggests a military structure that is intact. Every American missile used in the Iran war is one that can't be used in Ukraine or Taiwan. If Iran can outlast the supply of interceptor missles in the region their position improves markedly. The chess move: when the US runs low on missles, China will get its opportunity to make a move on Taiwan. The bigger picture: WWIII started in 2014. We just don't realize it yet. ----------- We all know the only game Trump can play is checkers. The Chinese play chess. May you live in interesting times! key
-
@73 Reds, I am with you... the regime in Iran is pure evil. But in the middle east, I am not sure 'an innocent population' has ever decided 'their own course' - generally, its political culture/economic structure is completely different from what we have in Liberal democracies in the west. IMHO, what we have here is not normal or the natural way of things - and it takes decades (centuries?) to put in place. My view is how much of the middle east/Russia/China operate today is actually the normal way of things. The West is the abnormal way - the crazy thing is in recent decades we seem to have lost sight of how fragile what we have actually is... (and I am not talking about Trump).
-
Markets are of the opinion that what is happening in Iran today is a big nothing burger. And that is because these events are typically over quickly - and we all continue merrily on our way. I am not so sure. Now a year ago I was completely wrong about tariffs (too pessimistic) - so I am going to keep a more open mind this time around. I thought the video attached below was interesting. The presenter has an interesting take on why 'regime change' just doesn't work in the middle east. Actually it's worse... it usually results in a worse outcome. What happens in Iran is going to have a major impact on Trump's future. If he gets it right, perhaps he salvages the mid-terms. If he gets it wrong, the midterms get worse (perhaps Dem's get both the house and the senate). Iran is not Iraq. And Iraq turned into a catastrophe. Importantly, the milk has been spilt. So there is no point in debating "if it should have happened" or "why it happened". What I am very interest in knowing is where does it all go from here. Is it really a big nothing burger? Or does it get worse before it gets better.
-
@Txvestor, my spidey senses are tingling with EXCO for 2026. It appears they might have some pretty aggressive growth plans in place and they like to hedge - so we could see very strong earnings this year. I also think they might be a good take-out candidate. Especially if nat gas prices trend higher. Either way Fairfax wins.
-
@SafetyinNumbers, the split between mark to market and associate/consolidated is roughly about 50/50 (so about $13B each). But this split includes FFH-TRS - and values it at notional - in the mark to market bucket. This split also uses Fairfax’s classification methodology - and I think they put stuff like BDT and Shaw Kwei in the mark to market bucket when it is functionally more like a private holding (I think).
-
Fairfax’s Resource Holdings - An Underappreciated Engine Inside the Investment Portfolio - Part2 Just the Beginning? Importantly, these exceptional returns do not necessarily represent late-cycle excess. There is a growing narrative that capital is rotating from asset-light, high-multiple businesses toward: Industrials Materials Energy On a recent episode of The Compound and Friends, Strategas Research’s Chris Verrone and Daniel Clifton discussed what they view as a potential regime shift. Daniel Clifton summarized it as a move away from: Post–Berlin Wall globalization Falling inflation and rates Unipolar stability …toward a multipolar, resource-constrained world. If that thesis is correct, Fairfax is already positioned. Broad-Based Success "In this business, if you're good, you're right six times out of ten. You're never going to be right nine times out of ten." Peter Lynch Nine of ten of Fairfax resource holdings are up over the past 14 months. Based on Peter Lynch's rule of thumb, the team at Fairfax is looking pretty good with its execution in recent years. Opportunistic Monetizations: Discipline on the Exit Fairfax has not simply held resource assets. It has monetized when valuations became compelling. 1. Resolute Forest Products (2022) In July 2022, Fairfax sold Resolute Forest Products to Paper Excellence for: $665.6M ($20.50/share) Context matters: March 2020 price: ~$1.20/share. Sale price (two years later): $20.50. What did Fairfax accomplish? Sold near peak lumber pricing Redeployed capital Removed a historically poor investment at a opportune time 2. Stelco (2024) Sold to Cleveland-Cliffs in Q4 2024. Purchase (2018): $193M Proceeds (2024): $639M Dividends received: $122M Total return: $568M CAGR: 25.5% over 6 years Disciplined entry. Disciplined exit. 3. Orla Mining (Partial Sale – 2025) On December 5, 2025, Fairfax sold 25M shares of Orla: Proceeds: $316M ($12.64/share) Cost: ~$98M (~$3.94/share) Return: ~$218M, or ~220% Importantly: Fairfax still owns 76.9M shares valued at ~$1.5B (Feb 27, 2026). This is active portfolio management — not passive holding. Strategic Implications Several conclusions emerge: Fairfax’s resource exposure is intentional, not incidental. It reflects macro awareness and valuation discipline. It is implemented alongside proven operators. Execution has been strong. Monetizations demonstrate capital allocation skill. Fairfax’s leadership has invested through: The 1970s inflation era The commodity cycles of the 1980s The globalization boom The post-2008 monetary regime That experience matters. The Bigger Picture Fairfax does not own resource companies to “play commodities.” It owns them to build long-term intrinsic value per share. The resource sleeve is one component of a broader investment engine designed to: Protect purchasing power Capture cyclical opportunity Compound capital opportunistically When evaluating Fairfax, focusing solely on underwriting cycles misses the full picture. The investment portfolio — particularly the resource sleeve — is an active, high-conviction engine of value creation. Ignore it at your own risk. Looking Into the Future The Compound and Friends with Josh Brown and Michael Batnick, with guests Daniel Clifton and Chris Verrone ofStrategas Research – February 27, 2026 https://youtu.be/MV76MRQndTg?si=t25iNq9lu36uZ2Tc Comments from Chris Verrone and Daniel Clifton, Strategas Research, on a recent episode of The Compound and Friends with Josh Brown and Michael Batnck (37 minute mark): Chris Verrone: “I think what's so remarkable about this… don't even try to tell me for a second that people are positioned for this.” Michael Batnick: “For what?” CV: For this revenge of the old economy or the average stuff. I mean, for 15 years, all you've had to do is own the big stuff. Josh Brown: “Asset light” CV: “Don't even pretend to tell me this is where the positioning is. Like I am so skeptical when I see the Bank of America Fund Manager survey that says, you know, everyone's, you know, most overweight RSP and underweight Q’s. There's just no way. MB: “No way.” CV: “I’ll never forget, this is 6, 7 or 8 years ago. We're doing our macro conference in New York. I'm doing a fireside chat with Byron Wien, late, great Byron Wien, mentor to Jason Treader, to myself, to Dan. I asked, Byron, tell me what you remember about 1982? 1982, as we know, was kind of the top in rates. Rates had started to fall. Equity had started to turn up. And he laughed at me in front of 400 people. And he said, Chris, I didn't know it was 1982 until it was 1985.” JB: “It’s so such a great, important point.” CV: “It's so easy in this business to look back with hindsight and say: look at the regime shift. It was so obvious. We're in a regime shift right now. I don't think people are positioned for it. Maybe in like the tactical sense - the tactical book has it on. JB: “I've been talking about this regime shift as being a new paradigm that has nothing to do with what we're all accustomed to. We live in this world where it's small versus large, value versus growth, tech versus non tech, or defensive versus cyclical. And I think that this trumps all of those paradigms, and it comes down to AI immunity versus not.” CV: “Dan, isn't this the market that the Trump administration wants? Right? They want this revenge of the old stocks.” Daniel Clifton: “…at the risk of giving a narrative here, I think we're shifting out of the post Berlin Wall environment. Berlin Wall went down. The world globalized. Inflation comes down. Interest rates come down. That's why you wanted to own asset light companies. High PE’s. Less geopolitical volatility. That's all reversing now.” DC: “We're moving from a unipolar world to a multipolar world, and that means that there's going to be demand for resources. And that's why you want to be in this kind of sector - a long-term shift of being in industrials and materials. Because you want to be able to have access to this in a scarce world. I think we're at the very early stages of this process happening.”
-
Fairfax’s Resource Holdings - An Underappreciated Engine Inside the Investment Portfolio - Part 1 Fairfax has had an extraordinary five-year run. Why? Because it has executed at a high level across its two core business engines: P/C insurance Investment management Layered on top of that is strategic, disciplined and opportunistic capital allocation. Much of what is driving value creation today is happening “under the hood” — and is not widely understood. Fairfax is frequently analyzed as a traditional P/C insurer. It isn’t. This article focuses on one of the most misunderstood components of Fairfax’s investment engine: its resource holdings. The Investment Portfolio: Context Matters Fairfax’s total investment portfolio is approximately $76 billion: Fixed Income: ~$50B Equities: ~$26B Within the $26B equity portfolio sits a concentrated, high-conviction sleeve: Fairfax’s Resource Holdings 11 identifiable positions ~$3.9B market value (Dec 31, 2025) ~15% of total equity portfolio The holdings span: Oil & gas Gold & copper mining Metals and materials This is not incidental exposure. It is meaningful capital deployed with intent. Why Own Resource Stocks? 1. As Investments Fairfax is a value investor – broadly defined. Its mandate is not stylistic purity. It goes where value exists, not where consensus is comfortable. When assets are mispriced and capital is scarce, Fairfax steps in. Resource equities have periodically offered exactly that setup. 2. As a Strategic Hedge Real Return Risk in a Bond-Heavy Portfolio Fairfax holds ~$50B in fixed income securities. Even when held to maturity: Higher inflation erodes real purchasing power. Nominal coupons lose real value. For a large bond portfolio, the primary threat is unexpected inflation, not expected inflation. Commodities historically respond positively to: Rising inflation Supply constraints Geopolitical fragmentation In inflationary or resource-constrained environments, resource producers can function as a natural hedge. This is particularly relevant in a world transitioning from: Globalization Disinflation Ultra-low rates …to something structurally different. Owning resource equities is not just offense (generating returns). It is also defense (balance sheet protection). This dual function is widely underappreciated. Partnering With Proven Operators (“Betting on the Jockey”) Fairfax is not speculating blindly. It allocates capital alongside experienced operators with deep domain expertise and strong long-term track records. Key relationships include: Orla Mining and Foran Mining Pierre Lassonde – Co-founder of Franco-Nevada Strathcona Resources and Greenfire Resources Adam Waterous – Former Head of Global Investment Banking at Scotiabank Occidental Petroleum Backed heavily by Berkshire Hathaway (largest shareholder) Ensign Energy Services Murray Edwards – Founder and Chairman of Canadian Natural Resources Altius Minerals Brian Dalton – Founder & CEO Metlen Energy and Metals Evangelos Mytilineos – Founder & Chairman There is a pattern here: Fairfax partners with proven capital allocators and operators who understand their industries. This is deliberate capital allocation, not macro speculation. Jurisdictional Risk: A Quiet Structural Advantage The vast majority of production sits in North America. In a world of: Resource nationalism Regulatory unpredictability Political instability North American exposure provides structural risk mitigation. This appears intentional. (Smart.) The Critics Detractors often dismiss Fairfax’s resource exposure reflexively: “Resource stocks are terrible investments.” But many critics: Do not follow the specific companies Do not understand the operating partners Do not analyze the capital allocation history Do not evaluate actual performance Do not recognize the strategic hedge component They think Fairfax is being reckless. When the opposite is true. Opinions formed without facts rarely age well. The Facts: Performance Over the past ~14 months, Fairfax’s resource holdings have generated approximately: $1.85B in gains (~67% total return) Breakdown: 2025: $1.06B (~38%) 2026 YTD (to Feb 27): $788M (~23%) That is exceptional performance. Continue to Read Part 2
-
It’s looking more and more like Canada has a rational, pragmatic Prime Minister! (Exactly what the times are calling for.)
-
@dealraker, my admiration for you keeps growing. Please keep the lessons (and wisdom) coming. You have made an enormous impact on many others.