Viking
-
Posts
6,052 -
Joined
-
Last visited
-
Days Won
78
Content Type
Profiles
Forums
Events
Everything posted by Viking
-
I look at this topic in two general ways: There is the stuff (hidden value) we (generally) know about, like excess of FV over CV. Or BIAL. This will get monetized over time, but when it happens I wouldn't characterize it as "pulling a rabbit out of their hat" And then there is the stuff they do that is a surprise: Pet insurance Resolute: selling at top of lumber market Stelco: selling to Cleveland-Cliffs at a nosebleed high valuation (right before Trump imposed tariffs) These are usually example of Fairfax being very opportunistic - and the size of the gain surprises all of us. That is what I usually characterize as "pulling a rabbit out of their hat." Sometimes there is a combination of the two: we know hidden value is there... but what Fairfax actually gets is much more than we expected. Anyways, it is an important topic - because it is an important part of Fairfax's business model and results.
-
A question we should probably start to think about is if Fairfax is successful with a purchase of IDBI bank, where do they get the money from? The total purchase price is estimated to be ~$8B. Of course, they will likely have partners so they will not need to come up with the total amount. The Eurlife sale looks like it might close in April (Eurobank is baking in 8 months from Eurolife in its 2026 guidance). That will deliver $950M in proceeds (less the investment in P/C business in Cypress). Fairfax just issued C$650M in debt. One angle I am thinking about: Do they sell down any of their large equity holdings to raise some cash? (Not all, but part.) A follow up question is: Do we get a large realized gain with a sale? Eurobank is an obvious choice. Selling 20% of their stake in Eurobank would raise $1B in proceeds. and it would also result in a pretty large realized gain of ~$500 million. But why sell a crown jewel? What about Poseidon? Perhaps they could sell 1/3 of their position in Poseidon for $1B. This would also trigger a sizeable realized gain ($350M)? Another top candidate would be to sell another chunk of Orla. This position has a MV of about $1.6B today. And now that Foran Mining is being taken out by Eldorado Gold, Fairfax might want to reduce their exposure to gold. The key take-away is Fairfax has a lot of really good options at their disposal. And if they decide to do something there is a pretty good chance it will trigger a big realized gain. And they might do a couple of things like this. (Yes, this would drive some analysts crazy.) Bottom line, 2026 is shaping up to be a pretty interesting year for Fairfax. And its shareholders.
-
Fairfax's investment in Eurobank is up +$5B (559%) over the past 5.2 yrs (up $700M YTD). Much of gain (~$2.7B, or ~$125/sh) is not captured (yet) in accounting results. So it is ignored (not reflected in share price). This is a great example of how significant hidden value is building at Fairfax. Eurobank is now ~20% of Fairfax's equity portfolio. But this number is misleading. This uses Eurobank's market value of $5.45B. But if we use carrying value of ~$2.75B (what matters when looking at BVPS), Eurobank is only 10% of Fairfax's equity portfolio. (Can anyone guess why this matters? That is a story for another day.) The more important story is Eurobank is exceptionally well managed and is very well positioned to continue to drive strong results over the next 3 years. Eurobank is exceptionally well managed. And we just got an updated three year plan from the team there. I don't think it a stretch to estimate that Eurobank can deliver a total shareholder return of 15% on average over the next three years (increase in MV + dividend). That is $750 million in value creation for Fairfax (using $5B MV as our base). That looks quite conservative to me. Does it matter where the gain happens? It certainly does to Mr. Market (if it doesn't show up in the accounting results it is ignored). It doesn't matter to me (if much of it shows up in excess of FV over CV). Because at some point, Fairfax will sell some of its stake in Eurobank. But given the current set up, it makes a lot of sense to let the Eurobank position continue to run. Eurobank is a great example of how a significant amount of value is 'quietly' building at Fairfax - hidden from Mr. Market. Hope it continues... Does its size matter? Given it is ~20% of the total equity portfolio is this becoming a reason to sell some? That would be a great problem to have.

-
@dartmonkey, I agree investment gains are a wild card. And, yes, Fairfax’s investments have gotten off to a very good start to the year. I don’t worry about the FFH-TRS position because it is pretty likely Fairfax will prioritize share buybacks at the current price level ($1,700). Using a bottom up approach, my forecast builds to an 8.5% total return on investments for the year, which would be quite good. I think that is a good number to start with. And with Fairfax’s strong start to the year, yes, it does look a little conservative. As of today (intraday), Fairfax's equity holdings are up ~$1.3 billion, with the two biggest drivers: - Eurobank: +$700M - Orla: +575M
-
@djokovic1 , thanks for sharing your thoughts.
-
Eurobank's Q4 and FY 2025 results are out. Another strong year (although I have no idea how Mr. Market will respond to results tomorrow). The management team at Eurobank is stellar. Their strategic vision and execution has been very strong over the past 5 years. We are now seeing their plan coming together: "A Three-Markets, Three Business-Lines Financial Group (see first slide below) The company also provided their 3 year strategic plan - it looks very good. And these guys have a long history of sandbagging their forecasts (they usually beat) - one of the many reasons I like them so much. See slide 2 below. The presentation is so well laid out - it makes if very easy to understand where the company is today and where it plans to go in the future. See link below. Eurobank is going to be continuing to returning an enormous and growing amount of money to Fairfax in the coming years (dividends). https://www.eurobank.gr/en/group/investor-relations/presentations
-
@Phoenix01, there are lots of different ways to build a forecast. In the beginning (start of each year), my goal is to try and come up with a ‘midpoint’ for each line item. What I would call a ‘normalized’ number for that year based on what we know today. That is what I have done for 2026 and 2027. As the year progresses, actuals will form part of the 2026 forecast. The normalized number for 2027 will get fine tuned. One time items will start to take the forecast off a ‘normalized’ number for 2026. Of course, the wild card is when big one-time events happen. We will get a really bad cat year one of these years. When that happens, it doesn’t mean my forecast was wrong (at least it doesn’t to me). Because I wasn't trying to build a forecast for a really bad year. Same with investment gains. We are going to get a really big one - one of these years. This is going to spike earnings. Anyways, my goal is to be transparent with the build so board members can then adjust as they see fit - make it more conservative or more aggressive.
-
Eurobank has become the 800 pound gorilla of Fairfax’s collection of equity holdings. Eurobank releases results tomorrow (Feb 26). I think they may also be providing an update to their strategic plan (2026 to 2028). Bank of America names Eurobank as top pick. “Greek banks are set to unveil their fourth-quarter 2025 results starting Feb. 26, with announcements spanning two days. Piraeus Bank and Eurobank will report on the 26th, followed by Alpha Bank and the National Bank of Greece on the 27th. “According to Bank of America, following a strong re-rating in Jan. and a partial correction in Feb.—leaving the sector up 9.5% year-to-date—market attention is shifting to two key drivers: potential upgrades in earnings per share (EPS) through updated business plans, and enhanced shareholder capital returns, supported by improved capital quality. “Finally, Eurobank is identified as Bank of America’s top pick for 2026, driven by three key catalysts: the potential upgrade of Greece to a developed market, Bulgaria’s entry into the eurozone, and Cyprus joining the Schengen area.” https://www.tovima.com/finance/bofa-highlights-greek-banks-strong-eps-capital-returns-before-q4/
-
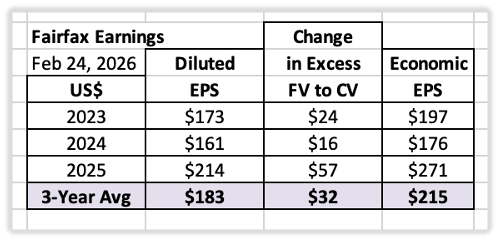
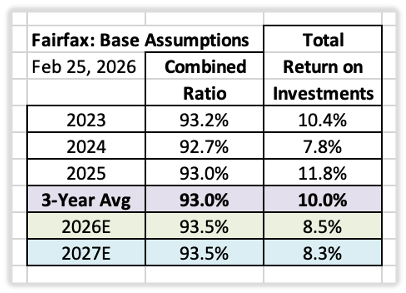
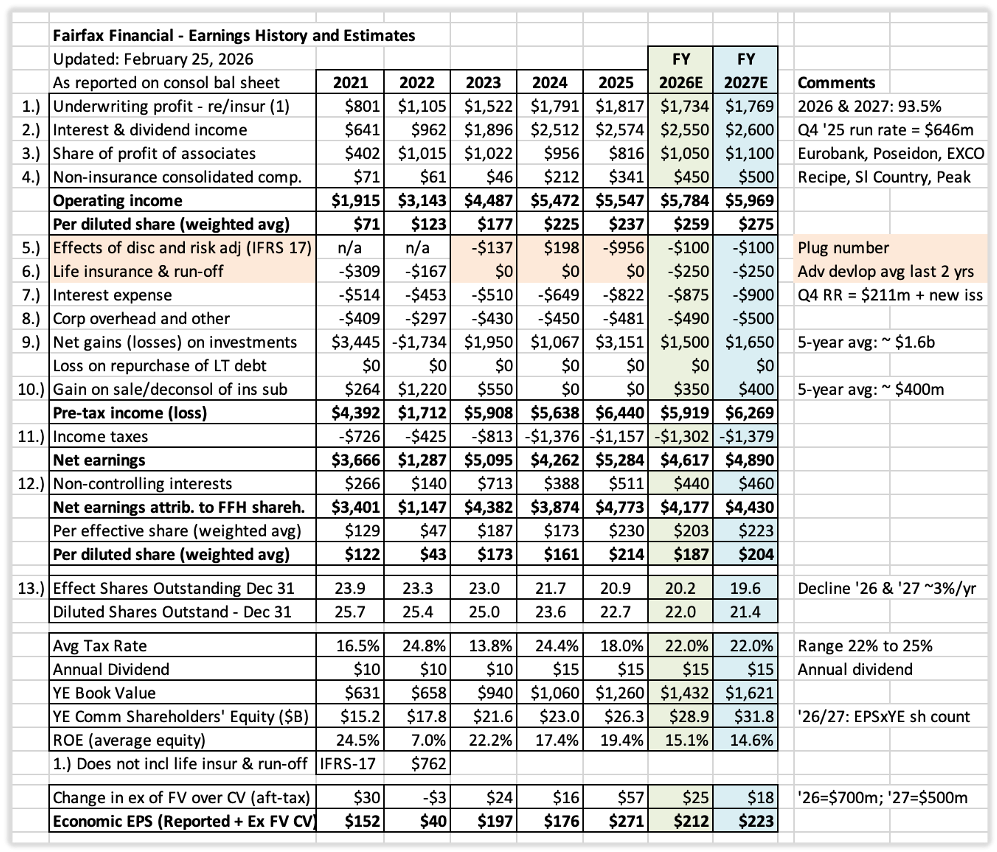
Earnings Estimate Summary for 2026 and 2027 - Part2 This post updates my 2026 forecast and introduces an initial 2027 estimate for Fairfax. The projections incorporate insights from the Q4 interim report and material developments over recent months. At the beginning of 2025, my EPS estimate for Fairfax was $152 per share. Actual diluted EPS came in at $214. For several years now, I have underestimated Fairfax’s earnings power. That pattern continued in 2025. The central question is whether the higher earnings base established since 2021 is durable. I believe it is. Executive Summary Looked at through the lens of earnings power, Fairfax appears positioned to continue delivering strong results. 2026 Outlook Diluted EPS: ~$187 Excess of Fair Value over Carrying Value (FV–CV): +$25/share (after tax) Economic EPS: ~$212 2027 Outlook Diluted EPS: ~$204 Excess of FV–CV: +$18/share (after tax) Economic EPS: ~$223 Street Estimates (as of February 25, 2026) Sell-side forecasts for diluted EPS forecasts: 2026: $184 2027: $183 It should be noted, these numbers exclude FV–CV value creation. Analysts understand Fairfax much better than they did three or four years ago. However, they still struggle with Fairfax’s equity holdings and capital allocation and its impact on future results – their forecast for 2027 appears overly pessimistic. Normalized Earnings Power From 2023 through 2025: Average diluted EPS: $183 Average FV–CV gains: $32/share Normalized economic EPS: ~$215 These figures likely represent a reasonable baseline for future modelling. Valuation Snapshot With Fairfax shares trading currently near $1,700: P/BV: 1.35 ($1,700 / $1260 BVPS) PE (economic EPS): ~7.9x ($1,700 / $215) For a business with Fairfax’s earnings durability, decentralized operating model, and demonstrated capital allocation skill, this valuation appears inexpensive. Forecast Framework Fairfax’s earnings have three fundamental drivers: Underwriting profit – How good is the P/C insurance business? Total return on the investment portfolio – How good is the team at Hamblin Watsa? Capital allocation – How good is senior management? High-Level Assumptions Over the past 3 years, Fairfax has delivered an average: Combine ratio (CR): 93.0% Total return on investments: 10.0% 2026 Assumptions CR: 93.5% Total return on investments: 8.5% 2027 Assumptions CR: 93.5% Total return on investments: 8.3% Total return includes annual changes in excess of fair value over carrying value for non-insurance associate and consolidated holdings. Six-Year Snapshot of Operating Earnings: The Transformation Since 2021 The chart below clearly communicates the dramatic transformation that has happened with earnings, beginning in 2021. Importantly, the increase has been driven primarily by operating income: 2021: $1.9B, or $71 per share 2025: $5.5B, or $237 per share (+234% vs 2021) 2026E: $5.8B, or $259 per share (+9% YoY) 2027E: $6.0B, or $275 per share (+6% YoY) The key point: earnings growth has been driven primarily by operating income — not one-time gains. Even as the hard market moderates, the earnings base appears durable. Detailed Assumptions for Each Line-Item in Forecast for 2026 (Preliminary; will be refined upon release of the 2025 Annual Report.) 1. Underwriting Profit Estimate: $1.73B Net premiums written growth of ~2% (moderating hard market) Combined ratio: 93.5% Average catastrophe year Continued reserve releases (following strong 2025 trend) 2. Interest and Dividend Income Estimate: $2.55B Q4 2025 run rate: $646M Tailwinds: Growth in fixed-income portfolio: $50B → $52B Expansion of mortgage loan portfolio via Kennedy Wilson Headwind: Moderation in short-term rates Yield Assumption: ~4.9% (vs ~5.0% in 2025) 3. Share of Profit of Associates Estimate: $1.05B Eurobank, Poseidon steady Improved performance from EXCO Resources (US natural gas producer) Sanmar Chemicals shifting from headwind to a tailwind 4. Non-Insurance Consolidated Operations Estimate: $450M Key contributors: Recipe, Sleep Country, Peak Achievement, AGT Food & Indredients This earnings stream is breaking out and looks positioned for meaningful growth. When building the initial forecast, separate numbers are input for 5. IFRS 17 and 6. Life Insurance/Run-Off. For quarterly actuals, these two items are combined. Fairfax does not provide these separately, but we can back into them (as a total) based on other disclosed data. 5. IFRS 17: Discounting and Risk Adjustment Two variables drive this bucket: Net written premium growth: ~2% Trend in interest rates: assumes stable interest rates (December 31, 2025 levels) This category remains difficult to model; confidence in the estimate is low. 6. Life Insurance and Run-Off Expected adverse reserve development for run-off: ~$250 million, roughly the average of the past 2 years Sale of Eurolife’s life insurance business in Greece is expected to close in Q2 ~$950M proceeds; use of proceeds TBD Models will be updated post-closing. 7. Interest Expense Estimate: $875M Based on Q4 2025 run rate ($211M) plus expected issuance. 8. Corporate Overhead and Other Estimate: $490M Modest increase vs 2025 ($480M) 9. Net Gains on Investments Estimate: $1.5B Drivers: Mark-to-market gains (FFH-TRS, Orla Mining, others). Realized gains from asset sales A major revaluation event is not built into the base case. As hidden value continues to grow, these become more likely – we just don’t know the timing. 10. Gain on Sale / Deconsolidation of Insurance Subsidiaries This this bucket captures large asset sales, usually insurance. Over the past five years, large one-time gains from asset sales/revaluations have averaged about $400 million per year. Estimate: $350M Reflects expected gain from Eurolife transaction (expected Q2 close) 11. Income Taxes Estimate: ~22% Up from 18% in 2025 Guided range (Q4 call): 22% to 25% Investment gains, taxed at lower rates, are expected to be an important driver of earnings 12. Non-Controlling Interests Estimate: $440M (~9.5% of net earnings, similar to 2025) Potential Allied World minority buyout not yet modeled. 13. Effective Shares Outstanding Estimate: 20.2M Assumes share reduction in 2026: ~650,000, or 3.1% 2025YE: 20.9M (down ~812,000, or 3.7% YoY) Additional Notes: Underwriting profit includes insurance and reinsurance (excludes life/run-off) Interest and dividend income and share of profit of associates includes insurance, reinsurance, and life/run-off
-
Earnings Estimate Summary for 2026 and 2027 - Part 1 I look forward to hearing from other board members. Please share your thoughts. That is how we all learn and improve. Introduction “What possible assurance do you have that (a stock you own) will go up in price? And if you are buying, how much should you pay? What you’re asking here is what makes a company valuable, and why it will be more valuable tomorrow than it is today. There are many theories, but to me, it always comes down to earnings and assets. Especially earnings.” Peter Lynch - One Up on Wall Street Estimating the earnings power of a company like Fairfax is far from simple. Fairfax is a non-traditional property and casualty (P/C) insurer with significant equity holdings. It under-earned for much of the past decade, and over the last five years has undergone a significant internal transformation. For investors, this means that historical financials—especially pre-2021—are often distorted and difficult to use as a guide. That is now changing. The turnaround in operating earnings that began in 2021 gathered momentum through 2022, 2023, and 2024. With 2025 results in hand, investors now have five years of cleaner, more representative data—information that better reflects Fairfax’s true fundamentals. The historical record is finally becoming a reliable input for forecasting. Yet the challenge remains: no standard, “off-the-shelf” model exists for a company as unique as Fairfax. That complexity, however, creates opportunity for investors prepared to put in the time and do the work. To address this gap, we constructed our own model to estimate Fairfax’s future earnings. The remainder of this article outlines that model and the logic behind it. The Structure of the Earnings Model Fairfax’s reported earnings are driven by five distinct income streams: Underwriting profit Interest and dividend income Share of profit of associates Non-insurance consolidated companies Net gains on investments (realized and unrealized) If we can forecast each of these reasonably well, the overall earnings estimate should be reasonably accurate. Later sections of this chapter walk through each income stream in turn. Capital Allocation – Reinvestment Perhaps the most difficult part of forecasting is anticipating how Fairfax will reinvest the substantial earnings it is now generating (roughly $4.5 billion per year). Fairfax has lots of good options and what they decide will determine which of the five income streams grow the fastest. Because we cannot predict management’s precise actions, our model must make educated assumptions about which streams benefit and by how much. As new information arrives each quarter, we update these assumptions. Looking at the last five years, the management team at Fairfax has done an outstanding job with capital allocation. My guess is they will continue to make good decisions (on balance) and this will benefit shareholders in the coming years – likely providing a tailwind to my forecasted numbers. Forecasting Methodology Our forecasting process follows a consistent sequence: Begin with historical results. We maintain detailed data going back to 2016. Adjust for both “old news” and “new news.” Internal developments - reported results, acquisitions and divestitures, management commentary, and updates from major equity holdings. External developments – P/C insurance pricing cycle, catastrophe activity, interest-rate trends, and broader economic conditions. Layer in additional assumptions where necessary. Each section of this chapter provides enough transparency for readers to understand the reasoning behind each forecast—making it easy to adjust assumptions if desired. Forecasting Time Horizon Our goal is to be as fact-based as possible. For this reason, our forecasts typically extend no more than two years: Current-year forecast (2026): An estimate of where actual earnings will land. Next-year forecast (2027): An estimate of “normalized” earnings—what Fairfax should earn in an average or typical year. Why not forecast 2028, 2029, and beyond? Because there are simply too many variables: catastrophe size and frequency, capital-allocation decisions, equity-market performance, the path of interest-rates, and the direction of the P/C pricing cycle. Attempting to build detailed multi-year forecasts introduces false precision. This does not mean I am bearish about Fairfax’s long-term prospects. Quite the opposite. I believe the company can deliver a mid-teens (or higher) ROE over the next five years, which implies strong earnings growth into 2028, 2029, 2030, and beyond. I do not need to know the exact mix of drivers today to have confidence in that outcome. For long-range estimates, the quality of the management team is arguably the most important factor—especially in P/C insurance. Fairfax’s execution over the past five years has been best-in-class among peers. That track record meaningfully raises the probability that Fairfax will continue to deliver in year three and beyond, even though we cannot yet know the exact details. The Dynamic Nature of Forecasting Forecasts become outdated as soon as they are published. This is because as time passes, we get new and betterinformation which causes earnings estimates to change – sometimes materially. As a result, our forecasts are updated frequently, usually every quarter. Is Forecasting a Good Use of Time? For me, forecasting is extremely valuable—but not because of the precise diluted EPS figure the model spits out at the end. The real value lies in the research and reasoning required to construct the forecast. When results differ from expectations, the gap becomes a prompt for investigation. Why was I wrong? Does the thesis need revision? Forecasting, in short, is a tool for deepening understanding. Better understanding improves decision-making, which improves investment outcomes. Accounting Results Versus Economic Results “…managers and investors alike must understand that accounting numbers are the beginning, not the end, of business valuation.” Warren Buffett – Berkshire Hathaway 1982AR Our model is an accounting model: it calculates earnings per share and book value. But shareholders ultimately care about economic value—what is happening to Fairfax’s intrinsic business value and earning power over time. This distinction is crucial because accounting results do not capture all the value creation that is happening at Fairfax - EPS and BV have been under-reporting the increase in business value, and in recent years the gap has been growing. One example is excess of fair value over carrying value of Fairfax’s non-insurance associates and consolidated holdings. As of December 31, 2025, this totaled $3.1 billion, or roughly $140 per diluted share (pre-tax). This is real value that has been created that has not yet appeared in reported results like EPS and BV. This is just one example of hidden value that is residing within Fairfax. Over the past five years, Fairfax’s economic results have consistently exceeded its accounting results. Investors need to recognize this gap when assessing management’s performance and valuing the company. Understanding Annual Volatility “Because our year-to-year results are inherently volatile, we believe a five-year rolling average to be appropriate for judging the historical record.” Warren Buffett – Berkshire Hathaway 1984AR Annual results are important. However, because of their business model, annual results for companies like Fairfax and Berkshire Hathaway will be volatile. This is the case for two very different reasons: P/C insurance results are volatile, due to catastrophes. Investment results are volatile, due to fluctuations in financial markets. Some years the fluctuations in reported results will be large. As a result, it makes sense for investors to use a rolling average of a couple of years when evaluating the performance of a company like Fairfax. Part 2 continues below
-
This is a good reminder for me: as Fairfax grows shareholders’ equity, they also grow debt. This needs to be kept in mind when modelling the size of the investment portfolio, total return and how much the various income streams will grow each year. Higher interest expense. But much higher average return (currently +8%). And with operating income at about $5.6B they have very good interest coverage.
-
Let’s hope George is right… he likes gold, materials, oil.
-
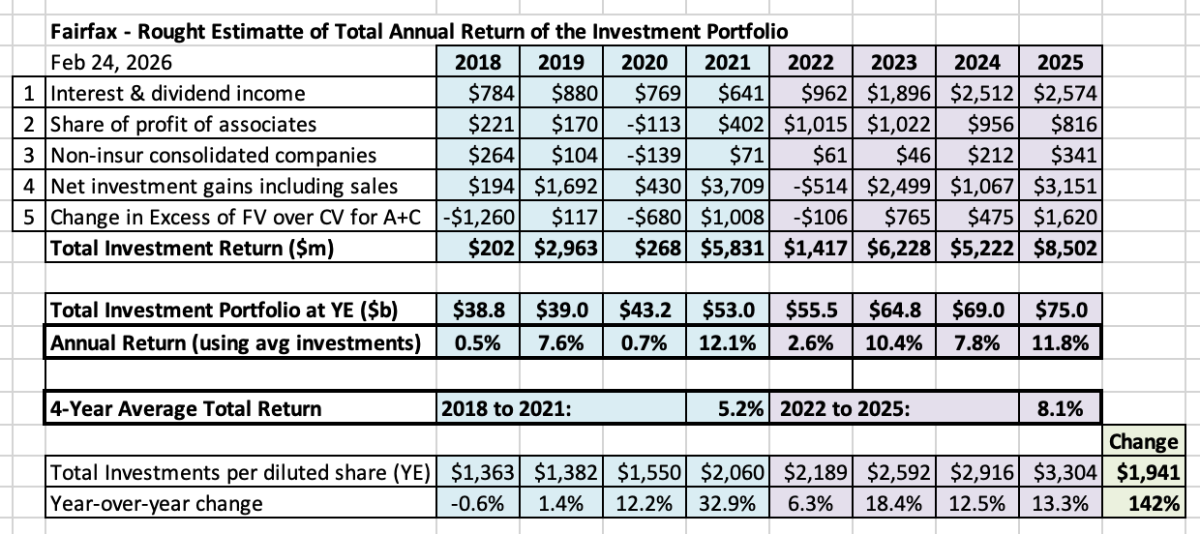
With annual results out we can begin to evaluate how management at Fairfax performed in 2025. When it comes to investment management part of the business, the company had an exceptional year: Total return: $8.5B, or ~11.8% 4-year average return (2022 to 2025): 8.1% Total portfolio: ~$75B, growth of + 8.7% Investments per share: ~$3,304, growth of 13.3%. Fairfax delivered an outstanding total return in 2025 of 11.8%. This is a conservative estimate. It includes excess of FV over CV for non-insurance associate and consolidated holdings. But it does not include other forms of hidden value. The 4-year average of 8.1% is very strong. It should be noted that this includes 2022, which saw a bear market in stocks and a historic bear market in bonds. The total investment portfolio is ~$75 billion, an increase of 8.7%. Total investments per share is ~$3,304, an increase of 13.3% (up 142% over the past 7 years). Importantly, net premiums written increased 3.9% in 2025. Fairfax saw very strong growth in its investment portfolio despite slowing top-line growth in its P/C insurance business. The growth was especially strong per share. Looking forward, 8% looks like a good rate of return to use for investments when building 2026 and 2027 forecasts.
-
Fairfax’s 2024AR has ownership stake in Poseidon at 43%.
-
What is Fairfax’s Secret Sauce? Does it Have a Moat? - Part 2 3. Organizational Structure: Centralized Capital Allocation, Decentralized Operations Fairfax operates with: A Lean Head Office Handles capital allocation and succession planning Low overhead Of note, Prem’s annual salary of C$600,000 (with no stock options) is crazy low. Decentralized Operations Insurance subsidiaries are run by their own presidents Non-insurance companies are run by their CEOs Adapted to their own circumstances, Fairfax has built an organizational structure that is similar to the one used by Berkshire Hathaway. It is very entrepreneurial. With excess capital going to the best available opportunity across the entire company. Insurance – Think and Act Like an Owner Below are comments from Prem’s letter from Fairfax’s 2024AR. “We have over 250 profit centres across our group. Each profit centre is focused on a unique set of customers, geographies or products that benefit from market leadership, product knowledge and the ability to provide excellent customer service. These profit centres facilitate transparency, enabling Andy Barnard, Brian Young and Peter Clarke to effectively monitor the insurance operations. Empowerment thrives at Fairfax. We are always working on making our companies more indispensable to our customers.” Prem Watsa – Fairfax 2024AR The two slides below summarize Fairfax’s structure and the benefits of its decentralized operating structure. 4. The Insurance Engine: Low-Cost, Growing Float What is P/C insurance float? Float is the money (premiums) that has been collected that has not been paid out in claims. Float is technically a liability. So, it is leverage – it is a way for a company to boost returns for shareholders. Warren Buffett has said repeatedly that P/C insurance (float) is the engine that fuelled Berkshire Hathaway’s incredible growth in the 1980’s and 1990’s. Size At year-end 2024, Fairfax had float of $36.9 billion. For perspective, common shareholders’ equity was $22.96 billion. Float is much larger than shareholders’ equity (1.6 x the size). Cost The cost of float is determined by the combined ratio (CR). A CR of 100% means the cost of float is at breakeven – it has no cost. A CR of 105% means the float has a cost of about 5%. A CR of 95% means the float has a benefit of about 5% (negative-cost). Over the past 5 years, Fairfax’s average CR has been 96%. Their “cost” of float has been an average benefit of 4.0% per year (they have been paid 4% per year to hold their float). Yes, that is crazy. Growth Float per share has grown at a CAGR of 18% over the past 39 years. Of course, growth will not continue at this rate. But float should grow at an above average rate in the coming years. Rate of Return Fairfax is able to invest its float and keep the return they generate. In 2024, Fairfax generated a total return on its investment portfolio of about 7.8%. It is tracking to earn about 10.5% in 2025. Moving forward, a reasonable “normalized” estimate is probably 8%. Summary Fairfax has a very large, low cost (negative) and growing pile of money (float) that is also generating a return of about 8% from. Yes, Warren Buffett is a very smart guy. (So is Fairfax.) The slide below summarizes the importance of float. 5. The Investment Engine: Unconstrained Capital Allocation Most insurance companies invest almost entirely in bonds. That keeps volatility low—but returns low as well. Fairfax is much more open minded with how it invests. Over the past 39 years, they have built out a diverse set of internal capabilities and external partnerships which allows them to capitalize on a vast array of opportunities: Credit (public and private) Equities (public and private) Private companies Venture capital (startups) Distressed opportunities Special situations Global reach That flexibility is unusual. It requires the freedom to accept short-term volatility in exchange for long-term gain. Fairfax has that freedom. And it uses it. Compared to peers, this approach allows the company to earn a higher return on its investment portfolio. Compounding and time magnify the benefit. This is a structural advantage for Fairfax. The slide below provides an overview of the investment team at Fairfax – note the long-tenure of most of the people. 6. Culture – The Invisible Hand That Guides – The Straw That Stirs the Drink ‘Culture eats strategy for breakfast.’ Peter Drucker What does this mean? “…no matter how great your business strategy is, your plan will fail without a company culture that encourages people to implement it.” Corporate Governance Institute For successful organizations culture and strategy are two sides of the same coin - they are aligned with each other. Fairfax has a very strong culture. And it is aligned with its strategy. It has been carefully honed over the past 39 years. It has been forged in the fires of adversity. Its biggest champion has been Prem. A couple of examples: Insurance: What to do in a soft market? Write less business. Even at the expense of short-term results (lower top line). Even if it persists for years. Zenith is a good example of this today. Investments: What to do when volatility hits? Do the opposite of what Mr. Market is likely doing. Don’t panic. Look for bargains. Get creative. Exploit the situation. In recent years, Fairfax is littered with great examples of doing exactly this. The fact that Fairfax has had very little turnover suggests that its culture is aligned with the values/beliefs of its employees. Conclusion: Fairfax’s Moat—A Company Built to Endure Fairfax’s extraordinary 39-year record—18.7% annual growth in BVPS and 19.2% annual growth in share price—is the product of a system built deliberately, refined continuously, and reinforced through multiple decades of disciplined execution. Fairfax’s “secret sauce” is made from the following six ingredients: 1. Founder-Led Company – Prem Watsa 2. Family Control Enables Long-Term Focus 3. Organizational Structure: Centralized Capital Allocation, Decentralized Operations 4. P/C Insurance Model – Low-Cost, Growing Float 5. Investment Management – Unconstrained Capital Allocation 6. Culture – The Invisible Hand That Guides – The Straw That Stirs the Drink The real genius of Fairfax lies not in any single advantage, but in how these advantages interlock. Over decades, the company has refined each component and woven them into a moat that is both deep and wide—one that protects the company and compounds its strength over time. Importantly, Fairfax continues to improve – the moat is growing in size. This can be seen in the exceptional results the company has delivered over the past 5 years. And its prospects have never looked better. Fairfax today is stronger, more focused, and more resilient than ever. Its competitive advantages are deepening, not narrowing. And that is why it will be exceedingly difficult for any competitor to replicate what Fairfax has built.
-
@73 Reds, here is a post on moat that might help... What is Fairfax’s Secret Sauce? Does it Have a Moat? - Part 1 December 10, 2025 Fairfax has compounded book value per share (BVPS) at 18.7% annually for 39 years. Its share price has compounded at 19.2% (in US$, including dividends). Importantly, Fairfax’s results over the past four years have also been excellent. It is not a statistical anomaly or a relic of the distant past. Relative to all U.S.-listed companies since 1985, Fairfax’s compound return places it in the top 1%. According to Fairfax, the numeric ranking is #8—a remarkable fact by any standard. Bottom line, Fairfax’s performance over the past 39 years has been epic. All slides referenced are from Prem Watsa’s AGM presentation on April 10, 2025: https://www.fairfax.ca/wp-content/uploads/2025/04/Fairfax_AGM_2025.pdf This track record raises 3 important questions: What drove Fairfax’s exceptional performance over 39 years? Are the drivers still in place today? What does this imply for Fairfax’s future performance? Let’s start with question one. What Caused Fairfax’s Long-Term Outperformance? Was it skill? Luck? Being in the right place at the right time? Timeframe is the key to answering this question. If Fairfax’s strong performance had happened over a short time period (like 5 or 10 years) then perhaps we could attribute it primarily to luck. But a CAGR of more than 19% for 39 years? That level of outperformance over that timeframe can’t be attributed to luck. The timeframe is too long. Does Fairfax have a moat? (A moat refers to sustainable competitive advantages that a company has that allows it to ward off the competition while continuing to grow its business and profitability over time.) Most investors would quickly answer “no.” Why? Well, when it comes to Fairfax most everyone knows 2 things: Insurance is a commodity. And Fairfax is not very good at insurance. Average at best. And Fairfax is not very good at investments. They keep messing up. ‘Cowboys’ might be a good way to describe them. But if it’s not luck and it’s not skill, how did Fairfax produce one of the best compounding records in the world? I think Mark Twain might have the answer: “It ain’t what you don’t know that gets you into trouble. It’s what you know for sure that just ain’t so.” Mark Twain The obvious answer is that Fairfax does indeed have a number of competitive advantages. And like the pieces of a puzzle, when put together these competitive advantages provide investors with a picture of Fairfax’s moat. Importantly, in recent years, Fairfax’s competitive advantages have been getting stronger – the moat has been growing deeper and wider. The fact that most investors don’t know what Fairfax’s competitive advantages are doesn’t mean they don’t exist. Instead, it provides great insight into how misunderstood Fairfax continues to be. And if the company is this misunderstood, do you think it is fairly valued? No, probably not. So, as painful as this might be for some, let’s explore this further. The Six Ingredients of Fairfax’s “Secret Sauce” I group them into six categories: 1. Founder-Led Company – Prem Watsa 2. Family Control Enables Long-Term Focus 3. Organizational Structure: Centralized Capital Allocation, Decentralized Operations 4. P/C Insurance Model – Low-Cost, Growing Float 5. Investment Management – Unconstrained Capital Allocation 6. Culture – The Invisible Hand That Guides – The Straw That Stirs the Drink 1. Founder-Led Leadership: Prem Watsa Prem founded Fairfax in 1985 and has led it ever since. From scratch, he has built Fairfax into. One of Canada’s largest and most profitable public companies. A giant global insurance company. It really is a remarkable achievement. Importantly, he is still at the helm, guiding the company. He is (still) an exceptional leader. This was on full display during Covid. He is high integrity – with both internal and external stakeholders. What are his greatest strengths? I see two: The ability to attract and retain talent (at both insurance and investment operations). That was true 39 years ago when he started the company. It is equally true today. And temperament – the ability to think clearly when others are losing their heads. This is especially valuable with the investment management side of the business (and being able to exploit volatility). His age (75) is a concern (he was born in August of 1950). However, his health (physical and mental) appears very good. Prem is a competitive advantage for Fairfax. Yes, Prem’s health is something to monitor. But it is not something I worry about today. Importantly, Prem has started to transfer some responsibilities to the next generation of leaders. Fairfax takes succession planning very seriously – the company has a deep bench of talent. 2. Family Control Enables Long-Term Thinking Prem owns/controls ~2 million shares (9.5% economic interest) and exercises control over ~43.3% of the company through multiple-voting shares. Bottom line, Prem is firmly in control of Fairfax. What about when Prem is no longer around? Prem’s control position will pass to the Watsa family, with instructions that it not be sold. Prem’s son Ben will become Chairman. This provides certainty for Fairfax and its shareholders – Fairfax will remain a family-controlled business after Prem has passed. This is important for reasons we will explore next. Comments from Prem about family control from Fairfax’s 2024AR. “As I said last year, Fairfax is being built to last for the next 100 years, long after I have gone. For the last 39 years, I have mentioned to you many times that you have a major negative; Fairfax is not for sale at any price! So there will be no takeover bonanza! I consider myself and my family as stewards not owners. So I have set up my affairs so that my control position will not be sold even after I pass, but will remain with my family and not be sold. Fairfax will also be professionally run, with succession always being internal! My son, Ben, will become Chairman after me.” Prem Watsa – Fairfax 2024AR Why does this matter? Because long-term control drives long term behavior. Insurance: allows for the optimal management of the insurance cycle. Importantly, it supports the discipline to walk away from unprofitable business in a soft market (that might last for years). Investments: allows for the investment in assets that will deliver the highest total return over the long term (like equities) – despite the higher volatility this will cause in the short term. This provides Fairfax with a structural return advantage with its investment portfolio when compared to traditional P/C insurers who invest primarily in bonds. Volatility: allows Fairfax to be opportunistic with both insurance and investments – to accept, ride out and exploit short term volatility – which enhances returns over time. Being family controlled allows Fairfax to be laser focussed on building per share value for shareholders over the long term. This is an enormous structural advantage. Keep reading for Part 2
-
A Review of Fairfax’s Annual Results: 2025 - Part 2 5. Investment Gains: Expanding Contribution Total: $3.15B (vs $1,067.2B in 2024) Breakdown: Equities: $3.05B Common stock gains: $1.49B FFH-TRS: $840.6M Bonds: $385.4M, primarily US treasuries Other (currency): ($284.1M) Fairfax now holds approximately $26B in equities. Important dynamic: Equity portfolio is growing Hidden value (FV over CV) is expanding Monetization opportunities are increasing Example: Sale of Eurolife to Eurobank (~$350M pre-tax gain expected Q2 2026) Key point: Investment gains are becoming a more meaningful contributor to overall earnings power. FFH – Total Return Swaps Fairfax continues to have exposure to 1.76M Fairfax shares. Here is what Peter Clarke (President and COO) had to say on the Q4-2025 conference call: “On the Fairfax TRS, we’ve always said that that’s an investment. We continue to believe it’s a very good investment, so it we continue to hold that.” 6. Hidden Value: The Underappreciated Income Stream Fairfax’s equity holdings have had an outstanding year in 2025. A large portion of the increase in value did not show up in the accounting results, with excess of FV over CV for non-insurance associate and consolidated holdings being the best example: Total: $3.1B (vs $1.5B in 2024) Increase of $1.6B (~$57 after-tax per share) Eurobank — Fairfax’s largest equity holding — delivered an 82% TSR in 2025. Much of that appreciation has not flowed through accounting earnings. Hidden value will be an increasingly important source of investment gains in the future as they get monetized by Fairfax. Capital Structure Optimization Redeemed $876.5M preferred shares for $689.4M $187M gain Replaced non-deductible preferred capital with tax-deductible senior notes Debt-to-total-capital (ex-insurance subs): 26.2% (vs 24.8% in 2024) With operating earnings > $5B, coverage remains strong. Rational, value-enhancing capital structure management. Share Repurchases: Compounding Per Share Metrics 2025: 1.0M shares repurchased for $1.6B ($1,616 per share) ~3.7% reduction in effective shares outstanding to 20.86M (vs 21.67M in 2024) 2026 Q1: 130,573 shares repurchased for $220M ($1,685 per share) ~ 0.6% reduction in effective shares outstanding: 20.726M Over eight years, shares outstanding have been reduced by 25% (from 27.75M to 20.86M). Shares were purchase at very attractive prices, delivering outstanding value to long term shareholders. Repurchases continue at prices that appear materially below intrinsic value. Per-share metrics — NPW, float, EPS, BVPS — are compounding much faster than total figures. This matters. The Structural Difference Fairfax has spent 40 years building a broader capital allocation platform. Insurance remains foundational, but it is not the sole driver of compounding. The pending take-private of Kennedy-Wilson illustrates this evolution. Real estate underwriting expertise is now brought in-house. The platform continues to expand. As the hard market slows, Fairfax can shift capital from insurance to non-insurance opportunities where it will continue to compound at above average rates of return. Yes, the growth of underwriting income will slow. But other income streams will grow more quickly. Total earnings should continue to grow nicely. That flexibility is not common among P/C insurers. A Historical Parallel Fairfax today resembles a younger Berkshire Hathaway in the 1980s–1990s: Large float Meaningful investment leverage Multiple income streams Disciplined capital allocation Were there soft markets during that period? Yes — severe ones. Did Berkshire stop compounding? No. The lesson: Underwriting discipline matters more than premium growth Capital allocation matters more than insurance cycles Investors who avoided Berkshire Hathaway due to insurance cycle concerns missed out on being invested in one of the greatest compounding machines in history. What Actually Matters Now As the hard market slows, investors should focus on three questions: Is underwriting disciplined? Is capital being allocated rationally? Are per-share economics improving? Current evidence suggests a strong “yes.” Bottom Line 2025 was an exceptional year. But the investment case is not about peak underwriting. It is about: $39B of float $75B investment portfolio $26B equity exposure Expanding private platforms Growing hidden value Aggressive share repurchases Increasing capital flexibility Fairfax is not a traditional insurer. It is a capital allocation platform built on insurance float. The cycle may be turning. The compounding machine is entering its next phase.
-
A Review of Fairfax’s Annual Results: 2025 - Part 1 “Skate to where the puck is going, not where it has been.” - Wayne Gretzky Introduction: The Market Is Turning The P/C insurance hard market is drawing to a close. For traditional insurers, that means: Softer pricing Margin compression Lower earnings power For Fairfax, it means something different. Fairfax is not a traditional insurer. Analyzing it through that lens leads to flawed conclusions. The key question is: What happens next? Time Horizon Determines Insight Fairfax is managed with a long-term orientation. That is visible in: Underwriting discipline Capital allocation decisions Share repurchases Balance sheet management If management operates on a multi-year horizon, investors must evaluate results the same way. Quarterly results matter. They contain valuable information. But they are fragments of a much larger mosaic that unfolds over years. Obsessing over quarterly results risks missing the forest for the trees — and that mistake is particularly costly with Fairfax. The Multi-Engine Model Most P/C insurers rely on two income streams: Underwriting income Fixed-income investment income When underwriting margins compress, earnings compress. Fairfax has built something broader. It has six income streams - five that flow into reported earnings and a sixth that flows into economic earnings: Reported Earnings Streams Underwriting income Interest and dividend income Share of profit of associates Operating income from non-insurance subsidiaries Investment gains Economic Earnings (Not Reflected in Reported Earnings) Excess of fair value over carrying value (hidden value) Each fluctuates quarter to quarter — and sometimes year to year. There is lots of noise in quarterly results. There is lots of signal in one and two-year results. Of course, Wall Street focusses on the noise (short term results). The key is to not let Wall Street trip you up. What matters is: The multi-year trajectory of each stream How they interact collectively How capital allocation decisions reshape their contribution This flexibility is the structural difference. 2025: Record Year 2025 was the best year in Fairfax’s history. Accounting earnings: $214 per diluted share Economic earnings (conservative): $271 per diluted share Execution has been strong across insurance, investments, and capital allocation — for five consecutive years. Segment Review 1. Insurance: Discipline Over Growth Fairfax delivered record underwriting profit while intentionally moderating growth. NPW growth: +3.9% (vs +11.6% in 2024) Combined Ratio: 93.0% (vs 92.7%) Underwriting profit: $1.82B (vs $1.79B) Additional details: Favourable development: 2.9% ($751.5M) vs 2.6% ($593.6M) in 2024 Catastrophe losses: 4.8% ($1.24B) vs 4.5% ($1.10B) in 2024 Float: $39.3B (up 11.2% from $35.4B) Runoff adverse development: $298.5M (vs $221.1M in 2024) Standout performers: Northbridge 88.7% CR Allied World 89.3% CR Key point: Fairfax produced a record $1.8B of underwriting profit while maintaining discipline into a softening cycle. Float remains the foundation of the model – and Fairfax continues to be paid well to hold it. 2. Interest and Dividend Income: Stability $2.57B (vs $2.51B in 2024) Q4: $645.8M (vs $698.2M in 2024) Importantly, Q4 2024 included a one-time dividend of $112.3M from Digit. Adjusted for this amount, Q4-2025 saw a solid YOY increase. Q3 2025 $655.4M Interest and dividend income did fall slightly quarter over quarter. The fixed income portfolio remains conservatively positioned: 75% government bonds 14% high-quality corporates (short duration) 11% first mortgage loans Average yield ~5% Despite lower short-term rates, this income stream grew due to: Larger invested balances Shift into higher-yielding opportunities (e.g., KW mortgage loans, private investments like Blizzard Vacatia) Key point: Record income achieved without reaching for yield. 3. Share of Profit of Associates: Transitional Dip Total: $815.1M (vs $956.3 in 2024) Q4: $251.8M Decline driven by: Sales of Sigma ($34M impact) and Stelco (18M) Consolidation of Peak Achievement ($57M) Losses at Waterous ($64.7M) and Sanmar ($45M) Major contributors: Eurobank: $474.1 (vs $515) Poseidon: $286.9M (vs $213M) Poseidon delivered exceptional results. A ~$250M quarterly run-rate appears achievable going forward. Key point: The dip to $815 million in 2025 appears transitional, not structural. 4. Non-Insurance Consolidated Companies: Scaling Platform Operating income: $397.4M (vs $241.4M in 2024) Excluding the Boat Rocker write-down ($108.6M), income exceeded $500M Recent acquisitions (Sleep Country, Peak, Meadow Foods) are contributing meaningfully. Key point: This segment is becoming a larger and more stable contributor — further diversifying Fairfax beyond insurance. Continue to next post below for Part 2
-
+1 Another point Bill McMorrow has made before is Pac West was forced to sell its good businesses when it was forced to raise money. The quality aspect is important.
-
@cwericb, I agree. One of the grossly under-appreciated aspects of Fairfax is how shareholder friendly they are. CEO salary (lack of) is one example. There are many more: Ownership of stock (which you also mention) Focus is driving per share value over the long term (not empire building) Disclosure is generally very good (versus what they are required to do), with Prem’s annual letter being the best example Annual meeting: events and Q&A PS: thanks for the trip down memory lane… 2009! How time flies…
-
I agree. When trying to figure out the impact of something on Fairfax (bad cat year in this example) the timeframe used is key. If the timeframe is next quarter, there are lots of ‘risks’. If the timeframe used is the next 2 or 3 years the number of risks shrink dramatically. And some risks in the short term flip to opportunities in the longer term. It is very counterintuitive. Of course, this then layers into whether Fairfax is a speculation (short term hold) or an investment (long term hold).
-
@Maverick47, great overview. Thanks for posting.
-
With the KW purchase, Fairfax is adding another important capability to the company. And they are likely getting it at a low price. They are achieving both core capital allocation objectives: Does it deliver a solid return Does it make the company stronger (strategic considerations) We probably should start to segment the fixed income bucket ($50B): Mortgage loans $5.5B 11% Fixed income $45.5B 89% The mortgage loan bucket (ML) is a completely different animal than the fixed income bucket. For one, ML is much higher return. I think it makes more sense to look at fixed income (yield and average duration) excluding ML. This would drop average yield and also lengthen average maturity. Bottom line, with the KW acquisition I think it makes sense to break out ML as its own income stream. Zero 5 years ago. To about $400 million in 2025 (assuming avg balance of $5B and avg interest rate of 8%, which might be a little high on both measures). Poof! Like magic. A new high yield income stream. Independent of the P/C insurance cycle. As has been happening a lot over the past 5 years, Fairfax has been delivering a master-class in capital allocation. The takeout of Kennedy Wilson is just the latest example. What does the acquisition of KW have to do with the P/C insurance cycle? Nothing. So many analysts will ignore it...
-
@Berk, good question. For EPS, I use change ($1.6B). For BV, I use the total ($3.1B). I think my economic EPS estimate is conservative because it only captures the change excess of FV over CV. And ignores other important areas where hidden value has been growing over the past year.
-
Sometimes it can be helpful to step back and look at the big picture. To keep things in perspective. Fairfax's stock traded below $270 a couple of different times in 2020. In 2025 the company delivered economic EPS (conservatively calculated) of ~$270 ($214 reported + ~$56 excess of FV over CV). What an amazing turnaround. The employees of Fairfax should be proud of what they have accomplished over the past 5 years. (Insurance. Investment management. Head office.) They also deserve a big "thank you" from shareholders. Well done! The best part? I think they are just getting started....