Viking
Member-
Posts
4,922 -
Joined
-
Last visited
-
Days Won
44
Content Type
Profiles
Forums
Events
Everything posted by Viking
-
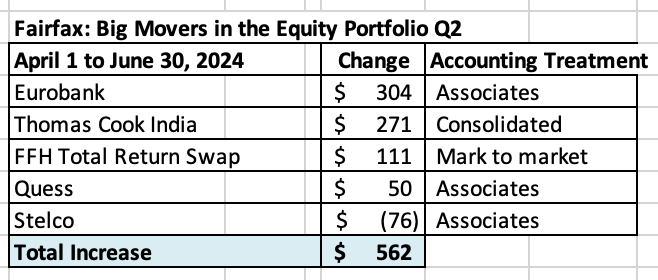
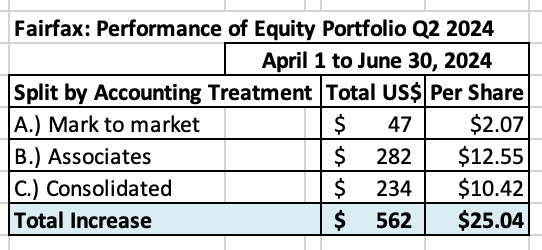
Fairfax’s equity portfolio (that I track) increased in value in Q2 by about $562 million (pre-tax) or 2.9%, which is a solid result. It had a total value of about $20 billion at June 30, 2024. Notes: Like Q1, my numbers for Fairfax India for Q2 will be off. In my spreadsheet I include the change in Fairfax India’s stock price (which declined $33 million in Q2). In Q4, 2023, Fairfax India sold a chunk of IIFL Finance which dropped its ownership position to 15.1%, which flipped the position from an accounting perspective from an Associates holding to a Mark to Market holding. IIFL Finance's stock had a big sell off in Q1 (a headwind) and it has rebounded nicely in Q2 (a tailwind). Bottom line, for Q2, I would expect Fairfax’s mark to market gains to be a little higher than my numbers driven by the increase IIFL Finance. Another wildcard will be Digit. It completed its IPO in Q2. When Fairfax reports Q2 results we should get an update on exactly how much Fairfax owns and how the position is valued (and it there were any changes). Digit is not an equity holding but depending on how the position is valued it may impact the gains (losses) that Fairfax reports. I include the FFH-TRS position in the mark to market bucket and at its notional value. I also include warrants and debentures that Fairfax holds in the mark to market bucket. My tracker portfolio is not an exact match to Fairfax’s actual holdings. It is useful only as a tool to understand the rough change in Fairfax’s equity portfolio (and not the precise change). Split of total holdings by accounting treatment About 48% of Fairfax’s equity holdings are mark to market - and will fluctuate each quarter with changes in equity markets. The other 51% are Associates and Consolidated holdings. Over the past couple of years, the share of the mark to market portfolio has been shrinking. This means Fairfax's quarterly results will be less impacted by volatility in equity markets. Split of total gains by accounting treatment The total change is an increase of about $562 million = $25/share The mark to market change is an increase of $47 million = $2/share. The change in this bucket of holdings will show up in ‘net gains (losses) on investments’ (along with changes in the value of the fixed income portfolio) when Fairfax reports results each quarter. (Note: see my comment on Fairfax India and IIFL Finance earlier in this post). What were the big movers in the equity portfolio Q1-YTD? Eurobank is up $304 million and it is Fairfax’s largest equity holding at $2.7 billion. Thomas Cook India is up $271 million and is now Fairfax’s 4th largest holding at $871 million. The FFH-TRS is up $111 million and is Fairfax’s second largest holding at $2.2 billion. Quess is up $50 million. Market value is $370 million (carrying value is $432 million). Excess of fair value over carrying value (not captured in book value) For Associate and Consolidated holdings, the excess of fair value to carrying value is about $1.677 billion or $75/share (pre-tax). The 'excess' of FV to CV has been materially increasing in recent years. Book value at Fairfax is understated by about this amount. Associates: $891 million = $40/share Consolidated: $786 million = $35/share Equity Tracker Spreadsheet explained: We have separated holdings by accounting treatment: mark to market, associates – equity accounted, consolidated, other Holdings – total return swaps. We come up with the value of each holding by multiplying the share price by the number of shares. Are holdings are tracked in US$, so non-US holdings have their values adjusted for currency. This spreadsheet contains errors. It is updates as new and better information becomes available.
-
No. My TFSA is for buy and hold. My swing trades are only in my RRSP/LIF accounts.
-
@Crip1 As a general rule, i prefer to own Fairfax over Fairfax India. Fairfax continues to be a monster position for me. About 25% of my total portfolio today is for shorter term/tactical trades and/or cash (all in tax free accounts). I was sitting on a fair bit of cash (over 15%) when Fairfax India dropped to $13.80 so i decided to make it a small 3% position. For these types of trades, I only buy positions in companies i am comfortable holding for the long term (because it’s not knowable WHEN the stock might move higher). And i keep my weighting small enough so that i can meaningfully add if the stock continues to sell off (I would have been comfortable taking my Fairfax India position to a 5% weighting - perhaps higher - if it had continued to fall to below $13). Fairfax closed Friday at US$1,090. That is getting close to a price where i might want to add to my position. We are also beginning hurricane season - so it would not surprise me to see the shares of all P/C insurers sell off IF we get a couple of big events. Bottom line, i want to have some cash on hand to take advantage in any temporary weakness that might happen in Fairfax shares. I like to flex my Fairfax position up and down (perhaps by 5% or 10%) depending on what the share price is doing. So given the weakness in Fairfax shares on Friday (dropping to an interesting level) and the opportunity to lock in a 2 week gain of almost 8% in Fairfax India i decided lock in the gain. i have done this with Fairfax India many times over the past 3 years. I love the optionality of having some cash on hand. One other factor was Canfor. The stock closed today at C$14.15. I think that is wicked cheap. I own a little (average price of $14.70). If it falls below $14 i will likely add. I have been in and out of Canfor probably 3 times already this year. Small 4% to 8% gains each time. Stelco is also at an interesting price (C$36.67). Sorry for all the detail. I just wanted to provide some information of a few of the variables that were/are rattling around in my head. It is sometimes a pretty fluid process for me. Lots of different variables at play. I am sure it looks pretty crazy to an outsider (someone not inside my head). But my process has usually worked out pretty well for me.
-
To close the loop, I exited my Fairfax India position today. The stock was up almost 8% in two weeks; not sure what caused the big increase Friday/today but I'll take it. The position was purchased in tax-free accounts (RRSP). I will be happy to re-establish a position should the stock aggressively sell off again.
-
@glider3834 Thanks for posting this. On June 6, 2024, Eurobank announced it had received approval from the ECB to pay a dividend equal to 30% of Net Profit for 2023. The final distribution will be approved at Eurobank’s annual meeting on July 23 2024, with the cash likely to be distributed in August. Fairfax is expected to receive a payment of about $126 million. Because Eurobank is an associate holding the dividend payment will not show up in Fairfax’s reported results in ‘interest and dividend income’ – that bucket is for mark-to-market holdings. Eurobank paying an annual dividend is another new and meaningful income stream for Fairfax. For context, in 2023 Fairfax reported total dividends received (on common and preferred stock) of $134 million. Eurobank’s expected dividend payout almost doubles this amount. This is a watershed moment for both Eurobank and Fairfax. For Eurobank, the dividend payout is the final confirmation their turnaround has been successfully completed. Eurobank’s goal is to increase the payout ratio to 40% in 2025 (Net Profit for 2024) and 50% in 2026 (Net Profit for 2025). For Fairfax, Eurobank is a great example of the significant turnaround that they have been able to execute with their many poorly performing legacy equity holdings from 2014-2017. Hundreds of million is losses every year (write downs, capital infusions etc) from that collection of holdings has now been replaced with hundreds of millions in gains – the ‘swing’ might be as high as $500 million per year. A significant headwind to reported results has now become a significant tailwind. The turnaround at Eurobank the past 3 years has been epic. And now Fairfax is getting paid. It highlights why Fairfax is such a good partner: patient, demanding, loyal, long term. But this doesn’t mean Fairfax is a push-over… Eurobank had to do its part – its management team has executed exceptionally well, especially over the past 5 years. Importantly, Eurobank looks exceptionally well positioned with lots of solid opportunities to continue building shareholder value. Eurobank's Announcement https://www.eurobank.gr/en/group/grafeio-tupou/etairiki-anakoinosi-06-06-24#:~:text=million-,Eurobank announces ECB's approval for €342 million dividend payment,first payout in 16 years&text=Eurobank Ergasias Services and Holdings,or €0.0933 per share.
-
@PJM The attached Excel file has what I have for Fairfax India (FIH tab). It has not been updated for 2 years (2022?)? But it might be better than starting from scratch. The Fairfax India tab shows you Fairfax's increase in ownership over the years. The BIAL tab shows you Fairfax India's increase in ownership over the years. This file also contains my share information for most of Fairfax's equity holdings. Fairfax Charts - Subs.xlsx
-
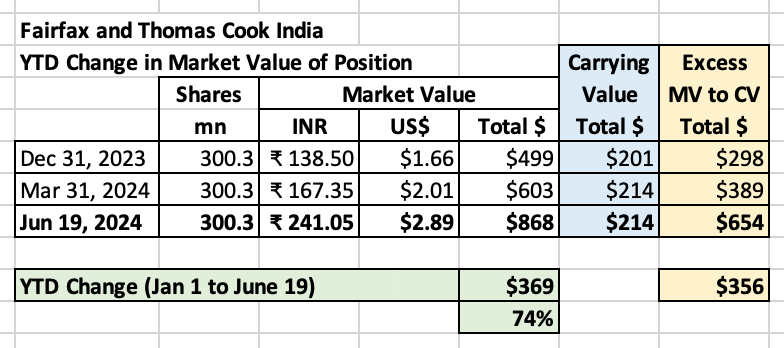
@nwoodman , thanks for the info. I was wondering what was spiking the share price of Thomas Cook India higher. Fairfax's stake in Thomas Cook India now has a market value of $868 million. It is up 74% YTD. TCI is now Fairfax's 5th largest equity holdings (after Eurobank, Poseidon, FFH-TRS and Fairfax India). Excess of market value to carrying value is about $654 million. Fairfax is getting so far offside with this holding (FV is so much higher CV) somebody better let Muddy Waters know because Fairfax is probably doing something terribly wrong with how they are marking this position on their books! Why is Thomas Cook India headed higher? Surpassing CY 2023 domestic travel numbers in the first 6 months of CY 2024. The runway looks very long for this holding. ----------
-
@ranimo When I look at Fairfax, when it comes to capital allocation, I value their track record from 2018 to present MUCH MORE than their track record 2017 and earlier. And the facts are clear - Fairfax's capital allocation since 2018 has been best in class (when compared to P/C insurance peers) and it's not even close. That is 6.5 years and running. Now I do closely monitor what Fairfax is doing. If they do something significant that I don't like - something that materially impacts the fundamentals of the business - then I will do what any rational investor would do: I would likely reduce my exposure. That is the same for every investment I hold. My recent investment in Fairfax India is not complicated: it was because I thought it represented good value. Yes, I also own Fairfax. Am I concerned about my total weighting (Fairfax India and Fairfax)? No.
-
Below is an interesting thread (4 parts) posted by 'bsilly,TLA' on twitter today. I have a thesis that, under Andy Barnard, the quality of Fairfax's P/C insurance business has been slowly, incrementally improving over the past decade. bsilly's thread seems to support that idea. This is not priced into Fairfax's stock today. Just another tailwind. https://twitter.com/bsilly3/status/1801345889262571548 ---------- ----------- ----------- -----------
-
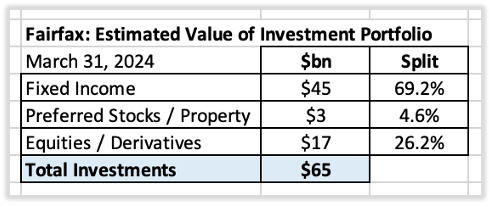
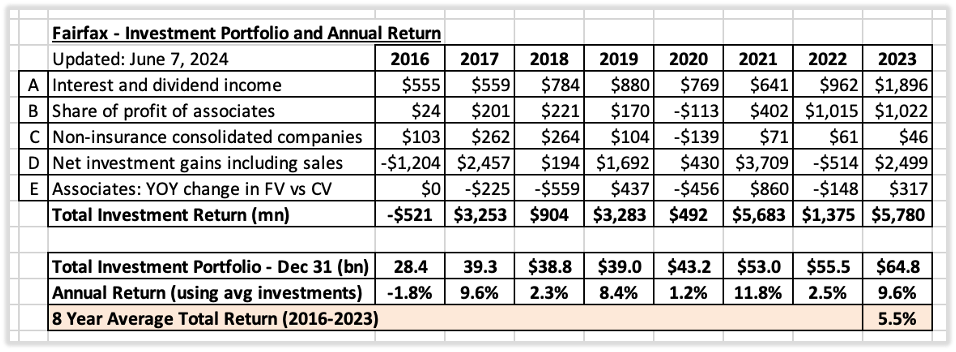
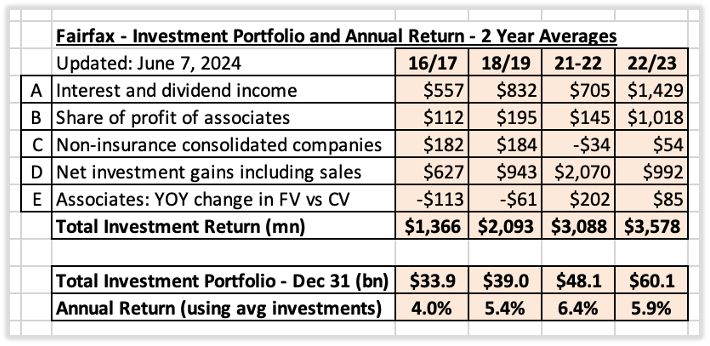
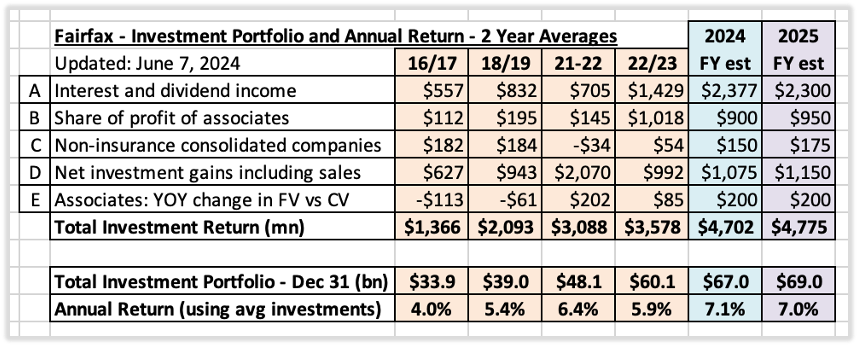
Investment Portfolio: A Review of Returns From 2016-2023 and Estimate for 2024 Two things drive earnings at Fairfax: The underwriting profit it earns on its insurance operations. The return it earns on its investment portfolio. In this post we will review the return Fairfax earns on its investment portfolio – in total dollars and as a percent. We will start by looking at the past (2016-2023). We will then use what we learn as inputs to help us build a forecast for 2024 and 2025. What is the value and composition of Fairfax’s investment portfolio? Fairfax has an investment portfolio with a value of about $65 billion at March 31, 2024. This does not include FFH-total return swap position (with a notional value of about $2.2 billion). Methodology The total investment return for Fairfax can be calculated using the following inputs: Income streams: A. Interest and dividend income Interest income earned from the fixed income portfolio. Dividend income earned the mark to market equity holdings. B. Share of profit of associates Fairfax’s share of pre-tax earnings from Eurobank, Poseidon, EXCO Resources, Stelco and Fairfax India. C. Non-insurance consolidated companies Pre-tax earnings from Recipe, Grivalia Hospitality, Thomas Cook India, AGT Food Ingredients, Dexterra, Sporting Life and Boat Rocker. D. Net gains (losses) on investments Unrealized gains from investment portfolio (stocks, fixed income etc). Large realized gains from asset sales and revaluations (including insurance). We also include one more item: E. Excess of fair value over carrying value: This captures the change in value each year of Fairfax’s associate equity holdings that is not captured in Fairfax’s financial statements (earnings or book value). We include it because this is real value that is being created each year. Historical returns: 2016-2023 For the 8-year period from 2016 to 2023, Fairfax earned an average total return on its investment portfolio of about 5.5% per year. That is a much better return than I would have imagined. Note: D.) Net investment gains including sales We have grouped three items into this bucket. All realized and unrealized gains, from both investments and insurance. And the losses from pushing out the maturities on long term debt. Note: E.) Associates: YOY change in fair value vs carrying value Equity holdings classified as ‘associates’ are valued on Fairfax’s balance sheet at their carrying value not their fair value (market value). Over the years, the fair value of this group of holdings has increased at a faster pace than it’s carrying value. This is value that is being created each year. At some point, Fairfax will harvest the gains. To allow us to focus on Fairfax’s investment portfolio, we have excluded insurance, reinsurance and Fairfax India from our calculations below. Historical returns: 2016-2023 – Calculated in 2-Year Averages If we look at Fairfax’s returns from this time period using 2-year averages we can smooth out much of the annual volatility and get a much clearer picture as to what has been going on under the hood. 2016 – 2017 Average annual return on the investment portfolio bottomed out at 4%. Last of the equity hedges was removed in late 2016 resulting in a $1.2 billion loss. 2018-2019 Average annual return improved to 5.4%. The return improved despite the bear market in stocks in December 2018. 2020-2021 Average annual return improved to 6.4%. The return improved despite the bear market in stocks in 2020 (that hit Fairfax’s holdings especially hard, given they were skewed to cyclicals). 2022-2023 Average annual return fell to 5.9%. However, this was an amazing return when we factor in what happened in 2022: Historic bear market in bonds. Bear market in stocks. Fairfax’s average return in 2022-2023 is actually much better than most investors realize. Why? Fairfax’s massive bond portfolio is mark to market (unlike most P/C insurance peers). Fairfax’s 2-year return of 5.9% includes the carnage caused by the greatest bond bear market in history in 2022. Summary (2016-2023): When viewed through 2-year averages it is clear that Fairfax’s total return on its investment portfolio has been steadily moving higher over the past 8 years. Looking forward: Estimates for 2024 and 2025 The significant headwinds that were holding down Fairfax’s returns from 2016-2023 are now gone. And significant new tailwinds have emerged. Fixed income: portfolio earned 5% in Q1, 2024. Equities: the earnings power of Fairfax’s $19 billion equity portfolio is shining through. My estimate is for Fairfax to earn a total return of about $4.7 billion in 2024, or 7.1% on its average investment portfolio of $65.9 billion. Importantly: Quality: Most of the return (70%) is now coming from high quality sources (interest and dividends and share of profit of associates). The much higher total investment return being delivered by Fairfax is sustainable and durable. Volatility: Given the sources, the return will also be much less volatile than in the past. ---------- Investments Per Share – The Trend From 2016-2023 What has been the growth profile of Fairfax’s investment portfolio? At December 31, 2023, Fairfax’s investment portfolio was $64.8 billion or $2,816/share. From 2016 to 2023, Fairfax’s investment portfolio (per share) has a CAGR of 12.6%. That is an impressive growth rate. A double whammy When it comes to Fairfax’s investment portfolio, two things are happening at the same time: The size of the investment portfolio is growing nicely over time. From 2016-2023, investments per share CAGR = 12.6%. The return being earned on the investment portfolio has increased to over 7%. In 2016/2017, the average return was 4%. This is a great set-up for Fairfax shareholders. The total investment portfolio should continue to grow nicely and a return of +7% looks sustainable in the coming years.
-
@ranimo To answer your question I need a little more information. When you say “basically, the risk that Prem loses his touch and keeps making errors in judgment”, can you provide specific examples of what his past errors in judgement were?
-
@rajpgokul Thanks for taking the time to share your thoughts. Very insightful.
-
@rajpgokul That was a very well done write-up of Fairfax India - one of the best that i have read. It was very rational, concise and hit on the key points. It is also great to get input from a local investor. Thank you for sharing. Please share anything else you have on Fairfax India/holdings or Fairfax/holdings. Do you have any thoughts on a potential IDBI bank bid by Fairfax India/Fairfax? I am wondering what kind of asset IDBI Bank might be? Something with a lot of potential? Decent management team? Or something probably best avoided? Is banking in general a good business in India? Is that industry well positioned to benefit/grow over the next decade (it looks like it from afar)? Fairfax controls CSB Bank… with my limited understanding of that holding… it appears quality of management has been key to its successful turnaround. Banking certainly appears to fall within Fairfax India’s (and Fairfax’s) circle of competence with CSB Bank (and Eurobank).
-
@Crip1 Good idea. I have reestablished a starter position in Fairfax India at $13.80. The publicly traded holdings have increased nicely so far in Q2 so we should see a nice bump in book value when they report Q2. BIAL continues to execute well. It’s a little surprising to me that the stock continues to trade below $14.
-
The FFH-TRS is an investment for Fairfax. From my perspective there are two important considerations: 1.) What is a share of Fairfax worth? 2.) What are the risks of a big drawdown in Fairfax's shares? (With the probability of it actually happening.) On the first point, to state the obvious, Fairfax KNOWS what Fairfax is worth - or at least they know much better than the rest of us. If they still own the FFH-TRS position it likely tells you something about how they view valuation. On the second point, Fairfax is generating record (or close to) earnings. And they look very well positioned for the next 3 or 4 years (I don't look out longer than that). If Fairfax's stock sells off, Fairfax will likely be in a position to buy back a ton of shares at low prices. That is what they did in 2020 and 2021 when they had no money. Well today, the cash is rolling in. Volatility has been great for Fairfax's earnings (looking at the past 5 years). Active management exploits volatility (that is when Mr Market is behaving like an idiot - acting very irrational). Fairfax investors worry about volatility... it is kind of ass backwards. If history is any guide, Fairfax investors should be praying for volatility. I say this tongue in cheek (a little).
-
@gamma78 You ask the question I am grappling with the most these days: "What will Fairfax do with the significant earnings they are currently generating." But more specifically, what will be the impact on Fairfax's different income streams in 2024 and 2025. We have some answers: 1.) dividend = $15 - this is about 10% of Fairfax's earnings. 2.) share buybacks = $1 billion? - this is about 30% of earnings 3.) buy out minority partners in insurance = $500 million? - this would be about 15% of earnings - this hasn't happened The three items above 'account' for about 55% of earnings - and are built into my 2024 forecast. The remaining 45% of earnings? This is probably a good example of where my forecast is too conservative. Especially when compounded over a couple of years. I am forecasting modest organic growth in net premiums written. And small growth in the investment portfolio (including fixed income). I am not including any large, one time investment gains in my forecast for 2024 or 2025. We know there will likely be some (at some point over the next 24 months) - we just don't know what they will be, their size and the timing. I keep waffling on whether to keep these in the forecast... I removed them from the latest. I would appreciate how other board members are thinking about this same question: "What will Fairfax do with the significant earnings they are currently generating." And what will be the impact on Fairfax's different income streams in 2024 and 2025. ---------- Eurobank dividend: Earlier this year I had assumed Eurobank's dividend would show up in 'interest and dividend income.' But at the AGM the people I talked to said because Eurobank is an associate holding the dividend will not be reported in interest and dividend income but instead will show up in the cash flow statement. Perhaps those who have an accounting background can comment further. --------- The impact of the Digit IPO will be something to monitor. Especially once Fairfax gets their ownership position confirmed. There may be a realized gain (I am not sure how everything will play out from an accounting perspective). I am not concerned.
-
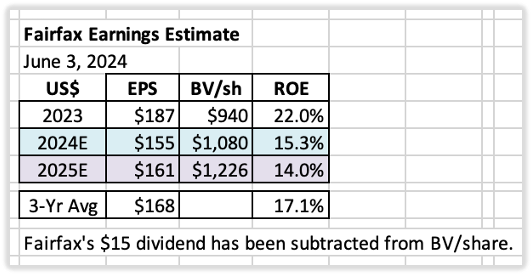
Earnings Estimates – Two Year Summary for 2024 & 2025 Below is my updated two-year earnings estimate for Fairfax. This forecast includes learnings from Fairfax’s Q1, 2024 earnings release and ‘new news’ from the past couple of months (since the last update). Summary My current estimate is Fairfax will earn about $155/share in 2024 and about $160/share in 2025. I think both of these estimates have been constructed using mildly conservative assumptions. Will retained earnings be re-invested in a way that builds value for shareholders? Perhaps the hardest piece to forecast with Fairfax today is what they will be doing with the substantial amount of earnings that they are currently generating (more than $4 billion per year). And the impact the re-investment of current earnings will have on future earnings. Both the size - how much. And the speed - how fast. When it comes to re-investing earnings, Fairfax has lots of very good options: Grow insurance (continuation of the hard market; bolt-on acquisitions) Buy out minority partners in insurance? Buy equities or fixed income securities? Buy back a meaningful amount of Fairfax stock? Other? Looking at the last 5 years, the management team at Fairfax has done an outstanding job with capital allocation. My guess is they will continue to make good decisions (on balance) and this will benefit shareholders in the coming years – likely providing a tailwind to my forecasts for 2024 and 2025. What are current analyst’s earnings estimates for Fairfax? Using Yahoo Finance as a guide (June 3, 2024), analysts estimate that Fairfax will earn: US$138/share (C$188) in 2024 US$152/share (C$208) in 2025 From what I can see, most analysts are assigning little benefit to the reinvestment of Fairfax’s significant earnings and the company’s proven capital allocation skills. My read is most analysts will include these benefits into their earnings estimates only after Fairfax has announced something. Interest rates: I am assuming interest rates remain roughly at current levels (at June 3, 2024). Of course, this will likely not be the case. Given the duration of the fixed income portfolio (a little under 3 years?) is now closer to the duration of the insurance liabilities (a little under 4 years?), changes in interest rates might roughly balance out (in ‘net gains/losses on investments’ and ‘effects of discounting and risk adjustment- IFRS 17’). Below is a 5-year snapshot of earnings for Fairfax. It communicates in a concise manner the dramatic transformation that has happened at the company, beginning around 2021. There has been a spike in operating income per share – from an average of $39/share from 2016-2020, to $192/share in 2023. This much higher amount now looks like the new baseline for the company. For 2024, my estimate has operating income increasing to $199/share, which is a 400% increase from the average from 2016-2020. ‘Normalized earnings’ at Fairfax have moved to a much higher level – and, importantly, this higher level looks durable/sustainable. What are the key assumptions built in to the forecast? 1.) Underwriting profit: Estimate = $1.24 billion in 2024. Net premiums written growth of 12% in 2024 and 3% in 2025. This is being driven by: Continuation of the hard market, which we estimate will add $1 billion of NPW. The Gulf Insurance Group (GIG) acquisition, which will add $1.7 billion of NPW. Combined ratio (CR) of 95% in both 2024 and 2025. Catastrophe losses: 2024 will be a more normal year (higher than 2023). Fairfax continues to modestly shrink their total catastrophe exposure. Reserve releases: continuation of the positive trend observed in 2023. 2.) Interest and dividend income: Estimate = $2.38 billion in 2024. Interest and dividend income in Q1 2023 was $590 million; this provides a good baseline. GIG added $2.4 billion to the total investment portfolio in late 2023. Rate cuts by global central banks could be a headwind in 2H, 2024. 3.) Share of profit of associates: Estimate = $900 million in 2024. Earnings at Eurobank and Poseidon/Atlas should continue to chug along. Stelco (steel) EXCO (nat gas prices) results will be volatile. GIG will be a small headwind as it is now a consolidated holding. 4.) Effects of discounting and risk adjustment (IFRS 17): The two key drivers for this bucket are the trend in net written premiums of the insurance business and changes in interest rates. Net written premiums growth of 12% in 2024 should be a tailwind. This bucket is difficult to model – my confidence level in my estimates is low. 5.) Life insurance and runoff: Estimate = $250 million in 2024. This combination of businesses lost about $348 million in 2023 (not including investment returns). I expect 2024 to be a little better, with life insurance being a modest tailwind. 6.) Other (revenue-expenses) - non-insurance subsidiaries: Estimate = $150 million in 2024. Recipe, Dexterra, AGT, Grivalia Hospitality, Boat Rocker etc. This combination of businesses earned $46 million in 2023. This bucket is poised to grow nicely in the coming years. Yes, the results will be lumpy. 7.) Interest expense: Estimate = $610 million An increase to prior year which was $510 million. 8.) Corporate overhead and other: Estimate = $435 million in 2024. A modest increase to prior year which was $430 million. 9.) Net gains on investments: Estimate = $1.075 billion in 2024. The big driver will be the FFH-TRS position. $250/share x 1.96mn shares = $500 million? Remaining mark to market holdings of $7 billion x 7% return = $500 million? 10.) Gain on sale/deconsol of insurance sub: Estimate = $0 in 2024. Simply being conservative. This is where I put the large asset sales/revaluations. These items are difficult to forecast. I will add these items to my forecast when they happen. 2023 transactions: sale of Ambridge and the revaluation of GIG = total of $550 million. Bottom line, this bucket is a wild card. But Fairfax has a long history of surfacing significant value hidden on its balance sheet. When they do, we see significant realized gains (from both insurance and non-insurance holdings). 11.) Income taxes: Estimate = 19% (historical average rate) 12.) Non-controlling interests: I am expecting Fairfax to take out one of its minority partners in 2024. From my perspective, the leading candidate looks like Brit. My second choice would be increasing their ownership in Allied World to perhaps 90% (from 83.4% today). In the past, I used an average rate of 11% (amount of net earnings that was allocated to non-controlling interests). This has been reduced to 9.5% in 2024 and 7.5% in 2025. This change increases the amount of net earnings going to Fairfax shareholders (the numerator in the EPS calculation). 13.) Shares Outstanding: Estimate = 22.2 million effective shares outstanding (Dec 31, 2024). This would be a reduction of 800,000 shares in 2024 (3.5%). A significant number. To May 10, effective shares outstanding have been reduced by 561,102 to 22.44 million. Notes: Underwriting profit’: Includes insurance and reinsurance; does not include runoff or Eurolife life insurance. Interest and dividends’ and ‘share of profit of associates’: Includes insurance, reinsurance and runoff. ————— Return on Equity Calculation Return on equity (ROE) is calculated using ‘average equity’ which is: (PY ending BV/share + CY ending BV/share) / 2 I think most of the industry (other P/C insurance companies, analysts) calculates ROE using an average number for equity. This should make my ROE estimates comparable with industry numbers.
-
Parts of the Phelan family still own 16% of Recipe (Fairfax owns the other 84%). Interesting story / bit of Canadiana... The food fight for Swiss Chalet’s owner is a lesson for all family companies Hopefully the link below works (the article is behind a paywall): https://www.theglobeandmail.com/gift/ec504d70a4c6763bef7b3e7b87d07bf3bdfd3e8486a41630e08b66b2b94a0e29/UMHHEN6ZJZBDZO5SDLUVLKDVXU/ "In the 1990s, the Phelan family ranked among the country’s wealthiest clans. Their restaurant chains – including Swiss Chalet and Harvey’s – served millions of meals and cranked out millions in profits for parent company Cara Operations Ltd., now known as Recipe Unlimited Corp. Patriarch Paul James Phelan – PJ to those who knew him – wanted the 100-year-old business to remain in family hands for another century. It wasn’t to be. "A bruising, years-long battle for control of the company pitted PJ Phelan and his son against two of his daughters, Gail and Rosemary. It ended in 2003 with the women winning control through a debt-funded buyout, then eventually handing the reins to insurer and asset manager Fairfax Financial Holdings Ltd. "Author Stephen Kimber captures the bitter fight for Cara in The Phelan Feud, published on Friday. Working with surviving family members – PJ Phelan died in 2002 – and with full access to court documents and private family records, he has written a book filled with intrigue, betrayal and high-living, including family-backed yachts vying for the America’s Cup. It’s a story with poignant lessons for any family, with special relevance to the privately owned businesses that are major contributors to the country’s economy."
-
When you compare Fairfax’s income streams to traditional P/C insurers there are big differences. Here is the split for most traditional P/C insurers: - underwriting = 50% - interest and dividends = 45% - misc = 5% A soft market in insurance will impact Fairfax’s earnings much less than it will impact traditional P/C insurers. Fairfax’s split for underwriting income is 20 to 25%. Fairfax is way more levered to investments. Fairfax’s significant share buybacks are also important. It is meaningfully increasing all the per share metrics: - investments per share - float per share - earnings per share I hope Fairfax continues to be aggressive with share buybacks. They are generating so much cash. The stock is cheap. It is such an easy / beneficial use of capital.
-
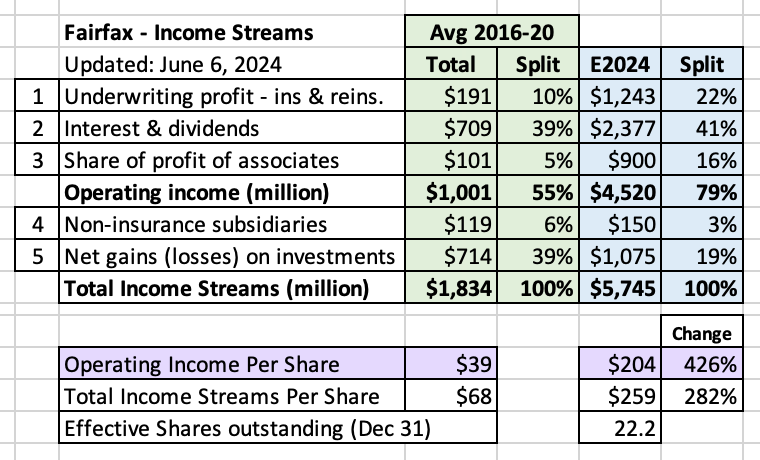
If you wanted to understand the 'transformation' that has happened at Fairfax over the past 4 years in one chart this would probably be it. Note: my original chart had a calculation error which has been corrected in the chart below. I will talk to quality control to review what happened The 5 income streams below flow into Fairfax's earnings: 1.) The total from all 5 income streams has increased from $1.8 to $5.7 billion. - from $68/share to $259/share or 282%. 2.) Operating income has increased from $1 billion to $4.5 billion. - from $39/share to $204/share or 426%. High quality operating income now represents 79% of all income streams, up from 55%. That is a game changer.
-
I think looking at the flow of people might be a good indicator. People ‘vote’ with their feet. It seems an awful lot of people from the rest of the world desperately want to get into the US/Canada/Western Europe. I don’t think your view is a ‘brainwashed simplistic Western view.’ Hong Kong provides a great case study. They went from a democracy to a dictatorship. My understanding is pretty much everybody who could get out got out (or made alternative arrangements to be able to exit at some point in the future). How about Russia? My son is at an age where he would likely have been conscripted into the army and would be fighting in the war in Ukraine. No thanks (putting it politely). India will be interesting to watch moving forward. I certainly hope they continue to shift towards capitalism (and away from socialism). While maintaining their democratic/rule of law framework.
-
@glider3834 thanks for bringing this forward and for providing so much detail. The first step was getting approval from regulators. Getting that done and this quickly is a big deal. The Hellenic Bank acquisition is shaping up to be a significant near-term catalyst for Eurobank’s business and earnings. Hellenic Bank’s pending big move into insurance adds another really interesting layer to this story. Step 2 is proceeding with a mandatory offer and that is where we are today. The article you linked to says this process should be completed by the end of July. It will be interesting to see what quantity of shares get tendered at EUR 2.56. I have no idea how this plays out. I am confident Eurobank has a plan. Their Q2 earnings call should be interesting. Perhaps a few of the research houses (like Morgan Stanley) shed some light on how things might unfold.
-
Sanjeev, thanks for managing a great forum. The fact you have been able to keep it going for +20 years is amazing. The stuff i have learned, and the value i have received over the many years has been priceless - it has been a life changing experience for me and my family. More recently, the relationships built has been icing on the cake.
-
Given Ben's critical role at Fairfax in the coming years this likely makes a lot of sense (as an interim step). Given Prem's age, time for Ben to get more responsibilities. Ben has been pretty focussed on India (based on his comments the past year). Importantly, Prem and Chandran will still be at Fairfax India and will be able to mentor Ben. ---------- From the Corporate Governance Institute https://www.thecorporategovernanceinstitute.com/insights/lexicon/what-is-the-role-of-the-chair-of-the-board/ A good chair provides leadership to the board rather than the company. The chair’s primary role is to ensure that the board is effective in setting and implementing an organisation’s direction and strategy. Therefore, the chair is responsible for leading the board and focusing it on strategic matters, overseeing the company’s business, and setting high governance standards. The chair plays a pivotal role in fostering the effectiveness of the board and individual directors, both inside and outside the board room.
-
@petec, as is usual, you make a very insightful point. There has been an enormous amount change in the results that Fairfax is delivering today compared to 5 short years ago. I thought it was refreshing to hear Prem at the AGM say even Fairfax did not see it coming (the magnitude of the change). To capitalize on Fairfax the past 5 years, an investor has needed to: - stay inquisitive - keep an open mind These are two traits Stan Druckenmiller said he looks for in new hires. Investors who were unable ‘stay inquisitive’ and ‘keep an open mind’ completely missed the opportunity that has unfolded with Fairfax over the past 5 years. They probably still are. I started to get interested in Fairfax as an investment again (in a big way) back in 2019. I had no idea this is how things would play out. It has been an absolutely crazy ride (in a good way). Many long-term Fairfax watchers have made similar comments in the recent past. The ‘facts’ have been changing at a mind-boggling pace pretty much every year for the past 5 years. So much so, it has been hard to keep up. External events certainly helped. You have highlighted this in the past. - Hard market in insurance. - Interest rates normalizing at much higher levels. - Record bull markets in steel and lumber. - Wicked volatility in bond and stock markets. And Fairfax’s execution has been unbelievable. They have hit the ball out of the park on numerous occasions. The end result is we are now in uncharted territory with Fairfax. 1.) What is a ‘normalized’ level of earnings? 2.) How much will earnings grow in the comings years? 3.) What is the intrinsic value of the company as it exists today? Of the three questions i ask above, i think we are probably able to answer the first with some accuracy. Because we have 2023 in the books. The second question? This is where i think investors are way off base today (too low). And this is then resulting in a big miss with question 3 (also too low). Looking ahead another 5 years… I can’t wait to see how things play out. ————— Looking 5 years into the future (2028), what will Fairfax deliver? 1.) Float per share? 2.) Investments per share? 3.) 5 year average return on investments? 4.) Net Premiums written per share? 5.) 5 year average combined ratio? 6.) Earnings per share? For each of the measures above, ‘amounts accruing to common shareholders.’


