Viking
-
Posts
6,052 -
Joined
-
Last visited
-
Days Won
78
Content Type
Profiles
Forums
Events
Everything posted by Viking
-
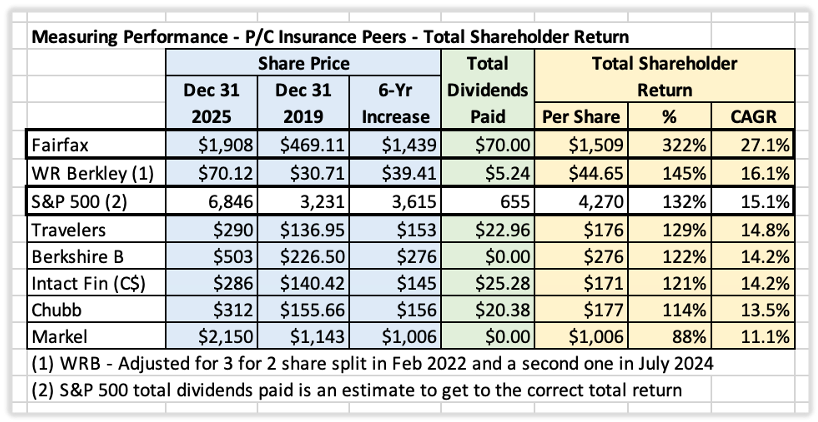
Performance and Valuation – Comparing Fairfax to P/C Insurance Peers - Part 1 As we wait for results from Fairfax later this week, this is a good time to revisit how the stock is currently being valued. Valuation Methodology: A Relative Return Framework There are many ways to value a company. Here, we use a relative approach—comparing Fairfax to a select group of high-quality P/C insurers—to answer three core questions: How have these companies performed? How are they being valued today? Does valuation align with performance? To provide additional context, we also compare results to the broader market as an absolute benchmark. Peer Group Fairfax is compared against the following companies (alphabetical order): Berkshire Hathaway (BRK) – Historical gold standard; now a diversified conglomerate Chubb (CB) – Large, global, traditional insurer Intact Financial (IFC.TO) – Largest P/C insurer in Canada; expanding globally Markel (MKL) – “Baby Berkshire”; U.S.-focused specialty insurer Travelers (TRV) – Large U.S. insurer; DJIA component W.R. Berkley (WRB) – High-quality U.S. specialty insurer Each company has a distinct business model. Accordingly, this analysis is intentionally high level and focused on the metrics most relevant to P/C insurers. Measuring Performance: A Six-Year View (Dec 31, 2019 to Dec 31, 2025) Buffett has often suggested that five years is a reasonable timeframe for evaluating management performance. We extend the window slightly to six years to reduce distortions caused by Covid-era volatility. Performance Metrics Used For decades, Buffett relied on growth in book value per share as Berkshire’s primary yardstick. In 2018, he pivoted to a simpler measure: change in share price. We use both approaches: Change in BVPS + dividends Total shareholder return (TSR): share price appreciation + dividends Together, these provide a practical framework for evaluating how effectively management compounds shareholder capital over time. Overview of the Process Step 1: Review Past Performance Relative vs. peers Change in BVPS + dividends Total shareholder return (share price + dividends) Absolute vs. the market Comparison to S&P 500 total return Step 2: Examine Valuation Price-to-book value (P/BV) Price-to-earnings (P/E) Step 3: Connect the Dots Does valuation align with performance? What can we learn from any disconnect? Does this warrant further study? Past Performance Analysis 1) Change in Book Value Per Share + Dividends Book value per share (BVPS) growth has long been a core metric for evaluating P/C insurers. It measures how fast shareholder capital is compounding. BVPS captures retained value Dividends represent value distributed Both matter 6-Year Results (2020–2025): Fairfax ranks #1 among peers BVPS + dividend growth: +173% CAGR: 18.2% The outperformance is material. There is a wide divergence across the group, with Travelers (9.4% CAGR) and Chubb (9.3% CAGR) at the lower end. An Important Adjustment: Economic vs. Accounting Performance BVPS captures accounting results. What really matters is economic performance. BVPS is a strong proxy for traditional insurers. But it becomes less complete for companies with large associate and consolidated equity holdings—such as Berkshire, Markel, and Fairfax—where capital is compounding in ways not fully captured in reported book value. This creates a form of “hidden value.” As a result: BVPS + dividends understate the true performance of these companies. The gap between accounting value and economic value is growing over time. Investors need to keep this in mind when interpreting results. A Simpler Approach In 2018, Buffett moved away from BVPS as Berkshire’s primary performance measure and instead emphasized share price performance (total shareholder return, as Berkshire does not pay a dividend). The logic was straightforward: as Berkshire evolved, book value became a less reliable proxy for intrinsic value (that “hidden value” thing). Over time, the share price did a better job reflecting economic reality. Charlie Munger captured the essence of this idea: "Over the long term, it's hard for a stock to earn a much better return than the business which underlies it earns." Charlie Munger - Wesco Financial AGM – 1994 Over long periods, TSR cuts through differences in accounting, capital structures, and business models, providing a clean, comparable outcome metric. Absolute Performance Benchmark Using TSR also allows comparison to the broader market. S&P 500 Total Return (2020–2025): CAGR: 15.1% This provides a useful absolute yardstick. 2) Total Shareholder Return (TSR) TSR includes: Share price appreciation All dividends paid (including special dividends) Results (2020–2025): Fairfax ranks #1 again Total return: +322% CAGR: 27.1% Only two companies beat the S&P 500 total return over the period: Fairfax W.R. Berkley Most peers delivered respectable mid-teens returns. Fairfax’s performance, by contrast, has been exceptional—dramatically outpacing both the market and the peer group. Keep going to read Part 2 (the next post).

-
@UK , thanks for posting. My guess is this partly explains the elevated volatility we have been seeing with P/C insurance stocks over the past 6 to 9 months. This volatility will likely persist moving forward. The key for P/C insurers will likely be earnings, dividends and buybacks - those components may well represent most of the return investors receive moving forward (not a lot of multiple expansion for the group as a whole). We appear to be at the 'wall of worry' part of the cycle.
-
I am a complete idiot when it comes to understanding how the market trades. It will be interesting if the selloff in software stocks is for real (I have bought a little CSU and ADBE on the big drawdown) and if the shift into HALO is for real. But if the momentum crowd gets interested we could see it pop. And these are small sectors (energy, materials, consumer staples) - a large inflow of $ could have an outsized impact.
-
Josh Brown making a big call on this years dominant investment theme: HALO stocks Heavy Assets, Low Obsolescence “These are the stocks that are going up in 2026.” Can’t be disrupted by AI. Not about value or growth. Sectors: Energy, materials, consumer staples No idea if he will be right. I do find Josh’s views to be pretty insightful. (Skip ahead to 4:30 mark to get to his explanation of what a HALO stock is.) Guess whose portfolio is stuffed with HALO stocks? Fairfax. Their equity holdings smoked last year. And they off to a very strong start in 2026. Let’s hope Josh is right.
-
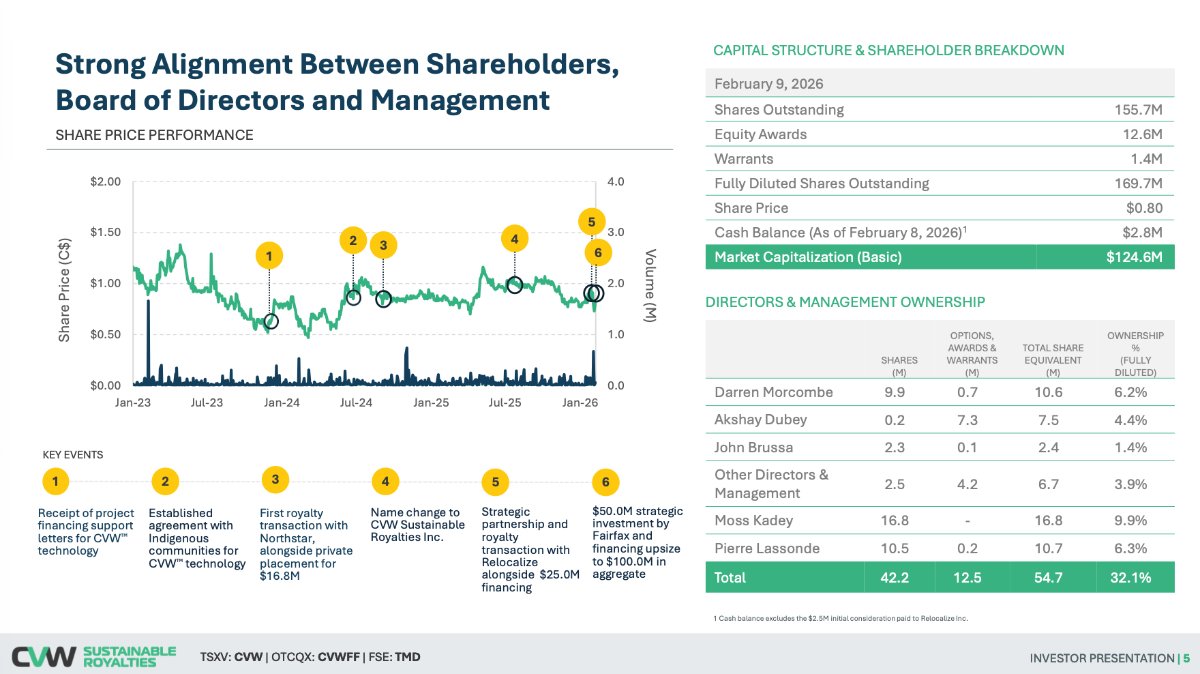
@jbwent63 and @Hoodlum , thanks for pointing out the Pierre Lassonde angle to the investment in CVW Sustainable Royalties. This is a very small investment for Fairfax ($37 million = C$50 million). https://wp-cvwcleantech-2024.s3.ca-central-1.amazonaws.com/media/2026/02/2026-02-CVW-Investor-Presentation-1.pdf
-
How is Fairfax’s equity portfolio performing YTD-2026? It is up in value by ~$1.4B, or ~$62/sh. Very strong start to the year. Big gainers? Eurobank, Orla (gold), CIB, UA (new) and Foran (copper). Q1 will also see ~$250M gain on sale of Eurolife. Importantly, my tracker only captures the change in value of the public equities, which represents ~60% of total holdings. This means public equities are up ~8.8% to start the year (not the 5.2% in my summary below). Of course the 40% of holdings that are not public are also going up in value. For those who want to get into the weeds, my Excel tracker is attached below. Fairfax Feb 2026.xlsx
-
Fairfax also just paid a $15 dividend. Total shareholder return has been very good.
-
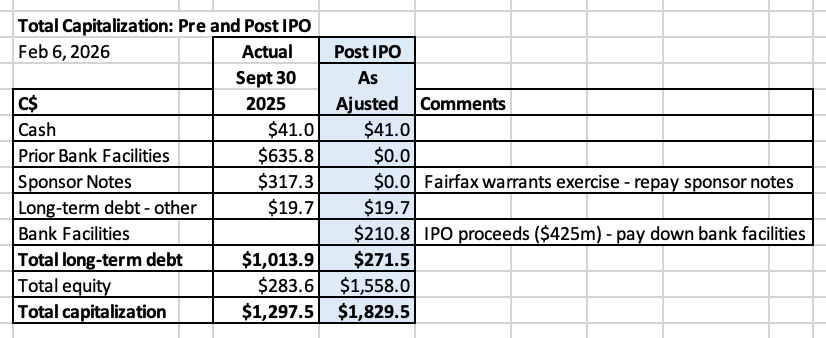
@Hoodlum, good question. Go to point 2: Capital Structure. Column 1 is from the prospectus. I added column 2. The prospectus put total equity at $283.6M at Sept 30, 2025. What I am trying to estimate (very roughly) is what is Fairfax contributing (pre-IPO)? And what are they getting (post-IPO)? And what is the (rough) difference?
-
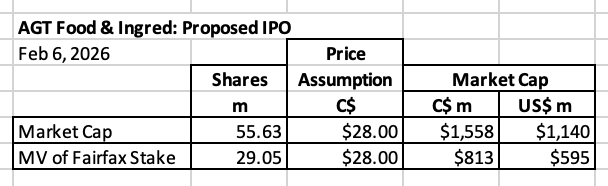
@Hoodlum provided a link to AGT's prospectus.
-
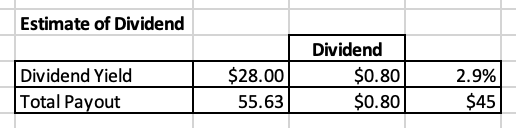
AGT IPO - A World of Opportunity Ok. Here is my first take on the AGT IPO. As per usual, please let me know if you see any mistakes in my math/logic. One of the big strengths of this board is we all get the opportunity to post our work and get input from other board members. We all learn and improve our understanding along the way. Thank you. What key take-aways on this transaction do others have? What am I missing? AGT has been a bit of a mystery holding since Fairfax took it private in 2018. The company has been busy transforming its business (significantly reducing the volatility in earnings). In 2025 it divested non-core rail assets. With the IPO it significantly deleverages the balance sheet. AGT is another example of what a good partner Fairfax is. Patient. Supportive. Demanding - in the right sort of way. The goal at Fairfax is to get the company in a position to succeed. AGT looks like mission accomplished. The company has a dynamic founder/CEO. Post IPO it will have a strong balance sheet. The company is profitable, with growth funded from internal cash flow. Pre-2018 version of AGT was ‘old Fairfax.’ It was not positioned to success as a public company: volatile earnings with a leveraged balance sheet - what could possibly go wrong? 2026 (post IPO) version of AGT is ’new Fairfax.’ This is another example of how much Fairfax has improved its investment framework over the past 8 or so years (from the 2017 and earlier period). The difference is stark. AGT is also further proof that Fairfax is largely done fixing past mistakes. It has been a long road (8 years) for Fairfax. Hard work. Tough decisions. Lots of write downs along the way. AGT is lead by a very dynamic and entrepreneurial CEO, Murad Al-Katib. AGT will be an interesting company to watch moving forward - quite literally, the company has a world of opportunity. All numbers are C$ unless indicated otherwise. 1.) Share count - Post-IPO Assumptions $28 share price (mid-point of $26 - $30 offer price) Over-allotment option: not exercised (to keep the analysis simple) 2.) Capital Structure Transformation IPO materially reshapes AGT’s balance sheet: Fairfax exercises warrants, eliminating Sponsor Notes. IPO proceeds of ~$425M are used to pay down Prior Bank Facilities Post IPO impact: Long term debt falls sharply from ~$1.0B to ~$272M. Annual finance expense declines by $43.7M. Equity increases from ~$283M to ~$1.6B Puts AGT in a very strong position moving forward as a publicly traded company. 3.) Fairfax’s Ownership Stake Post-IPO Pre-IPO estimate: ~$526M? Equity: $186M? (65.7% of $283.6M?) Sponsor Notes/Warrants: $340 million Post-IPO Market value: $813M, or US$595M Ownership: 52.2% (retains control) At roughly US$600M in market value, AGT would rank around the ~10th largest equity holding within Fairfax’s equity portfolio. 4.) Potential Dividend Framework Assume a dividend of $0.80/share: Yield: ~2.9% Total annual cash cost: ~$45M Notably, this is approximately equal to the reduction in annual finance expense from deleveraging, suggesting a possible framework for a sustainable initial dividend.
-
BMO has always had a hard time with Fairfax. This is nothing new. And that is because they look at Fairfax in a very narrow way: as a traditional P/C insurance company. What matters in BMO's model is underwriting and interest income. As inputs to their model, they also heavily rely on macro (very high level) thinking ("soft market", "interest rates" etc) - not what is actually happening at the company. IFRS is another problem for them. Most importantly in their analysis, they tend to ignore the part of Fairfax that don't fit nicely into their model: How Fairfax invests/does capital allocation. Impact of reinvestment on earnings moving forward (i.e. what Fairfax will be doing with $4.5B in earnings) Growing size of fixed income portfolio ~ positive impact on interest income Growth in equity portfolio ~ positive impact on numerous income streams Meaningful share buybacks (i.e. 4% per year) ~ positive impact on all metrics Buying out minority interest in Allied World (high probability in 2026) ~ growth of insurance Etc. Hidden value that has been building on the balance sheet (Eurobank being the obvious example) This will be a significant tailwind to investment gains in the future Put it all together and their model just doesn't work for Fairfax - as a result they have a square peg, round hole problem. This obviously affects the quality of their research on Fairfax. The good news is there are lots of analysts that have made the effort to understand Fairfax and adjust their models to reflect reality. Investors need to have their eyes wide open (to state the obvious).
-
That wasn’t the case pre-2010. And I’m not sure people thought that way from 2010 to 2020 (because trust was low on investments/capital allocation). Trusting them on investing, capital allocation and underwriting - the trifecta - that is new. And I don’t think it is consensus - I wholeheartedly agree with it (trust). My guess is it will take Fairfax a couple more years to re-built trust. And even then, the company will probably be on a short leash with many investors (lack of trust is probably responsible for driving part of the current sell off).
-
Fairfax is going to earn well over $25 billion over the next 5 years. What they do with that pile of money (capital allocation) will have a much bigger impact on the company that whether their CR is 94% or 95%. Underwriting is important - ideally it needs to be sub-100%. So your cost of float is better than free.
-
@ValueNation, great question. The short answer is no. And that is because Fairfax is currently trading at a very low valuation - starting point matters a lot. My math says the stock is trading at P/BV multiple of 1.3 x (my estimate of 2025YE). That does not include hidden value (I get all that for free). My guess is they are poised to deliver ROE of +15% over each of next 5 years (with some volatility). If Fairfax was trading at a premium valuation to the market and other P/C insurers then I might be thinking more about what Mr. Market is thinking. A big reason I like Fairfax so much right now is they are generating record earnings. And they think their stock is cheap - they are buying back a meaningful amount of shares each year. As @djokovic1 points out, as long as Fairfax continues to execute well (+15% ROE) and continues to vacuum up shares, I think shareholders will do very well. Multiple expansion simply becomes icing on the cake. ————— Having said that, I do think Fairfax will be volatile. This will be driven by lots of different, often unrelated factors. Some make sense to me. Others, not so much. External fears: Soft insurance market Lower interest rates Material stock market sell off Internal (company specific) fears: Perception Fairfax has a low quality insurance franchise Dislike of Fairfax’s equity portfolio (in general) Dislike of new big equity purchase (look at all the chatter a small purchase like UA is getting…) On the other hand we are also going to get upside surprises: External Interest rates moving materially higher Equity markets continue their bull run Internal Strong insurance performance Strong equity performance Hidden value getting surfaced (like sale of Eurolife in Q1). Eurobank - this getting marked to market sill be a material event BIAL IPO (via anchorage) will likely be material The other important factor is if you are a short term or long term investor. The beauty of Fairfax today (business model + management) is they are positioned to be able to benefit from whatever happens moving forward. This is especially true for long term investors (who are able to ride out short term volatility).
-
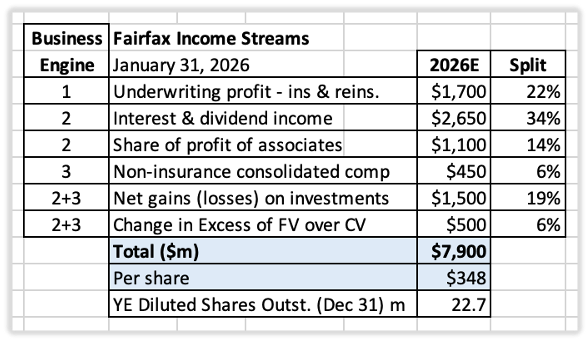
Fairfax Financial’s Business Model This post is the third in our series discussing Fairfax's business model. Below are links to the first two posts: 1. An Overview of Fairfax's business model: https://thecobf.com/forum/topic/21600-fairfax-2026/page/14/#findComment-660399 2. How it has changed over 40 years: https://thecobf.com/forum/topic/21600-fairfax-2026/page/12/#findComment-658839 An Income-Stream View of a Long-Term Capital Compounding Machine Seeing the Full Picture To better understand Fairfax, it helps to look at the company in different ways. Most investors analyze Fairfax through the lens of a traditional P/C insurance company. That framework misses the essence of the business. In this post, we instead view Fairfax through its six income streams—the underlying sources that drive reported earnings and long-term growth in economic (intrinsic) value. This framework does three important things: It connects Fairfax’s business model directly to its income statement and balance sheet It highlights how Fairfax differs fundamentally from conventional P/C insurers It explains why Fairfax is uniquely positioned to continue compounding capital at above-average rates of return Seen this way, Fairfax is not simply an insurer. It is a capital compounding platform with multiple, reinforcing earnings engines. The Six Income Streams Fairfax’s results are driven by six distinct income streams. Five are accounting streams that appear directly on the income statement. The sixth is an economic adjustment that captures value creation not yet recognized in reported earnings. Together, these six streams map cleanly to Fairfax’s three business engines. Accounting Income Streams (1 – 5) The first five income streams are reflected in reported earnings. Engine 1: Insurance 1. Underwriting profit Engine 2: Investments 2. Interest and dividend income 3. Share of profit of associates Engine 3: Non-Insurance Operating Companies 4. Non-insurance consolidated companies Crosses All Three Engines 5. Investment gains (arising from insurance, investments and non-insurance operating companies) As Warren Buffett has long emphasized, accounting earnings are a useful starting point—but on their own, they are incomplete. To understand what Fairfax is really earning, we need to go one step further. Beyond Accounting: The Economic Adjustment (Hidden Value) Fairfax discloses a key measure of value creation that does not flow through reported earnings: 6. Annual change in excess of fair value over carrying value (FV – CV) for associate and consolidated companies This represents value that has already been created but not yet recognized in accounting results. Importantly, it is not an abstract estimate – it is data is supplied directly by Fairfax, making it transparent and easy to track. This measure does not capture all of the hidden value Fairfax creates each year. But it is a meaningful and conservative starting point. Critically, this hidden value will become a material source of future reported earnings as it is realized through investment gains. Mapping Income Streams to Business Engines The chart below matches Fairfax’s three business engines to its six income streams: Business engines: Insurance Investments Non-insurance operating companies Fairfax vs. Traditional P/C Insurers Viewing Fairfax through income streams makes one thing immediately clear: this is not a conventional P/C insurance company. Traditional P/C Insurers Most P/C insurers rely on just two income streams: Underwriting profit (~45%) Interest income (~55%) That is essentially the entire economic model. It is optimized to smooth volatility (not return). Fairfax Financial Fairfax’s economic results are driven by six income streams: 1. Underwriting profit (~22%) 2. Interest and dividend income (~34%) 3. Share of profit of associates (~14%) 4. Non-insurance consolidated companies (~6%) 5. Investment gains (~19%) 6. Hidden value (~6%) This diversification of earnings sources fundamentally changes how the business behaves—and how it should be analyzed compared to peers. It is optimized to exploit volatility (and per share value creation over the long term). Where Many Analysts (and Investors) Go Wrong Most analysts continue to view Fairfax through the lens of a traditional P/C insurer. As a result, they focus primarily on two income streams: underwriting and interest income. That approach fails for two reasons: It ignores four income streams, composing roughly 44% of Fairfax’s earnings power It misses the most important driver of long-term results: capital allocation For Fairfax, the insurance cycle is not the primary determinant of long-term performance. Capital allocation is. In soft insurance markets, capital does not remain trapped in the insurance silo. It shifts—toward equities, private businesses, credit, or other opportunities—allowing Fairfax to continue compounding capital at attractive rates. This business model closely resembles Berkshire Hathaway’s structure in the 1980s and 1990s. Did soft insurance markets impair Berkshire’s ability to compound capital during that period? Clearly not. There is an important lesson here for investors and analysts evaluating Fairfax today. Because Fairfax does not fit the conventional model, many commonly drawn conclusions about the company should be treated with skepticism. This persistent misunderstanding contributes to share-price volatility—and that volatility creates opportunity, both for long-term investors and for Fairfax itself through disciplined share repurchases.
-
Taking out 24% of effective share outstanding over the past 8 years looks 'serious' to me. That has to put them in 1% of companies out there (in terms of buybacks). At the same time they were able to dramatically grow their P/C insurance business. And make some pretty outstanding investments: Orla being just the latest example. It will be interesting what they do on the buyback front moving forward. If they continue to hold the FFH-TRS my guess is they will continue to be aggressive.
-
Well it looks like we will finally get a look under the hood at AGT. Fairfax took the company private in 2018. It has been quietly percolating away for the past 7 years… Perhaps this also partly answers the question: is Fairfax looking to become a conglomerate like BRK? Answer: No I like this proposed transaction from a couple of angles: Disclosure it will provide: we will find out what this asset is worth and what Fairfax’s stake is valued at. Surfaces value: my guess is FV exceeds CV. Provides some cash that Fairfax will be able to reinvest. My guess is AGT’s business has some volatility attached to it. Making it a smaller position in Fairfax’s portfolio appeals to me.
-
@Munger_Disciple, what ROE do you think BRK and FFH will each deliver over the next 5 years (on average)? (I think this estimate goes hand in hand with P/B estimates.)
-
Good point. "Fairfax is not a P/C insurance company" is not technically correct. I like to exaggerate sometimes when trying to make a point... My view is Fairfax will earn higher returns (and ROE) than BRK moving forward. As a result, yes, one would think this would be reflected in a higher P/BV multiple. But to be honest, I do not follow BRK all that closely - so I am not sure what is going on under the hood at the company.
-
In my post I stated that Fairfax is not a P/C insurance company. I also don't think BRK of today is a good comparison. I don't think Fairfax intends to become a full on conglomerate, which is what BRK is today. The difference between BRK goes well beyond float: Size Reinvestment opportunity How they do capital allocation Sell strategy Buyback strategy International (India/Greece) Ownership (Prem will never sell; Buffett's holdings will be sold over time) Etc, etc I think BRK of 1980/1990 is closer to Fairfax today... but the also has its limitations. (Importantly, no one is as good as Buffett was back then.)
-
@Hoodlum Thanks for the update.
-
@Milu, UA is (still) a small investment. What I focus on is results. Here is how Fairfax’s 10 largest public holdings performed in 2025. Results for the past 5 years have been very good. At high level, they are watering their flowers and pulling their weeds. As a result, i give management some leeway - they have earned it in my books. Importantly, they are going to make some mistakes (this is not to say I think UA is a mistake - I have no idea as I don’t follow the company/industry).
-
@Parsad, I am on the record as saying Fairfax has changed their investment framework: Partner with strong management teams Companies with strong balance sheets Companies that are profitable (able to grow via retained earnings) Of course there are exceptions. I think Fairfax learned the hard way that they are not resourced at H/O to be a turnaround shop. Especially today as the company grows quickly in size. The few true turnaround holdings left are slowly getting wound down: Boat Rocker (folded into stronger Blue Ant) Blackberry: exited debentures… now exiting common stock)
-
In addition to @Parsad examples: Dexterra: purchased out of bankruptcy (the UK parent went bankrupt; the Canadian operations were good). Peak Achievements: purchased out of bankruptcy. Both of these have done well. I might also include the Recipe take private in the turnaround bucket. Fairfax bought it at a distressed price at the end of Covid. Better examples of this might be EXCO take private and/or the AGT Food and Ingredients take private. All three of these holdings went from dogs to solid investments today.
-
@Buffett_Groupie, great question. Today, I include all associate holdings in engine 2. I think you could make a good case that they should be included in the third engine and make it: share of profit of associates + non-insurance consolidated holdings. What do you think? Is that how you think about Fairfax? I am working on a post where I layer in Fairfax’s 6 income streams. I think that is another helpful way to think about Fairfax’s business model.