Viking
-
Posts
6,052 -
Joined
-
Last visited
-
Days Won
78
Content Type
Profiles
Forums
Events
Everything posted by Viking
-
In the short term, I don’t think there is a lot of ‘informational’ value in trying understand why Fairfax’s stock is trading at the price it is. After all, we are talking about Mr. Market. And Fairfax - which is misunderstood and under-appreciated by Mr. Market. I look forward to being able to exploit the volatility (like I have been able to do with Fairfax for the past 22 years). Public markets are the gift that keeps on giving.
-
I would be interested to learn how other board members are valuing Fairfax’s stock today. It looks like Fairfax paid about US$1,700 for the shares they bought back in August. So let’s use that as our ‘price’. My guess is BV today is about US$1,200. That puts the trailing P/BV at 1.4. That is cheap. Especially for a company consistently delivering an average ROE in the high teens. But what about excess of FV over CV? That is about $100/share (after tax). That puts ‘adjusted’ BV at US$1,300. That puts the trailing P/BV at 1.3x BV. That is very cheap. What about if we use expected BV at Dec 31, 2026. Let’s look ahead 16 months. My guess is ‘adjusted’ BV will be about $1,520. That puts the 1-year forward P/BV at 1.1 x. Well that is crazy cheap. Importantly, the intrinsic value of Fairfax shares is much higher than my ‘adjusted’ BV estimates used above, providing a nice margin of safety. And Fairfax’s management team is best-in-class - looks like we are getting this for free. My guess is Fairfax can do basic math. And that likely explains why they are still buying back stock at a pretty good clip at US$1,700/ share. But I can also understand why looking a year into the future is too complicated for most ‘investors’ - 12 months is a freaking eternity! PS: We could also do a similar analysis using PE (my guess is economic earnings for Fairfax will come in around US$220/share in 2025). It says pretty much the same thing. Which probably tells us something…
-
+1. Thanks.
-
@SafetyinNumbers, is there a way to tell if this is perhaps a partial unwind of the FFH-TRS position (like they did in Q4)? Fairfax’s stock is up about 20% YTD in 2025. Makes sense to use some of the proceeds from the increase in the FFH-TRS to also slowly shrink the size of the FFH-TRS position each year. This allows them to have their cake and eat it too.
-
It would be interesting to know how Fairfax’s investment portfolio performed from 2010 to 2020 (total return). But I am not sure how helpful it would be for an investor in Fairfax today. The company, investment portfolio, and how they invest are all quite different today (yes, I am doing it again ). It is like studying Berkshire Hathaway’s investment in Dexter Shoes… what does it tell you about Berkshire Hathaway today? Buffett makes mistakes. He learns from them. As a result, Berkshire is a stronger company today. (Same with the Solomon Brothers purchase. The purchase of General Re. We could start with the purchase of that Textile Mill at the very beginning, if we wanted more examples.) My view is this is the same takeaway from how Fairfax invested from 2010 to 2020. Lots of mistakes. Lots of lessons learned. As a result, Fairfax is a stronger company today. And for Fairfax, given their mistakes were more recent, it is probably important to monitor what they are doing to ensure the lessons indeed were learned (I am talking about the big capital allocation decisions… not to nitpick every smaller decision they make).
-
@Haryana, you caught me When I do my posts, I like to work on the edges to help make my point. Having said that, I don’t think my comment is far off the mark. Perhaps I should have said… ‘The volatility is largely gone’. Absolute returns: Bottom line, using a 1-year time frame, it was common to see a 10% swing. That was my baseline. Using a 4-year average, the swing was 3%. Compared to the 1-year, that is a pretty small change. From my perspective. Relative returns: I also layered in one more factor to my thinking. And that is how Fairfax compares to P/C insurance peers (who have bond heavy portfolios). If I measured P/C insurance peers the same way, my guess is their swing was likely in the 2% range. Not that much different from Fairfax. Bottom line, Fairfax’s investment returns are not nearly as volatile as most investors think. When viewed through a 4-year or longer time frame. And when compared to peers.
-
In the coming months we will get more and better information on the impacts of the new Trump/US trade policy. It will be interesting to see if John Deere is the canary in the coal mine… or not. John Deere, a U.S. Icon, Is Undermined by Tariffs and Struggling Farmers https://www.nytimes.com/2025/09/04/business/john-deere-tractor-sales-down-farmers-struggle.html The tractor maker said that sales were down and that higher metal tariffs would cost it $600 million, while American farmers face dwindling overseas demand for some crops. …One of the country’s largest manufacturers is worse off now than it was six months ago. Last month, John Deere said net income in its most recent quarter was down 29 percent from a year earlier. Higher tariffs, primarily on steel but also on aluminum, have cost the company $300 million so far, with nearly another $300 million expected by the end of the year. This summer the company laid off 238 employees across factories in Illinois and Iowa. …After Mr. Trump announced steep tariffs on Chinese goods this year, China placed retaliatory tariffs on U.S. soybeans in March. Soy exports to China are down 51 percent this year, and the country hasn’t made any advance purchases of soybeans for the upcoming harvest. U.S. growers are expected to receive $3.4 billion less for their soybean crop than they did last year, according to the Agriculture Department. For many growers, the prices are so low that they will lose money on each acre planted. “How can companies and farmers plan for the long term when you don’t know what the cost of your inputs will be or what your market will look like in the weeks to come?” asked Tad DeHaven, a policy scholar at the Cato Institute, a think tank that favors free markets. “These businesses, whether John Deere or a craft brewery or anything in between, are trying to navigate this. They are trying to do the best they can to cut costs and to hang in there.” Everybody in the agriculture business is used to hard-to-control risks, as heat, rain, pests and diseases play a huge role in profitability, Ms. Owen said. What is proving even harder to control is what she termed “pen-stroke risk,” the risk that with a strike of a politician’s pen, everything will change again.
-
@Maverick47, I kind of keep saying the same thing over and over. One of the reasons for this is my understanding of the topic continues to evolve - it sometimes takes me 4 or 5 attempts (usually coming at the topic from a different angle) to fine-tune my thinking/point. And even then it is often incomplete (because Fairfax continues to tweak its business model). Much of what is happening today with Fairfax is still an emerging story - we have much to learn about the company. One of the questions investors are asking today is what has changed at Fairfax? This is a critically important question because it impacts how the company should be valued moving forward. One of the most significant differences at Fairfax today (compared to the Fairfax of 7 or 8 years ago) is the change in the quality (which I define as management/earnings power) of their equity portfolio (this included mark to market, associate and consolidated holdings). There really is no comparison in what Fairfax is doing today (and what they own today) to what they were doing back in 2014-2017 (and what they owned then). The results the equity portfolio is delivering is much higher today. On both a % and total $ basis. More importantly, this also suggests the results the equity portfolio will deliver in the future will also be much higher (than in the past) on a % and total $ basis. And then we need to include the benefits of compounding and time. (Compounding equities at 15% is much better than compounding bonds at 5%.) It really is an interesting set up. The parallel to this is what has been going on under the hood in the P/C insurance business. You have a much better handle on this than I do. But my guess is, similar to what we have seen with the equity portfolio, Fairfax has also been able to improve the quality of its P/C insurance business. What has changed at Fairfax? Everything. Equities. P/C insurance. Capital allocation. What does all of this mean? We are kind of in uncharted territory for Fairfax. They have had 5 very good years - so we know the current iteration of the company is very good. The question we will all learn in the coming years is are they back to being elite. If they can sustain their very good performance for a decade - well, that will get them to elite in my books.
-
Yes, the economic impact of BIAL on Fairfax is much less than for Fairfax India. Bottom line, it is a big number. The bigger point is Fairfax has ‘fixed’ its equity portfolio. It is now stuffed with very well run/profitable/quality companies. Many of these companies are compounding at a high rate of return. Some of this value is captured in the accounting results. Lots is not. The gap between economic result and accounting results is growing each year. The ‘hidden value’ is materially growing in size. The hidden value is compounding each year - this is important. There are a bunch of ways to look at this excess value that has built to date/will be built in the future. Increases the margin of safety of current stick price. Will materially boost future EPS and ROE. Most investors continue to largely ignore it. It really is a super interesting situation. This topic reminds me of the philosophical question/debate: “"If a tree falls in a forest and no one is around to hear it, does it make a sound?" Does the economic value that is being created by Fairfax (in excess of accounting value) matter to an investor? I.E. Is it only accounting results that matter? Wall Street answers yes to this question. Getting this wrong is one of the things that caused most ‘investors’ to miss out on making the big money with Berkshire Hathaway back in the 1980’s and 1990’s - I was one of those investors. Back then, I got four things wrong. I didn’t understand: Berkshire Hathaway's business model. How good management (Buffett) was at capital allocation. The difference/importance between economic and accounting earnings/results. How compounding works. As a result, I continually materially underestimated what Berkshire Hathaway would earn (economic earnings). And this caused me to materially mis-value the company (undervalue it). This caused two important problems for me: First, did I want to own the stock? Second, and more importantly, how big of a position should it be? The second was (with hindsight) the much better problem of the two. This was because Berkshire Hathaway was in my circle of competence. My problem was my investment framework/logic was completely wrong (immature?). I wasn’t being ‘conservative’ with my analysis back then. Rather, I was using a faulty investment framework/logic. Not being rational is not the same thing as being conservative. I suspect more than a few investors are making this same mistake with Fairfax today.
-
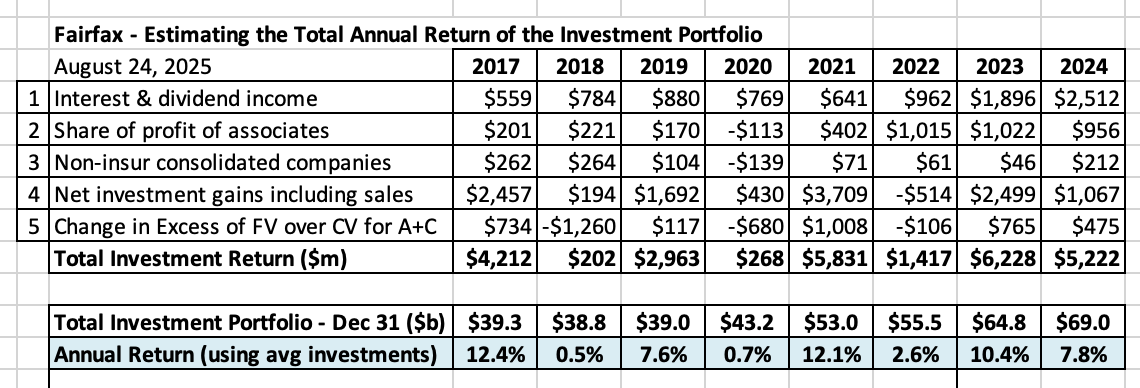
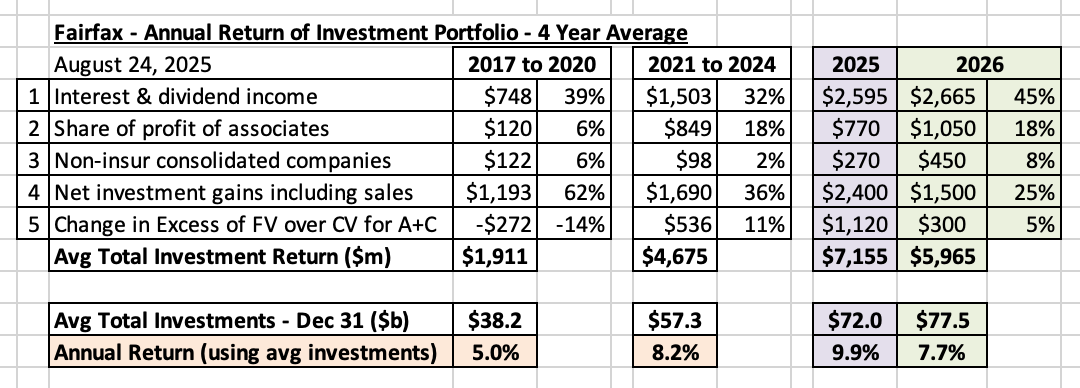
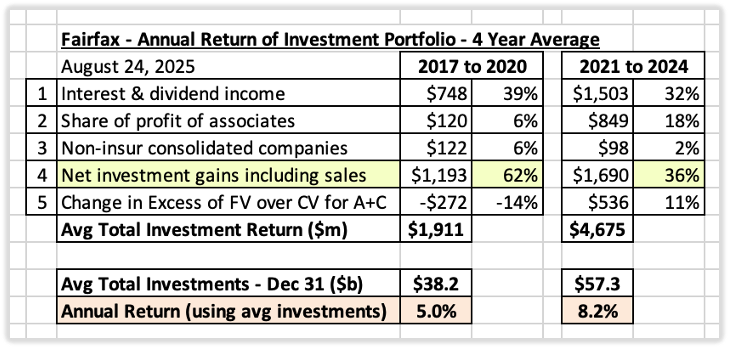
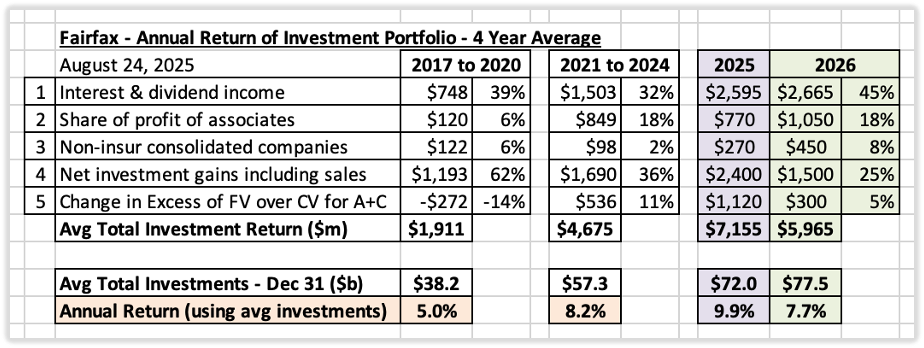
Are Fairfax’s investment returns volatile? This post is a sister post to the one I wrote yesterday... some of the material is in both. So I apologize in advance for being a little repetative. I like to lean out a little with some of my posts. I hope this one gets board members thinking and stimulates lots of discussion - because that is how we all learn and become better investors. “It ain’t what you don’t know that gets you into trouble. It’s what you know for sure that just ain’t so.“ Mark Twain Are you a speculator or an investor? Ask most people if they are a speculator or an investor... probably 90% will answer that (of course!) they are an investor and not a speculator. They probably even get annoyed that you would even ask the question - the answer being so obvious. What is interesting is if you look around what these same people actually do... most (better than 50%) likely think and act like a speculator, not an investor. The fundamental problem is much of what is taught by Wall Street encourages casino/speculative behaviour - and it is disguised as investing. So speculators think they are investors. (Please note, some days, what I reflect on some of my decisions, I wonder what I am.) Warren Buffett and Charlie Munger have been taking about this paradox for decades. With this as important context, let's explore a topic that most everyone has a firm opinion on. Are Fairfax’s investment returns volatile? That is the question we will explore in our post today. And no, this is not a trick question. This post might be a bit of a mind bender for some of you. Or perhaps I am a complete nut job. Anyways, you can decide which it is. From the gospel of Wall Street: Volatility = risk. Wall Street logic: The higher the volatility, the higher the risk. The lower the volatility, the lower the risk. Low volatility is equated with high quality. High quality gets a higher multiple. Investing is easy peasy. Below are Fairfax’s investment results for each of the past 8 years. Are the annual returns volatile? Yup. They look like a roller coaster ride - up and down. In 2017, the annual return was 12.4% (up big). In 2018, it was 0.5% (down big). In 2019, it was 7.6% (up big). In 2020, it was 0.7% (down big) Anyways, I think you get the picture. And this makes sense. We had bear markets in stocks in 2018, 2020 and 2022. And a historic bear market in bonds in 2022. Not surprisingly, the investment returns from 2018, 2020 and 2022 were lower for Fairfax. But guess what? The following year, the investment returns rebounded and were very good. This also makes sense. Summary: calculated using a 1-year time frame, Fairfax’s investment returns have been very volatile. Therefore, using Wall Street logic, Fairfax’s investment returns are low quality. And the stock deserves a low multiple. You can’t argue with the numbers and logic! Is our analysis done? Maybe not. Sorry, but I do have one more question. Why are we using one year as the time frame for our analysis? Now I understand that all publicly traded companies report results using a 1-year time frame. So using 1-year (annual) numbers is a great time frame to use when collecting the data to be used in the analysis. It is very easy and convenient. But does that make 12 months the right time frame to use to analyze and evaluate investment performance? Are you a speculator or an investor? Speculators have very short time-frames. 12 months is perhaps a good number to use for this group. It might even be too long. This post is not being written for speculators. So we can ignore them. This post is being written for investors. What is an appropriate time frame for an investor to use when they invest? Is it one year? No of course not. That is much too short. It would be idiotic for an investor to use a 1-year time frame. Most investors are likely using at least a 3 to 5 year time horizon when they invest in a stock. Their analysis will use a similar 3 to 5 year time frame. Perhaps even longer. And that is because a stock is worth the total of all future cash flows (from today to eternity) discounted to the present value using an appropriate discount rate. Is the next year what matters? No. What matters is from today to eternity - that is a much longer time frame than one year. Not complicated. What does this have to do with Fairfax? For an investor, using a one year time frame to analyze and evaluate investment returns is obviously a really stupid thing to do. This time frame is too short (ridiculously so). What happens if we use a 2-year timeframe to calculate Fairfax’s investment results? For an investor, this is also too short of a time frame to use. But for fun, let’s use it and see what happens. We grouped Fairfax’s investment results into the following 2-year periods: 2017 and 2018 2019 and 2020 2021 and 2022 2023 and 2024 If we use a 2-year average, are Fairfax’s investment results volatile? Nope. Compared to the 1-year time frame, Fairfax’s results have largely smoothed out. In 2017/2018, the average annual return was 6.1%. In 2019/2020, it was 4.0% (down a little). In 2021/2022, it was 7.1% (up a little). In 2023/2024, it was 9.0% (up a little more). Bear markets in equities in 2018, 2020 and 2022 and a historic bear market in bonds in 2022… looking at 2-year returns these events magically disappear from view. I think that tells us something… really important. Something Buffett has always understood. When we use an appropriate time frame, we learn that investing in equities is not nearly as volatile for investment returns as generally thought. And the volatility seen in Fairfax's 2-year returns is likely similar to that of P/C insurance peers (who invest in primarily in fixed income). Summary: calculated using a 2-year time frame, Fairfax’s investment returns have been relatively smooth. Therefore, using Wall Street logic, Fairfax’s investment returns are high(er) quality. And the stock deserves a high(er) multiple. Now let’s get crazy. What happens if we use a 4-year timeframe to calculate Fairfax’s investment results? We grouped Fairfax’s investment results into the following 4-year periods: 2017 to 2020 2021 to 2024 If we use a 4-year average, are Fairfax’s investment results volatile? The volatility is completely gone. This time frame also makes it very easy for us to understand Fairfax’s investment results. This is critically important when it comes to understanding the business and evaluating the management team. From 2017 to 2020, Fairfax generated an average annual return on its investment portfolio of 5.0%. This return makes sense given all the headwinds the company was experiencing back then: Central banks were executing a zero interest rate policy. As a result, bond yields were historically low. Fairfax’s equity portfolio was also underperforming: The last short was removed at the end of 2020. Fairfax’s equity portfolio was stuffed full of under performers. Given all the headwinds Fairfax was facing in the 2017 to 2020 time period, it is amazing that Fairfax was still able to generate an annual average total return of 5% on its investment portfolio. From 2021 to 2024, Fairfax generated an average annual return on its investment portfolio of 8.2%. This return makes sense given the changes that have happened in recent years: Central banks ended their zero interest rate policy. As a result, bond yields have normalized to a much higher rate. Interest income has spiked. Fairfax fixed its investment framework. Underperforming equity holdings were fixed/dealt with. New purchases have performed very well. Capital allocation at Fairfax over the past 5 years has been best-in-class among P/C insurance companies. As a result, Fairfax has been able to generate an exceptional annual average total return of 8.2% on its investment portfolio. My guess is Fairfax is now earning a ‘normalized’ return on its investment portfolio of about 8%. This is likely a good run-rate to use moving forward. Summary Are Fairfax’s investment returns volatile? How you answer this question will provide some keen insight into whether you are a speculator or an investor. The answer depends on what time frame you use to analyze the numbers. For speculators, using a time frame of one year or less, Fairfax’s investment returns will look very volatile. For investors, using a time from of two or more years, Fairfax’s investment returns look relatively smooth. This has important implications. Using a 2-year time horizon, Fairfax's investment returns are high quality. They deserve a high multiple. Of course, this is not how Wall Street thinks or works. Lots of people are speculators masquerading as investors. Is that you? But here is the best part. If you ask ‘investors’ if Fairfax’s investment results are volatile most of them will say ‘yes’. And likely add ‘very.’ Even those who have read this post. And that is because wrong lessons (once learned) are very hard to unlearn. Mark Twain sure was one smart dude. Warren Buffett has been talking about this topic for decades. The fact his thinking has gotten very little traction is very informative. It shows you how hard it is to change the dominant narrative - even when it is obviously wrong.

-
For those who might have missed it when it was initially posted, below is a summary of Fairfax's investment in Blizzard Vacatia. Blizzard Vacatia – Partnering with an Entrepreneur / Boosting Yield of Fixed Income Portfolio August 1, 2025 Update from Wade Burton on the investment in Blizzard Vacatia. It’s early days in the timeshare investment, Berkeley, run by Caroline Shin, but so far, it has exceeded expectations. Berkeley has approximately 125,000 available room nights per month. They started the year at virtually nil occupancy for overnight stays. In month one, Caroline brought that number to 10%, the next month 20%, and the third month 35%. I’m happy to report year to date operating income has already reached our full year expectations. Again, outstanding and capable partners doing an excellent job for Fairfax shareholders. Wade Burton – Fairfax Q2-2025 conference call ————— July 30, 2025 One of Fairfax’s largest investments in 2025 (January) was the purchase of the Berkley Group, one of the largest independent timeshare companies in the US. With this deal, Fairfax partnered with Caroline Shin and her team at Vacatia. The partnership is called Blizzard Vacatia. This is a private holding that is equity accounted by Fairfax. Fairfax provided the majority of the financing to acquire the Berkley Group. Vacatia is providing the operational expertise to run and maximize the value creation from the assets of the Berkley Group. “Blizzard Vacatia, through its subsidiaries, is engaged in the development, sales, marketing and rental of timeshare resorts.” Fairfax 2024AR Fairfax invested a total of $835 million in Blizzard Vacatia, as follows: Fairfax’s investment is structured in an interesting way. It is a combination of debt and equity. The annual interest income is meaningful. And there is additional upside potential with the equity. Growing the average yield on their fixed income portfolio This investment (along with the acquisition with Kennedy Wilson of the real estate loan portfolio/infrastructure from PacWest) provides a couple of good examples of how Fairfax is over time thoughtfully shifting some of their fixed income portfolio from government bonds to higher yielding corporate securities. This helps improve the average yield on their fixed income portfolio. ————— Who is Vacatia? Below is an article that discusses Vacatia’s recent purchases and emerging capabilities. Vacatia’s Bold Move: A New Era for Independent Resorts - https://resorttrades.com/vacatias-bold-move-a-new-era-for-independent-resorts/amp/ The timeshare industry is undergoing significant change with Vacatia’s acquisition of The Berkley Group and Daily Management, a move that strengthens its position as a key player in the independent resort sector. With the acquisition, Vacatia’s portfolio now includes 460,000 owners, 2,500 associates, and over 11,000 units across 13 states. This means Vacatia is now one of the top five vacation ownership companies in the United States. The acquisition combines Berkley’s expertise in sales, Daily Management’s experience in resort operations, and Vacatia’s technology and rental solutions. Shin sees this integration as a way to provide independent resorts with more flexibility and support. “Independent resorts now have a partner that has every capability of helping an independent resort, large or small,” she says. “We are celebrating the independent resorts, giving them the ability to remain independent, but at the same time leveraging the scale that comes with Vacatia having their back.” One key area where Vacatia sees opportunity is in technology-driven efficiencies, which have historically been more difficult for independent resorts to implement. Shin points to maintenance, housekeeping, reservations, and owner services as examples of areas that can be improved with better digital tools. Who is Caroline Shin, CEO and Co-founder of Vacatia? Caroline co-founded Vacatia to bring innovation and new ideas to timeshares. As a seasoned technology and hospitality executive, Caroline already pioneered well-known travel programs that are now mainstays in the hospitality industry. She was a member of the founding team of Hotwire.com, where she led product and technology functions to develop one of the first online travel agencies in the world. She led CRM and revenue management for Starwood Hotels & Resorts Worldwide, launching a first-of-its-kind pricing and marketing platform that empowered hotels to make impactful, data-driven decisions. At Sentient Jet, she delivered industry-leading customer service by cultivating deep client relationships combined with algorithmic analysis of each flight plan to forecast service issues before they occur. She was also a technology and strategy consultant at Accenture and Scient, advising both Fortune 500 and startup clients to adapt their business online. Caroline is a member of the Board of Directors of the American Resort Development Association (ARDA) and holds a degree in nuclear engineering from MIT. - https://www.vacatiapartnerservices.com/blank ————— On Feb 13, 2025, the Fairfax’s investment in Blizzard Vacatia was discussed on the investing forum ‘Corner of Berkshire and Fairfax.’ Click the link below for more: https://thecobf.com/forum/topic/16427-fairfax-stock-positions/page/94/#findComment-601100 ————— Comments from Wade Burton about Blizzard Vacatia from Fairfax’s Q4-2024 conference call. Second, I wanted to discuss an investment that closed just after year-end 2024. We invested in the largest independent timeshare company in America called the Berkeley Group. Caroline Shin and her team at Vacatia are Fairfax partners here. The investment is underpinned by asset value, where we directly own 4,950 full-service vacation units mostly located in Las Vegas, Orlando, and other high-traffic vacation areas in the U.S. The opportunity here is for Caroline and her team to generate overnight rental income from the huge stock of nightly vacancies. Her experience designing Hotwire online booking software and then as an executive at Starwood is perfect for what Vacatia is trying to do with Berkeley. In fact, prior to this acquisition, her group at Vacatia made investments in five smaller timeshare assets from 2019 to 2024, and in each case, they were very successful at significantly growing EBITDA in a short period of time. The total deal was $835 million, which we funded with a $275 million five-year preferred note at 13.5%, a $365 million seven-year senior secured note at 9.5%, and $170 million mortgage warehouse loan with a five-year maturity at SOFR plus 400. The $50 million equity is funded 50% by Fairfax and 50% by Caroline and her partners. We are absolutely thrilled to be her partner on this. Wade Burton – Fairfax Q4-2024 Conference Call Comments from Prem about Blizzard Vacatia from Fairfax’s 2024AR. Early in 2025 we invested in the Berkley Group, the largest independent timeshare company in the United States. Caroline Shin and her team at Vacatia are partners with us on this investment. This investment results in us owning 4,950 full-service vacation units mostly located in Las Vegas, Orlando and other high-traffic vacation areas in the U.S. There is great opportunity for Caroline and her team to generate additional overnight rental income from the huge stock of nightly vacancies. In fact, her group at Vacatia made investments in five smaller timeshare assets from 2019 to 2024 and this strategy helped to generate strong growth in EBITDA and free cash flow. Her experience designing Hotwire online booking software and as an executive at Starwood is perfect for what Vacatia is trying to do with Berkley. Our total cash investment was $835 million comprised of a senior secured loan, preferred shares, a mortgage-backed loan and common shares. We are very excited to work together with Caroline and her team at Vacatia on this investment. Prem Watsa – Fairfax 2024AR
-
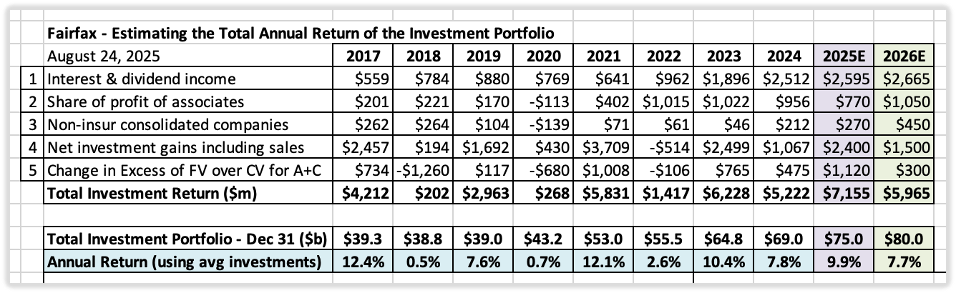
Investment Portfolio: Review of Returns From 2017-2024 and Estimates for 2025 and 2026 In this post we will dig into the returns Fairfax has been able earn on its investment portfolio to see what we can learn about the company. Our analysis has been broken into 7 parts: Part 1: Introduction Part 2: How does Fairfax invest? Part 3: What methodology should be used? Part 4: The past - 4-year snapshots (2017 to 2020 and 2021 to 2024) Part 5: The future - Estimates for 2025 and 2026 Part 6: Can we come up with a normalized rate of return? Part 7: Conclusion Appendix: 10-year summary (2017 to 2026E) ———— Part 1: Introduction Fairfax has a wonderful business model Is this hyperbole? No. It is fact. Fairfax was established in 1985 – it has been in business for 39 years. In 1985 there were about 6,000 listed companies in the US. At the end of 2024, only 600 of these companies remained. Of the survivors, which companies have performed the best? Over the past 39 years, the per share market value of Fairfax (US$) has grown at a rate of 19.2% compounded annually. Of the 6,000 listed companies from 1985, Fairfax has been the 8th best performer. That is an amazing result. (Source: Fairfax’s AGM – April 2025) Two questions jump out: How was Fairfax able to deliver such outstanding returns for long term shareholders? How is the company positioned today? The fact that most investors can’t answer either question is informative. IMHO, Fairfax continues to be underfollowed and misunderstood. Of course, this impacts how the stock is being valued today (it usually means the stock is being undervalued). Let’s try and understand how Fairfax has been able to deliver such outstanding results over such a long time frame. A good place to start is by looking at Fairfax’s two business engines and their impact on the earnings of the company: The underwriting profit it earns from its P/C insurance business. This can be measured by looking at the combined ratio (CR). This is pretty straight forward. The total investment return it earns from its investment management business. This can be measured by summing a number of different items. This is a little more complex. In this post we will review the total return Fairfax earns on its investment portfolio – in total dollars and as a percent. We will start by looking at the past (2017-2024). We follow this up with forecasts for 2025 and 2026. We finish with what this teaches us about Fairfax and its business model. ———— Part 2: How does Fairfax invest? Before we get into the numbers, we need to zoom out and start by looking at the big picture. How big is Fairfax’s total investment portfolio? At December 31, 2024, Fairfax had an investment portfolio with a value of about $69 billion. How does Fairfax invest its investment portfolio? At December 31, 2024, Fairfax had about $47 billion of its total investment portfolio invested in fixed income securities, which was 68% of the total. About $22 billion was invested in equities (broadly defined), which was 32% of the total. How does this split compare to other P/C insurance companies? This is important. Most P/C insurance companies invest exclusively in fixed income instruments – fixed income usually represents about 95% of their total investment portfolio. The remaining 5% is invested in a variety of non-fixed income instruments. With a significant allocation to equities, Fairfax invests its investment portfolio in a very different way than traditional P/C insurance companies. The model used by Fairfax today to invest its investment portfolio is unique in the P/C insurance industry. The model Fairfax employs today is similar to the one used by Berkshire Hathaway when it was a much younger company (Berkshire Hathaway has morphed in recent decades into a large conglomerate). Why does Fairfax invest in equities? Equities deliver a much higher return than fixed income over time. This is a fact. Fairfax invests in equities because it will allow the company to deliver a higher return on its investment portfolio over time (compared to a 100% allocation to fixed income). In turn, this will result in higher earnings for the company. And higher earnings mean a higher stock price. In short, investing in equities is good for long term shareholders. Why don’t all P/C insurance companies invest a large part of their investment portfolio in equities? That is a great question. It seems like such a no brainer. My guess is it has something to do with their inability to handle short term volatility. We have discussed this topic in other posts, so we will not go into further detail here. Ok. To summarize, Fairfax has a very large investment portfolio ($69 billion). And they invest a large part of it in equities (32%), which is very different compared to P/C insurance peers. In theory, this should allow Fairfax to earn outsized returns on its investment portfolio (compared to P/C insurance peers). Is this what is happening in the real world? What do the historical numbers tell us? ———— Part 3: What methodology should be used? Before we can do our historical calculations, we first need to decide on the methodology we will use. To do this we need to answer the following three questions: Are we calculating the economic or accounting return? What inputs should be used? What time frame should be used? What return should be calculated - economic or accounting? Most investors and analysts focus on the accounting return. It is easy to calculate. And it is safe. Warren Buffett (at Berkshire Hathaway) suggests investors focus on economic return. It is a little more difficult to calculate. And it requires some additional explanation. Of course, economic return is a bridge too far for most investors and analysts – they ignore it. With our post today, we will focus on the economic return. Because economic return is what really matters to long term shareholders. What inputs should be used to calculate the economic return? The total economic return earned by Fairfax on its investment portfolio will be calculated using the following 5 inputs. All are reported each quarter by Fairfax: Income streams: Interest and dividend income Interest income earned from the fixed income portfolio. Dividend income earned from the mark to market equity holdings. Share of profit of associates Fairfax’s share of pre-tax earnings from its associate holdings: Eurobank, Poseidon, EXCO Resources and Fairfax India (their associate holdings). Non-insurance consolidated companies Pre-tax earnings from Recipe, Sleep Country, Peak Achievement, Grivalia Hospitality, TC India, Meadow Foods, AGT Food Ingredients and Dexterra. Net gains (losses) on investments Unrealized gains from the investment portfolio (stocks and fixed income). Large realized gains from asset sales and revaluations (including insurance). The 4 income streams above are part of Fairfax’s accounting results - they flow through to earnings and book value. We also include one more item in our calculation: The annual change in ‘excess of fair value over carrying value’ for non-insurance associate and consolidated holdings This item is not captured in Fairfax’s accounting results (earnings or book value). So why include it? Because it is real economic value that is being created by Fairfax each year (i.e. if they owned less than 20% of these equities these numbers would be included in their accounting results.) Fairfax regularly reports this number because they think it is an important piece of information. Here is how Fairfax describes this item: “Those amounts (excess of FV over CV), while not included in the calculation of book value per basic share, are regularly reviewed by management as an indicator of investment performance.” Fairfax 2024AR Important: I think my calculation of total economic return is conservative (even including excess of FV over CV). And that is because it is likely understating the results being delivered over time by some large associate and consolidated equity holdings. A good example is BIAL (the third largest airport in India) where Fairfax has a 74% interest. I don’t want to get sidetracked - this is just something to keep in mind. Ok. We have the 5 inputs we will use in our model. Before we get into the calculations, we need to answer one more question. What time frame should we use? This is a critically important question. And the answer is not obvious. To calculate returns To calculate Fairfax’s investment returns using a 1-year time frame makes the most sense. And this is because publicly traded companies report results on an annual basis. This makes it very easy to get the needed numbers. To analyze returns What is the best time frame to use to analyze Fairfax’s return on its investment portfolio? Your answer to this question will depend on the type of investor you are. Are you a speculator or an investor? If you are a speculator – the best time frame to use in your analysis might be one year (and quarterly might be even better). Easy peasy. If you are an investor – your analysis will be longer term. Warren Buffett suggests 5 years is a good time frame to use to evaluate the results and the performance of a management team. Of course, we are coming at this from the perspective of an investor. Not a speculator. Therefore, we want to use a time frame that will give us the best information and that will also provide the best insights into this important part of Fairfax’s business. We decided to use a 4-year time frame. Ok. The focus is on economic. A 4-year time frame will be used to analyze results. ———— Part 4: The past - 4-year snapshots (2017 to 2020 and 2021 to 2024) We will start with a look into Fairfax’s past. With our analysis we will go back 8 years, which gives us two 4-year time frames: 2017 to 2020 2021 to 2024 4-Year Average - 2017 to 2020 From 2017 to 2020, Fairfax earned an average return on its investment portfolio of 5.0% per year. This return makes sense. During this time frame, Fairfax experienced a number of headwinds which impeded the return it was able to generate: Fixed income: Global central banks were executing a zero interest rate policy. Crazy low interest rates resulted in crazy low bond yields/interest income. Equities: Fairfax’s equity portfolio was underperforming. The last short position was removed in late 2020. Fairfax’s equity portfolio was stuffed with underperformers/cyclicals. Importantly, the largest driver of investment returns – by far - was investment gains, at 62%. Bottom line, a messed up investment framework (hedges/shorts and equities) was causing Fairfax’s investment portfolio to underperform. Given the force of the headwinds, it is surprising that Fairfax was still able to deliver an average return as high as 5.0% per year from 2017 to 2020. 4-Year Average - 2021 to 2024 From 2021 to 2024, Fairfax earned an average return on its investment portfolio of 8.2% per year. This return also makes sense. During this time frame, all of the headwinds from 2017 to 2020 had flipped to tailwinds, which enhanced the return Fairfax was able to generate: Fixed income: Global central banks abandoned their zero interest rate policy. The inflation genie got out of the bottle. Higher interest rates resulted in higher bond yields/interest income. Fairfax was positioned exceptionally well for higher interest rates – at the end of 2021, the average duration of their fixed income portfolio was 1.2 years. Equities: Fairfax began fixing their investment framework beginning in about 2018. It was a slow process. Underperforming equity holdings (bought before 2018) were fixed/dealt with. New equity purchases since 2018 have performed very well. Fairfax has diversified the sources of its investment returns - it is not so reliant on investment gains. Capital allocation at Fairfax over the past 5 years has been best-in-class among P/C insurance companies. As a result, Fairfax has been able to generate an exceptional average total return of 8.2% per year on its investment portfolio. What did we learn? From 2017 to 2020, despite facing significant headwinds, Fairfax was still able to earn a respectable average total return on its investment portfolio of 5.0%. From 2021 to 2024, with headwinds reversing to tailwinds, Fairfax was able to earn a much higher average total return on its investment portfolio of 8.2%. Importantly, the sources of earnings are nicely diversified (not so reliant on one item – investment gains). ———— Part 5: The future - Estimates for 2025 and 2026 For 2025, my current estimate is Fairfax will earn a total return on its investment portfolio of 9.9%. We already have 6 months of reported results (which have been very strong). Fixed income: The average yield is currently about 5.1%. Equities: The quality/earnings power of the equity portfolio continues to shine through. 2025 is shaping up to be another exceptional year for Fairfax. For 2026, my current estimate is Fairfax will earn a total return on its investment portfolio of 7.7%. Given the size of the return expected in 2025, we are being conservative with our estimate for 2026 (specifically with the investment gains bucket). Fairfax is generating very good returns on its investment portfolio. The sources of returns are diversified – and becoming more so. ———— Part 6: Can we calculate a 'normalized' rate of return? What is a ‘normalized’ rate of return to use moving forward? This might be the most important part of the analysis. By ‘normalized’ we mean in a normal (or average) type of year. A number that can be used as an input in a model. My view is 8% is likely a good mildly conservative ‘normalized’ estimate to use of what Fairfax will be able to earn on its investment portfolio moving forward. As a reminder, this is economic return – not accounting return. What is the single biggest reason why I think 8% is the right number? It is because of the management team at Fairfax. Over the past 5 years, their capital allocation decisions have been best-in-class among P/C insurance companies. This bodes well for the returns Fairfax will be able to generate on its investment portfolio moving forward. ———— How does that compare to P/C insurance peers? Fairfax is earning a much higher return in its investment portfolio than P/C insurance peers. Fairfax is earnings about 8% per year. P/C insurance peers are earnings about 5.5% per year (or lower). This gives Fairfax a return advantage of about 2.5% per year. Leverage Investments to common shareholders’ equity = 2.8x Leverage gives Fairfax a 7% advantage over peers (2.5% x 2.8x). Fairfax’s return advantage versus peers is magnified due to investment leverage. ———— Part 7: Conclusion Fairfax has a large investment portfolio ($69 billion at December 31, 2024). Unlike most other P/C insurance peers, they invest a big chunk of it in equities (32%). Fairfax is very good at how they invest – over the 4-year period from 2021 to 2024, Fairfax has earned an average rate of return of 8.2%. My estimate for 2025 is 9.9%. My guess is Fairfax is positioned today to deliver an average ‘normalized’ annual return on its investment portfolio of about 8% moving forward. This is considerably higher return than P/C insurance peers who only invest in fixed income instruments (perhaps with an average normalized return of around 5.5%). Fairfax been able to deliver CAGR on 19.2% over the past 39 years. At the beginning of this post, we asked two questions: How was Fairfax able to deliver such outstanding returns for long term shareholders? How is the company positioned today? I think we have found some answers. Fairfax has been able to deliver outstanding returns for long term shareholders because of how it invests its investment portfolio. This allows the company to earn a much higher average return than P/C insurance peers. This advantage is magnified due to its investment leverage and the power of compounding. Of course, this is just one important part of the answer. There is much more driving Fairfax’s success: Culture. Structure. Family control. High quality P/C insurance business. Capital allocation. External relationships. Fairfax has a wonderful business model. It has spent the past 39 years fine-tuning it. How is the company positioned today? In short, it has never been positioned better. That is a great set-up for long term shareholders. ———— Appendix: 10-year summary (2017 to 2026E) Below is a summary of the economic returns that Fairfax has earned on its investment portfolio for the 8-year period (2017 to 2024). Also included are estimates for 2025 and 2026. This provides a 10-year view. We also provide the build for each year – the 5 inputs we use to come up with the economic return for each year.
-
@This2ShallPass, as investors, we all need to find mental models that work for us. I find the simpler I can keep things the better. I also try to focus on what I think I know. Here are some top line thoughts: At a very high level, over the past 10 years I think Fairfax has been modestly improving the quality of its overall P/C insurance business. This suggests they should post better results moving forward (over the next decade) than they posted over the previous decade (CR). At a very high level, the quality of Fairfax’s equity holdings (as a basket) is much higher than what existed back in 2017 (as a basket). Management. Balance sheet. Profitability. This is a big, big deal. Bottom line, the equity portfolio is positioned to deliver solid to strong returns in the coming years (like they have been in recent years). In terms of capital allocation, I think Fairfax is best in class among P/C insurance companies. Their execution the past 5 years has been exceptional. My guess is they continue to make good decisions. This will drive significant value creation in the coming years. I terms of trying to forecast specific numbers, my crystal ball looks out one, maybe two years. My guess is Fairfax is currently generating a ‘normalized’: CR = 94% (reserve releases = 1 or perhaps 2 CR points) Total return on its investment portfolio of 8% (including excess of FV over CV). ‘Normalized’ = in a normal year (which rarely happens).
-
@This2ShallPass, it is an interesting exercise to think through some of these metrics. I have a couple of questions: 1.) What time frame are you using for the inputs for your model? Is it an average for the next 5 years? I.E. 2026 to 2030? Or is it what you expect in a specific year, like 2027 or 2028? Average CR = 97? Average yield on bond portfolio = 4% 2.) For your CR estimate of 97, what is your estimate for reserve releases? My guess is Fairfax’s reserves are in pretty good shape today… which suggests reserve releases might be pretty healthy in the coming years. 3.) How are you thinking about all the ‘hidden value’ currently residing on Fairfax’s balance sheet. Excess of FV over CV for associate and consolidated holdings is sitting at $2.4 billion at June 30, 2025. This doesn’t include holdings like BIAL, which appear undervalued today. This suggests we should see pretty sizeable realized gains in the coming years. 4.) What is your expectation for interest rates? To use an average yield of 4% from here (it is 5% today) suggests you expect the average yield on Fairfax’s fixed income portfolio to drop well below 4% in the coming years (to get to a 4% average).
-
An untold story for Fairfax is how much cash the various investments are spitting out today. Some are visible. Others are not. Fixed income is yielding 5.1%. And the equities are now a significant source of cash for Fairfax. Examples: selldown of the Eurobank position in Q1. Dividend from Eurobank in Q2. Quarterly dividend payments from Poseidon. Etc. In 2024, examples were the initiation of the dividend from Eurobank. Poseidon payments. The significant one time dividend payment from Digit in Q4 (as part of their IPO). There are lots more… these are just some quick examples that came to mind. Of course, asset sales are another significant source of cash each year. The investment portfolio has now become a significant source of cash for Fairfax. This is a new/emerging story. With ‘old Fairfax’ fixed income was generating much less cash for Fairfax. And equities were uses of a significant amount of cash. The swing is very large.
-
@Hoodlum, good catch. No, I have not included the gain from the sale of Praktiker. That should result in a nice realized gain in Q3.
-
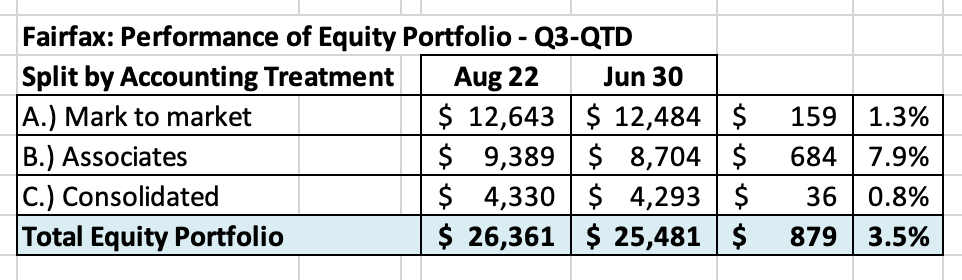
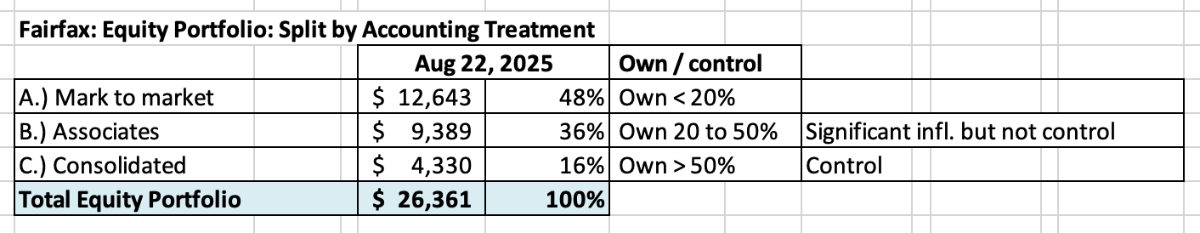
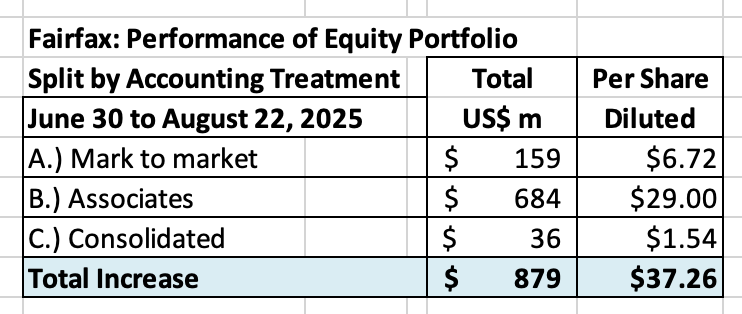
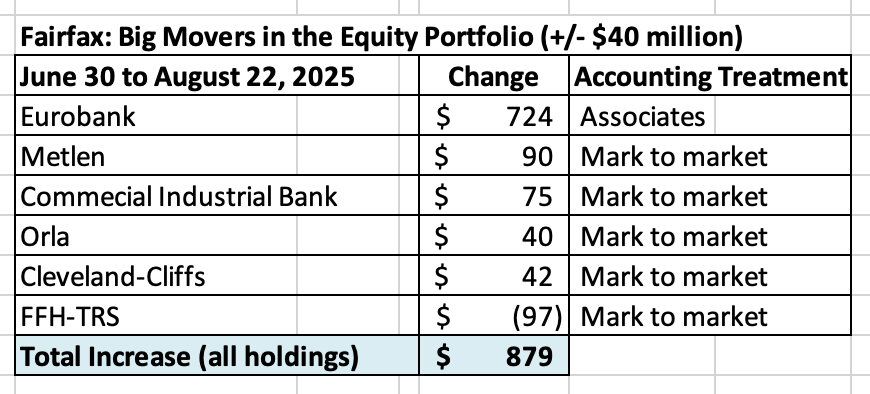
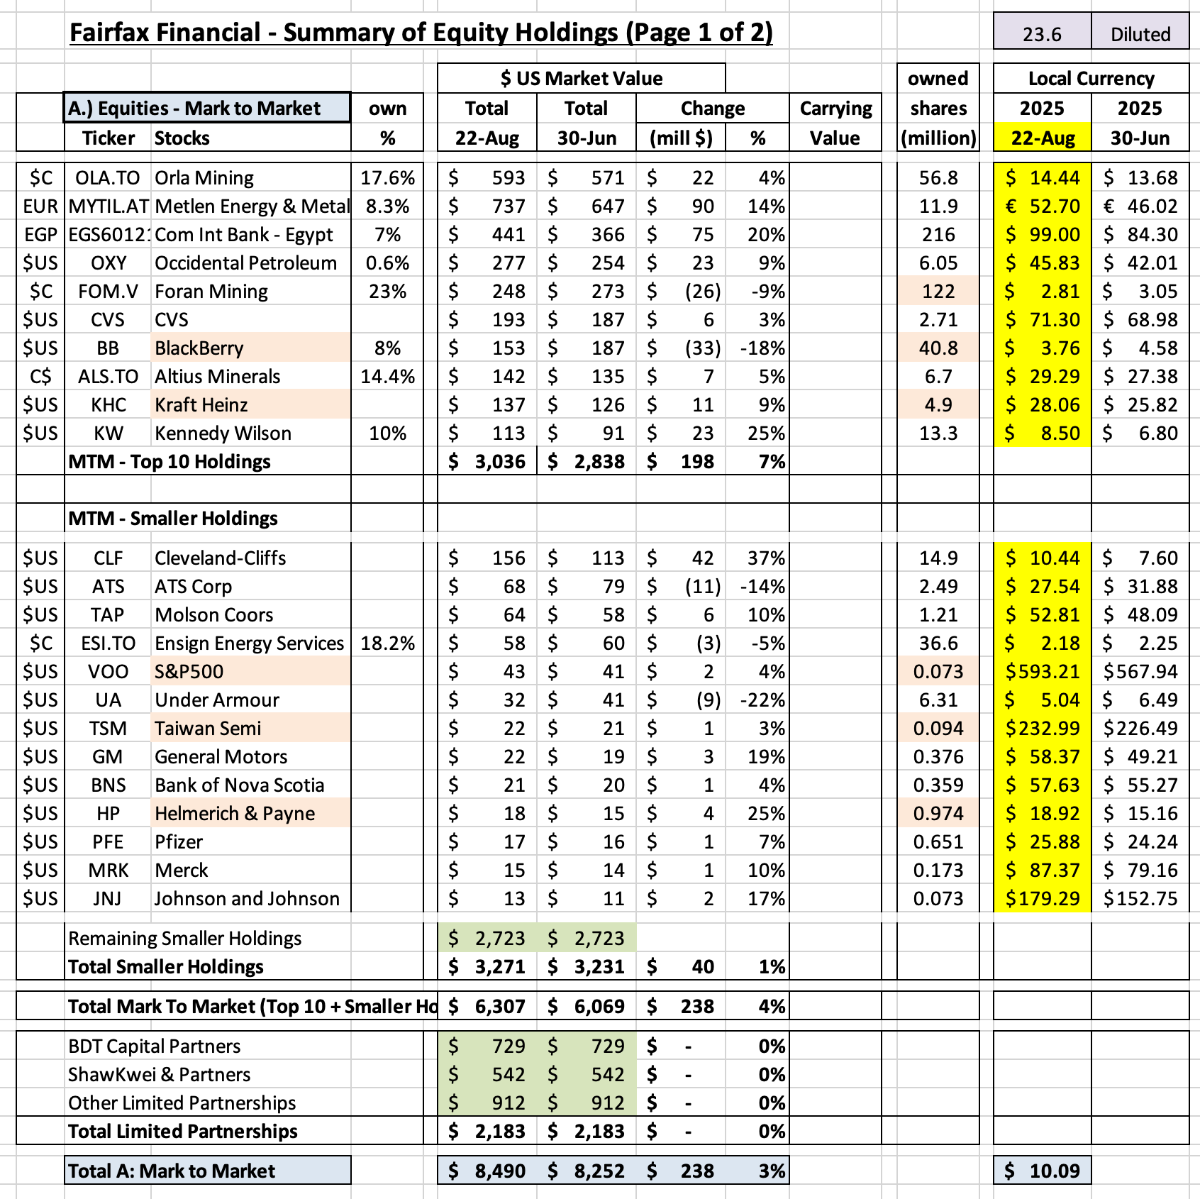
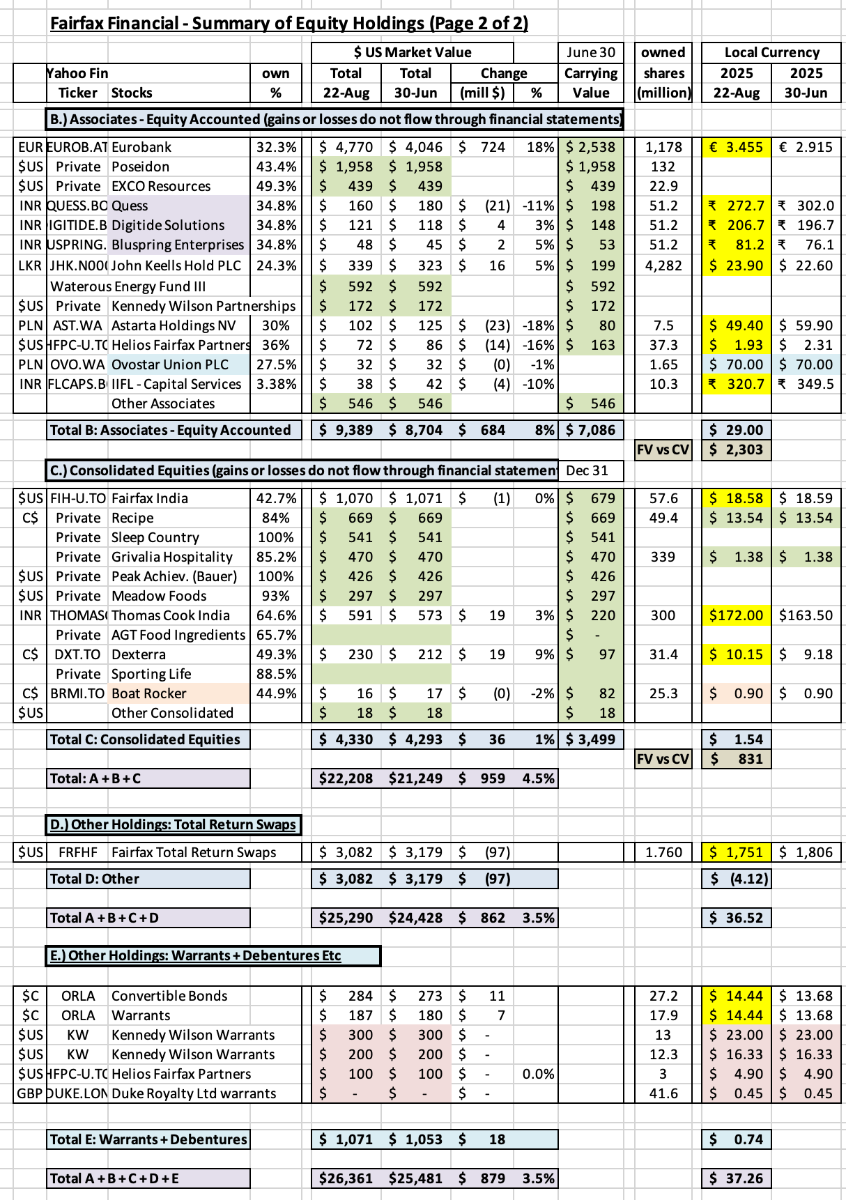
Estimate of change in MV of Fairfax’s equity portfolio in QTD-Q3, 2025 (to Aug 22) A warning. When looking at Fairfax’s equity holdings, what matters to investors is the underlying business performance achieved by the holdings over time. Not the quarterly change in market value. Short term (quarterly) changes in market value will be volatile. As a result, short term (quarterly) changes in market value should be viewed with an appropriate amount of scepticism by investors. So why track quarterly changes? Because it is interesting. And it can provide some insight into one of Fairfax’s large income streams - investment gains (losses) - prior to the release of quarterly earnings. Importantly, over time (like a couple of years), the change in the market value of Fairfax’s equity holdings should roughly match the change in their intrinsic business value. ----------- From June 30 to August 22, 2025 (QTD-Q3), Fairfax’s equity portfolio (the holdings that I track) has increased in market value by about $879 million (pre-tax), or 3.5%. In Q1-2025, the increase in market value was $785 million (pre-tax), or 3.5%. In Q2-2025, the increase in market value was $1.96 billion (pre-tax), or 8.5%. This puts the total YTD-2025 increase in Fairfax equity portfolio at about $3.6 billion, or 16%, or $154 per diluted FFH share (pre-tax). Please note, my tracker does not capture the value creation of some of Fairfax’s private holdings. This means my numbers are understated. To state the obvious, Fairfax’s equity holdings have performed exceptionally well over the first 8 months of 2025. The equity portfolio had a total value of about $26.4 billion at August 22, 2025. Included in our estimates are details from Fairfax’s Q2-2025 interim earnings report and 13F report. Notes: The FFH-TRS position is included in the mark to market bucket and at its notional value (this position has a market value of $3.1 billion). Convertible bonds, warrants and debentures are also included in the mark to market bucket. Digit: My tracker does not include Digit, Fairfax’s publicly traded P/C insurance company in India. Part of Fairfax’s ownership position in Digit is market to market. Digit’s shares were up a small amount QTD-Q3. Currency: US$ weakness has been a tailwind for Fairfax in 2025. Where the benefit shows up in reported results is a little complicated (net income or OCI). The ‘tracker portfolio’ is not an exact match to Fairfax’s actual holdings. It is useful only as a tool to understand the rough change in value of Fairfax’s equity portfolio (and not the precise change). Split of holdings by accounting treatment About 48% of Fairfax’s equity holdings are mark to market - and will fluctuate each quarter with changes in equity markets. The other 52% are Associates and Consolidated holdings. Split of total gains by accounting treatment The total change is an increase of about $879 million = $37/diluted share (pre-tax) The mark to market change is an increase of about $159 million = $6.72/ diluted share. What were the big movers in the equity portfolio in Q2, 2025? Eurobank continues its excptional run in 2025 (and the past 5 years). Other strong performers QTD were Metlen, CIB, Orla and Cleveland-Cliffs. The biggest laggard was FFH-TRS. Excess of fair value over carrying value The excess of FV over CV for non-insurance associate and consolidated holdings is about $3.1 billion or $133/diluted share (pre-tax). It was $1.5 billion at December 31, 2024. It is up significantly in 2015 (about 100%). The 'excess of FV to CV’ has been materially increasing in recent years. This is economic value that has been created by Fairfax that is not captured in accounting value (earnings or book value) – it is one good example of how annual EPS and book value is understated at Fairfax. (Note, the carrying value we use in our tracker for associate and consolidated holdings is from June 30, 2025 so our number will likely be a little high). Excess of FV over CV = $3.1 billion = $133/diluted share (pre-tax) Associates = $2.3 billion Consolidated = $0.8 billion Equity Tracker Spreadsheet explained: We have separated holdings by accounting treatment: Mark to market Associates – equity accounted Consolidated Other Holdings – total return swaps and warrants/debentures The value of each holding is calculated by multiplying the share price by the number of shares. All holdings are tracked in US$, so the values of non-US holdings have been adjusted for currency. This spreadsheet contains errors. It also contains some information that is dated (like the carrying value for associate and consolidated holdings). Please keep this in mind. The spreadsheet is updated as new information becomes available.
-
@dartmonkey, good point. When investors calculate the total return of Fairfax’s investment portfolio are they calculating the accounting or the economic return? They are very different numbers. And when investors look at the volatility of the returns from Fairfax’s investment portfolio why is 1-year the time frame used? Is this the right timeframe for an investor to use? (A 1-year timeframe makes sense for a speculator to use.) What is interesting is using a 2-year timeframe (which is still incredibly short term) the volatility of Fairfax’s total investment returns largely disappears. Things that make you go ‘hymmm…’
-
And here is a bonus question to the one I asked above: Are Fairfax's investment results volatile? I look forward to hearing other posters thoughts...
-
What type of return do people think Fairfax is currently earning in its investment portfolio? And what type of return do people think they can earn in an average year (I call this a normalized rate of return)? Return = % of average total investment portfolio value (beginning of year total investments plus end of year total investments divided by two). Of course, one of the key questions is what type of 'return' are you calculating? Accounting return (i.e. only including items captured in reported results?) Intrinsic value return (i.e. accounting items plus non-accounting items? The obvious non-accounting item is excess of FV over CV. But there are other non-accounting items that could be included. What other important assumptions are you including? Compared to a traditional P/C instance company, Fairfax is levered much more to investment results than insurance results. Getting the total return from investments estimate right is the critical input to value the company.
-
@Hamburg Investor, I don’t disagree with anything you say above. I like to construct mental models to help me understand Fairfax especially from an historical perspective. My mental models are flexible. I really appreciate the opportunity to debate ideas. So thank you. You bring up another point that is a big strength of Fairfax: how committed they are to their larger investments. They want them to work out. And Fairfax has been very creative in finding solutions to help put the struggling holdings in a position to succeed. When I managed sales teams at both Kraft and Saputo in my previous life I told them my job was to solve their problems. What was stopping them from being sucessful? Tell me. I would solve it. So they could do their part and deliver oustanding sales results. Of course I had to walk the talk - and solve legit issues (which I think I did for the most part). Good sales people loved that approach. Bad sales people hated it - they had no where to hide. I think Fairfax has been taking a similar approach with their associate/consolidated equity holdings. Especially back in the 2018/2019/2020 time period. Back then there were lots of problems: - EXCO Resources - recapitalization as a private company. - AGT Food and Ingredients - take private. Terrible business model for a public company. Much better as a private holding. - Eurobank - merge with Grivalia Properties (recapitalization). - Farmers Edge - spac IPO. Didn’t work out. Ended in bankruptcy. - Boat Rocker - spac IPO. Didn’t work out. Just folded in to Blue Ant (a stronger company). - Recipe - take private. Allow it to digest a decade of acquisitions (extremely difficult to do as a public company). Just folded in Keg Royalties Income Fund. Fairfax took the same approach with well run equity holdings. - IIFL - split into 3 companies (Finance, Wealth and Securities) and a 4th (5paisa) was spun off. - Quess - just split into three companies. There are more examples. Bottom line, this approach helps their equity holdings deliver better results over time.
-
@Hamburg Investor , i appreciate the opportunity to discuss/debate. That is how we all learn and refine our ideas My view is Eurobank was a very bad investment back in December of 2014. Fairfax invested $444 million and it promptly went to zero. With hindsight, this initial investment had no downside protection. I am not sure how that can be viewed as a good decision - unless it was made as a pure speculation (which I am assuming it wasn’t). Fairfax then invested another $389 million in November of 2015. That investment performed terribly for many years. At the time, Fairfax completely underestimated how impaired the Greek economy was and how long it was going to remain impaired. The bottom line… owning a bank when a depression is raging and the country is being governed by socialists is not a good idea. My view is this was a terrible investment from 2014 to 2018. It performed terribly on an absolute basis. And even worse when you factor in opportunity cost. What made Eurobank a great investment? 2019/2020 was when Fairfax got to work fixing many of its shitty investments. EXCO emerged from bankruptcy and was restructured. AGT was taken private. APR was sold to Atlas. Fairfax Africa was put out of its misery (merged with Helios). From 2019 to 2025, Fairfax exited or fixed most of the shitty investments. Fairfax didn’t exit Eurobank - Fairfax decided back in 2019 that it was one of the keepers. That was when the brilliant decision was made to merge Eurobank with Grivalia Properties (which was a great investment). My view is that is when Eurobank probably stopped being a terrible investment for Fairfax. It was then that you could start to see the potential in Eurobank. But it still took until 2021 for the stock to start to move. To summarize, my view is Eurobank was a terrible investment for many years. And then it became an ok investment. And in recent years it has become a great investment. Perhaps I am simply playing tricks on my mind in looking at Fairfax and their decision making in this way. It makes logical sense to me to look at it this way. But I know I am a different duck in how I look at some things. Again, I appreciate the opportunity to discuss these topics. It is super interesting. ————— The fundamentals have been materially changing with Eurobank as an investment over the past 10 years. The fact that the fundamentals for Eurobank look great today does not give Fairfax a free pass on the decisions they made in 2014 or 2015. IMHO.
-
@dartmonkey, I am not following your logic. My chart was a summary of the change in the share price over the past 5 years of Fairfax’s large publicly traded equity holdings. I didn’t include sales like Stelco and Resolute Forest Products, both of which were exceptionally well timed and delivered significant value to shareholders. What are the equity decisions that Fairfax has made over the past 5 years that have not worked out? I mean big ones. I can’t think of any. Perhaps the one example I can think of is perhaps Fairfax took too long to fully exit the losers (APR, Farmers Edge, Boat Rocker etc). Fairfax has booked significant losses from 2020 to 2025 with this group of holdings. But I like that they recognized they had a problem and have been slowly dealing with every holding. To the point they might actually be done. In terms of Blackberry, another legacy dog, Fairfax has been materially exiting this position over the past 5 years. To the point that it is a very small holding today. And with the latest 13F, it appears they are shrinking it further. What I don’t do is look at decisions they made in 2012 or 2013 or 2014 and extrapolate or try and draw any strong parallels to today. That was a lifetime ago. I am not sure what informational value it has anymore… other than they made a big mistake. And it appears they have learned from each of them. My view is Fairfax is a completely different company in 2025 than it was in 2013. The parrallel today would be looking at Warren Buffett and Berkshire Hathaway and trying to evaluate it today through the lens of the Dexter Shoes or investment in Salomon Brothers… I am not sure kind of logic makes any sense. At some point, we need to move on from decisions Fairfax made more than 10 years ago (like Blackberry). At least that is how my brain works. Having said that, everyone needs to find a mental model that works for them (and delivers good results).
-
@73 Reds, yes, there are so many interesting storylines that jump out of the chart. One for me is the number of private holdings (10 of the top 20), and what that means for Fairfax moving forward. Business model. Accounting treatment. Etc. Another is Fairfax India - it had the lowest ‘share price total return’ over the past 5 years of the large publicly traded companies at 121%. But this increase is likely materially understating the value that has been building in Fairfax India over the past 5 years in BIAL. We will find out when the airport is IPO’d, likely via Anchorage. The crazy growth of Eurobank. It has becoming a monster holding. The future of the FFH-TRS position. It has also become a very big holding - despite the fact the position was reduced in size at the end of 2024. How excess of FV over CV is spiking for associate and consolidated holdings. I could go on…
-
@73 Reds, what jumped out at me is how well EVERY large publicly traded holding is doing. Over a very long time horizon (5 years). That tells me it's not luck - their hit rate is too high (every holding) and the time-frame is too long (5 years). I like Munger’s idea of inverting. Many investors didn’t want to own Fairfax in the past because the equity portfolio was underperforming (I put the equity hedges/shorts in this bucket). That was fact based. Made sense. Today some investors don’t want to own Fairfax because they don’t believe the outstanding performance they are delivering is real (you pick the reason why it is not real). IMHO, this is not fact based. Makes no sense. The end result is Fairfax gets penalized by investors when they are performing poorly. And when they are performing at a high level. It is a great example of what messes lots of investors up - it's the face they see when they look in the mirror.