Viking
-
Posts
6,052 -
Joined
-
Last visited
-
Days Won
78
Content Type
Profiles
Forums
Events
Everything posted by Viking
-
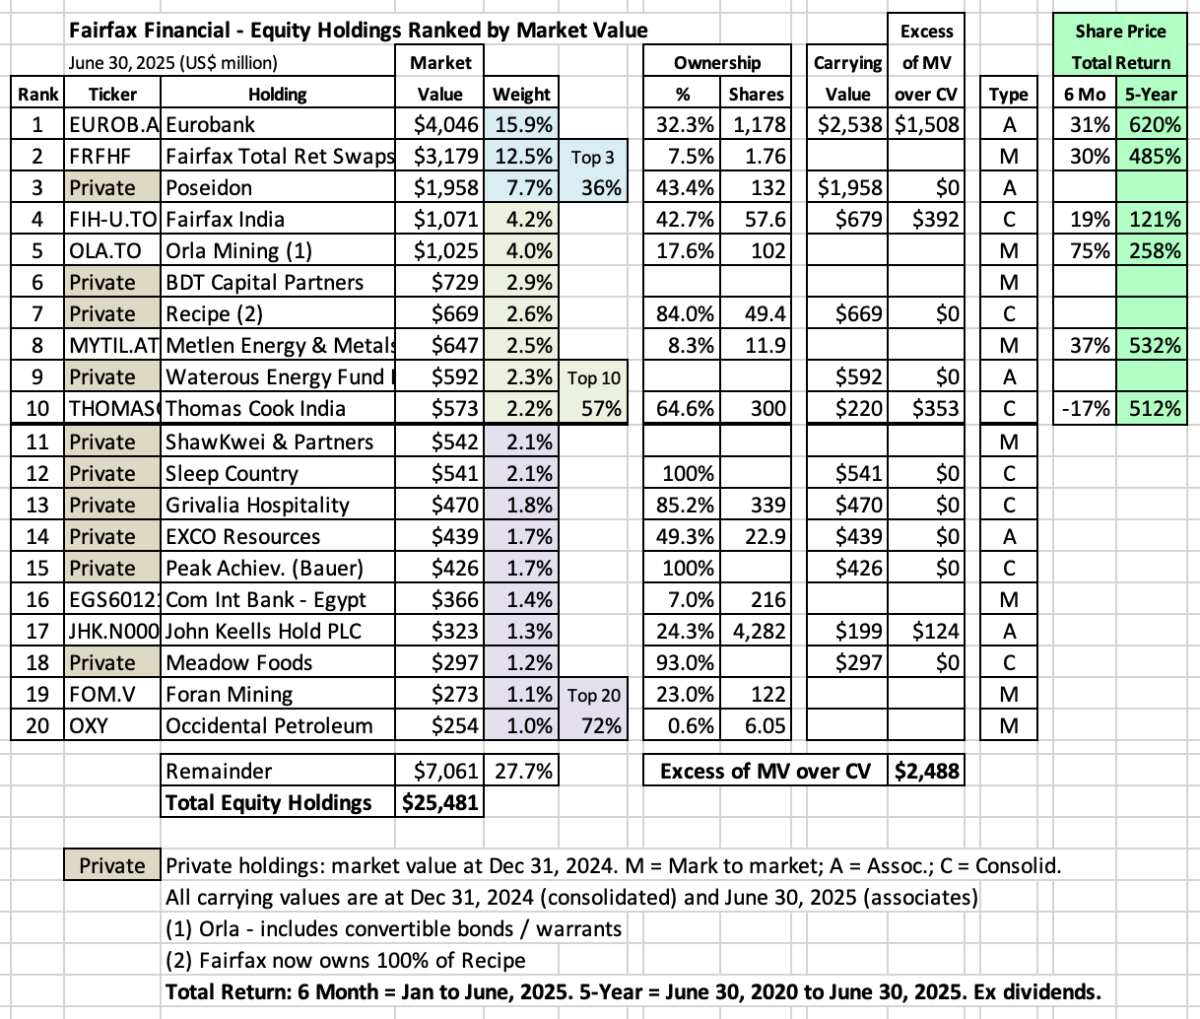
Fairfax's equity portfolio is under appreciated. Below is a list of the top 20 holdings. The performance of the largest publicly traded holdings has been exceptional (over both the past 6 months and 5 years). The 'share price total return' has not been adjusted for currency (it is the change in the share price in local currency). It also does not include any dividends paid. And it does not incorporate when Fairfax added to a position (or started their position, in the case of Orla). So it does not tell us precisely what Fairfax has earned on each of their equity investments over the past 5 years. I included the 'share price total return' in the chart to provide a summary of how the stock price of each of Fairfax's largest equity holdings has performed over the past 6 month and 5-year time periods. Every holding is up significantly. At a very high level, I think that tells us something about Fairfax and how well they are managing the equities in their investment portfolio. Which also helps us understand / gives us some confidence of what might happen in the coming years.

-
@Maverick47, I always appreciate your posts. Please keep them coming. Having worked in the insurance industry, you have a perspective I will never have. Much of what I post is a 'thesis' that is constantly evolving... and your thoughts (and those of others) helps me to understand if I am on the right track (or not) with my thinking. It is clear to me that the primary focus for almost all P/C insurance companies is to minimize volatility (both insurance and investments). Maximizing per share value for shareholders over the long term comes after this - and I don't know that this is even their next top objective. Fairfax has a very different approach. Maximizing per share value for shareholders over the long term is their primary focus. Volatility is something to be exploited (with insurance and investments). Yes, it makes for more lumpy results. But it also delivers much higher returns over time. Especially in todays environment. Fairfax has been materially outperforming peers in recent years. And I think it will continue. The interesting thing is they probably will not be rewarded by Mr. Market for the outperformance (with a high multiple). But that is ok too. It will just make it easy for Fairfax to be a long term hold. But I must admit, it is a bit of a head scratcher to me that Mr. Market is unable to grasp the significance of Fairfax's business model (and how uniquely well the company is positioned today) and why it is better than that of P/C insurance peers. But it is not unlike what happened to Berkshire Hathaway for many decades (when its business model was misunderstood and under appreciated by Mr. Market). Berkshire Hathaway became a compounding machine and most investors missed making the big money (when it should have been obvious how things were going to play out). All that was required for an investor was to get their position size right and then to exercise patience. Not complicated (but VERY hard to actually do). Fairfax continues to be such an interesting investment. Even after 5 years. What a crazy (good) situation. We all should be counting our lucky stars. And giving our thanks to the employees of Fairfax - their collective efforts over the past 5 years or so have been outstanding.
-
For those insurance nerds on the board, here are links to a couple of good articles on the P/C insurance cycle. One is recent and the other is a little older. But they are both super interesting. Insurance really is a unique (and crazy) business. Forecasting Underwriting Cycle: A wild goose chase or a quantum leap? Dhrubo Banerjee - Swiss Re April 24, 2025 https://vle.actuaries.org.uk/pluginfile.php/160525/mod_resource/content/1/Forecasting%20Underwriting%20Cycle%20-%20A%20wild%20goose%20chase%20or%20a%20quantum%20leap.pdf ————— THE UNDERWRlTlNG CYCLE - BY DAVlD SKURNICK CAS UNDERWRlTlNG CYCLE SEMINAR APRIL 19, 1993 https://www.casact.org/sites/default/files/database/forum_93sforum_93sf377.pdf
-
@Cigarbutt, thanks for catching my error with dates… yes, was supposed to be 2001-2002. I edited my post. (I do appreciate people pointing these mistakes out). And yes, Paul left Fairfax’s board after he joined Arch Re, likely a direct competitor to Fairfax’s reinsurance businesses. “Due to possible conflicts arising from his position as Chairman and CEO of Arch Reinsurance, Paul Ingrey retired from our Board during the year, but we hope to welcome him back when he retires again.” Prem’s shareholder letter - Fairfax 2002AR It is too bad Paul did not stay retired. He would have been a great long-term get for Fairfax and their Board. But I think it says something about Fairfax: 1.) That they were targeting people of Paul’s quality for their Board. 2.) They were able to get him to join. Yes, it was short. But Paul had a pretty good reason for leaving. My guess is Paul’s views on how to manage the P/C insurance cycle are now part of Fairfax’s DNA. Be very disciplined when the market soft. And very aggressive when the market is hard.
-
End of the P/C insurance hard market - Is it time for investors to head for the hills? As the hard market slows we will begin to hear the drumbeat of the doomers - they will confidently tell you that it is time to sell your P/C insurance stocks. The drumbeat will likely get louder and louder over the next year. So with this post let’s explore the P/C insurance cycle to see what we can learn. The P/C insurance market is not rational Like financial markets, the P/C insurance market is not rational. How do we know it is not rational? Because it constantly cycles between hard to soft to hard to soft markets. The cycles are long. And they usually go to extremes. If the P/C insurance market was rational it would not cycle to the extent that it does. What causes the insurance cycle? Just like financial markets, what causes the insurance cycle is greed and fear. Greed = The end result is a soft market (product is sold at or below cost, generating low or negative returns). Fear = The end result is a hard market (product is sold above or well above cost, generating good or very good returns). Doesn’t this make P/C insurance a pretty shitty business? No. If all the players were rational then P/C insurance would be a shitty business - it would be impossible for anyone to make any money (outsized profits would quickly get competed way). The fact that many of the players are not rational is what makes P/C insurance such a great business. The rational actors are able to profit greatly from the folly of the irrational actors. Investors should welcome the insurance cycle. Having a good mental model can help Ben Graham provides investors with a great mental model (called Mr. Market) to help them understand and make money from investing in financial markets. Mr. Market (the stock market) often engages in irrational behaviour. Some days he is pessimistic, willing to sell his stocks at very low prices. Other days he is euphoric, willing to buy your stocks at very high prices. The prices he quotes often have nothing to do with the fundamentals of the business. The more extreme his behaviour (the higher the volatility) the better for you - the more you can profit. “Mr. Market is there to serve you, not to guide you. It is his pocketbook, not his wisdom, that you will find useful.” Warren Buffett - BRK 1987AR Is there a parallel for the P/C insurance market? Is there a good mental model we can use to help us understand the P/C insurance market cycle? Yes. Paul Ingrey and his P/C insurance clock. With his P/C insurance clock Paul explains how the insurance underwriting cycle works. It is a behavioural model - and is built on the simple assumption that P/C insurance companies will engage in irrational behaviour (like they always have in the past). PDF version of the clock https://www.archgroup.com/wp-content/uploads/00464-Ingrey-Underwriting-Cycle-Clock-FINAL.pdf Text version of the clock https://www.archgroup.com/the-underwriting-lifecycle/ The insurance cycle exists because of ‘stupidity.’ Paul Ingrey said he put the P/C insurance clock together to remind people of how stupid they are (at 37:30 of podcast linked below). The clock was built by Paul to explain to investors where the insurance market cycle is at (at a point in time). Who is Paul Ingrey? The podcast below is from 2018. It is a great introduction to Paul Ingrey - one of the greats in the P/C re/insurance world. No Change Without Fear With Paul Ingrey https://podcast.notunreasonable.com/126848/episodes/629958-no-change-without-fear-with-paul-ingrey Summary of podcast: “For reinsurance people, this interview is electric. “Paul Ingrey founded three of the most successful reinsurance companies of the last 40 years: Prudential Re (Everest Re), F&G Re (10% of staff became CEOs) and Arch Re (as we know it today). Thousands of people in the industry can trace their employment back to Paul's unique mix of discipline and charisma. “Being successful in insurance, like with many things, isn't complicated (write business in hard markets and not in soft markets) but it's devilishly hard to pull off. Paul is perhaps the original master of the cycle. “In the show we cover a complete modern history of insurance cycles, starting in the mid-60s, Paul's insurance cycle clock (see here), stories of the founding of each of the companies that would define his legacy and more.” Of note, Paul Ingrey served on the Board of Fairfax for about 2 years from 2001 to 2002. “…we welcome Paul Ingrey to the Board. Paul has had one of the best track records in the reinsurance business, having founded and run F&G Re (part of U.S. F&G, now St. Paul’s) for 14 years with a cumulative combined ratio of 91%. We look forward to Paul’s wise counsel in the years to come.” Prem’s shareholder letter - Fairfax 2000AR “Due to possible conflicts arising from his position as Chairman and CEO of Arch Reinsurance, Paul Ingrey retired from our Board during the year, but we hope to welcome him back when he retires again.” Prem’s shareholder letter - Fairfax 2002AR Volatility "Be fearful when others are greedy, and greedy when others are fearful." Warren Buffett Volatility in financial markets is a wonderful thing. It allows rational investors to make outsized returns over time. Volatility in P/C insurance markets is also a wonderful thing. It allows rational P/C insurance companies to make outsized returns over time. How to exploit volatility in the P/C insurance business Our chart below summarizes what is usually the best way to allocate capital through the insurance cycle. In a soft market (when margins are under pressure), be very disciplined with underwriting (minimal organic growth). The goal is to preserve capital. P/C insurance company valuations tend to be depressed in a soft market so this can be a good time to grow by acquisition (later in a soft market). In a hard market (when margins are expanding), get aggressive with underwriting new business (strong organic growth). The goal is to aggressively deploy capital. P/C insurance company valuations tend to be rich in a hard market so this is generally not a good time to grow by acquisition. What do many P/C insurance companies actually do? In a soft market many P/C insurance companies keep growing organically (some aggressively). Over time, this begins to impair their capital base (writing unprofitable business eventually sucks). This also means they do not have the money to grow by acquisition later in a soft market. At the beginning of a hard market they are capital constrained - so they have a limited ability to grow organically. But as the hard market plays out their capital base gets fixed and they attempt to grow by acquisition (paying high prices). This approach has a parallel in financial markets - it is like buying high and selling low. Except because of how pricing in P/C insurance works, you just don’t know that you are buying high in a soft market (or you don’t care - i.e. it becomes some else’s problem in the future). Yes, that is a very hard way to make money over time. The winners in P/C insurance are the contrarians Just like with investing, the winners in P/C insurance are the contrarians. It is the rational actors. The companies with great discipline. And a long term focus. Let’s go back to the question we asked at the start of this post. As we approach the end of the hard market, is it time for investors to head for the hills and sell their P/C insurance stocks? Soft markets are not to be feared. Well run P/C insurance companies welcome the insurance cycle. They don’t fear it. They exploit it. Soft markets sow the seeds of the next hard market. Well run P/C insurance companies will do well over the insurance cycle. Poorly run insurance companies underperform over the insurance cycle. So you need to figure out if you own one of the well run P/C insurance companies. But there is more… We need to broader out our analysis Our analysis above only discussed underwriting. But as everyone knows, all P/C insurance companies have two businesses: P/C insurance (underwriting) Investment management Now when it comes to investment management, almost all P/C insurance companies follow the same model - they put their investment portfolio primarily in bonds. And they match the average duration of the investment portfolio with the average duration of their insurance liabilities. The investment portfolio is put on autopilot. AND THE RETURNS ARE (USUALLY) NOT VOLATILE. Soft market? Hard market? The P/C insurance market cycle doesn’t matter for most P/C insurance companies when it comes to what they do with their investment portfolio. The genius of Warren Buffett Warren Buffett has always understood what it takes to have a well run P/C insurance business. Be very disciplined with underwriting in a soft market. Drive strong organic growth a hard market. Be very opportunistic with acquisitions. But what makes Buffett unique is what he did with the investment management part of the business. Buffett figured out that equities can deliver a much better return than bonds over time. I know, what a freaking genius. This benefits Berkshire Hathaway in two important ways: Investing in equities boosts the return of the investment portfolio (compared to what is earned by other P/C insurance companies). In a soft market capital that is not needed in the P/C insurance business can be shifted to equities. This allows BRK to maintain a high ROE even in a soft insurance market. And when the next hard market starts (years later), all the excess capital that has built up can be used to turbo-charge the growth of the P/C insurance business. Warren Buffett took the P/C insurance model to its logical conclusion: Exploit volatility (the insurance cycle) in the P/C insurance business. Exploit volatility (invest in equities) in the investment management business. Don’t just do it with insurance. Do it also with investment management. The result of this union has been magical for investors in Berkshire Hathaway. From 1965 to 2024 (59 years), the per share market value of Berkshire Hathaway has delivered a compound annual gain of 19.9%. What Buffett is doing is kind of like shooting fish in a barrel. But here is the crazy thing… Buffett isn’t secretive about what he is doing. For 59 years he has been educating investors (and competitors) on his business model. And Buffett is a great communicator… you would have to be an idiot to not understand him. We all know markets are wickedly efficient. If someone invents a better mousetrap… their advantage will not last long. Because competitors will copy what they are doing and this will in short order compete away and advantage that exists. So most P/C insurance companies are copying Buffett’s business model. Right? No. Actually almost no other P/C insurance company is copying Buffett. Honest. Its true. Why don’t all P/C insurance companies copy Warren Buffett’s model? Charlie Munger was asked this same question. And he had no answer (if I remember his response correctly). Which says something because Charlie was a pretty sharp guy and not shy to let you know what he was thinking. My guess is most P/C insurance companies don’t follow Buffett’s model for one simple reason: they are not running the business for the long term. Because they can’t. It can be explained: Volatility Wall Street hates volatility. It defines volatility as risk (which is absurd). Wall Street also is obsessed with the short term (and smooth results). And yes, Wall Street is that same manic-depressive called Mr. Market. It really is a delicious cocktail. And these are the basic building blocks that determine how almost all P/C insurance companies run their business. Wall Street is in control. So even though Buffett’s model is obviously the best one to use - if your goal is to maximize per share value creation for shareholders over the long term - well, pretty much no one uses it. Because they can’t. Crazy but true. The key is family control Buffett had this. Having control allowed Buffett to ignore Wall Street. Markel is going to be a great case study for my theory in the coming years. They were a family controlled organization… and when they were their returns for shareholders smoked. They are no longer a family controlled company…. and their returns for shareholders in recent years have started to stagnate. Of interest, who is Markel looking to for guidance to right their ship? Wall Street. Yikes! (Looks to me like they are letting the fox into the henhouse… but what do I know?). What about Fairfax Financial? This is where our story gets really interesting. Unlike Markel, Fairfax is still a family controlled company. Prem Watsa owns more than 9% of Fairfax and he has voting control of more than 40%. He also is in the process of grooming the next generation to continue the family’s stewardship of the company. Bottom line, Fairfax will remain a family controlled business in the coming decades. Let’s shift from theory to the real world. How has Fairfax fared over the past 10 years? We can split the past 10 years into the following: From 2014 to 2019, P/C insurance was in a soft market. From 2020 to 2024, P/C insurance was in a hard market. Let’s look at two key metrics for a P/C insurance company: net premiums written (NPW) and total investment portfolio In the soft market from 2014 to 2019: NPW increased from $6.1 to $13.3 billion, or a total of $7.2 billion. This was a 5-Year CAGR of 16.8%. Total investments increased from $26.2 to $39.0 billion, or a total of $12.8 billion. This was a 5-Year CAGR of 8.3%. Bottom line, Fairfax dramatically grew its P/C insurance business (and its investment portfolio) in a very soft P/C insurance market. How? By making many acquisitions (Brit, international and Allied World) at reasonable prices. In the hard market from 2019 to 2024: NPW increased from $13.3 to $25.3 billion, or a total of $12 billion. This was a 5-Year CAGR of 13.7%. Total investments increased from $39.0 to $67.4 billion, or a total of $28.4 billion. This was a 5-Year CAGR of 11.6%. Bottom line, Fairfax dramatically grew its P/C insurance business (and its investment portfolio) in a very hard P/C insurance market. How? By growing organically. How has Fairfax done over the past 10 years? NPW increased from $6.1 to $25.3 billion, or a total of $19.2 billion. This was a 10-Year CAGR of 15.3%. Total investments increased from $26.2 to $67.4 billion, or a total of $41.2 billion. This was a 10-Year CAGR of 9.9%. Bottom line, Fairfax dramatically grew its P/C insurance business (and its investment portfolio) in both soft and hard P/C insurance markets. Just what you would expect from a very well run P/C insurance company. Importantly, over the past 10 years, Fairfax has also improved the quality of its P/C insurance business. It is not just much bigger - it is also higher quality. What have we learned? Fairfax business model is unique in the P/C insurance industry. Family control appears to be a sustainable competitive advantage for the company. It allows the company to run the business (insurance and investments) for the long term. In terms of business model, Fairfax today looks like a much younger Berkshire Hathaway: Exploit volatility (the insurance cycle) in the P/C insurance business. Exploit volatility (invest in equities) in the investment management business. Fairfax has a high quality P/C insurance business: My guess is it currently has a ‘normalized’ combined ratio of about 94%, which is very good. At the same time, its investment management business is executing exceptionally well: My guess is Fairfax is currently generating a ‘normalized’ return on its investment portfolio of about 8%, which is outstanding. And when it comes to capital allocation, Fairfax has been best-in-class among P/C insurance companies over the past 5 years. As Stanley Druckenmiller would say, the management team at Fairfax has been on a ‘hot streak.’ Bottom line, Fairfax has never been better positioned an it is today to continue to drive per share value for long term shareholders. Regardless of where we are at in the insurance cycle.
-
I have tried to connect the dots on APR and it is very complicated. Suffice to say, it was a terrible investment on all metrics. For that time period (2015-2017), APR, Farmers Edge and Fairfax Africa are probably all running neck and neck for the prize of worst investment made. The crazy (bizarre?) thing is we are still not able to close the book on those shitty investments - all these years later. I do think we are close to being done with them. But I have been saying that for years - and I have been dead wrong. It has been like having a P/C insurance runoff business (stuffed full of hazardous waste) but this time in the equity portfolio.
-
@adventurer, I look at bull/bear markets as volatility. And volatility is a good thing for Fairfax. And extreme volatility is usually very good for Fairfax (when they make their best investments - the needle movers). I have done a post on Volatility. It starts on page 221 in my book. I am working on an update to that post. But I keep getting lost (so it remains uncompleted). I am also working on a post on the insurance cycle - through the lens of volatility. That might be done in the next week or two. PS: It might be instructive to look at what Fairfax did coming out of the GFC (read a few of Prem's letters from that time). They were flush with cash (having nailed the credit default swaps and equity hedges). I think they used the windfall to buy out their partners in Northbridge and Odyssey. And I think they loaded up with blue chip US equities (which they had to sell prematurely given the losses from the equity hedges).
-
When it comes to the PPI report, I think what The WSJ reported today is pretty similar to others. Here is a link to the Reuters story: https://www.reuters.com/world/us/us-producer-inflation-heats-up-goods-services-prices-soar-2025-08-14/ Bottom line, I am just trying to understand how everything is playing out.
-
Economic theory (and common sense) tells us that tariffs are a tax. Not complicated or controversial (I don't think). Trump and the US has just begun a pretty consequential science experiment. It involves tariffs and a bunch more. It will take another 12 to 24 months to begin to understand what it means economically (and politically). We will get important data points over time. We might have gotten one today. Below is what the Wall Street Journal had to say: --------- Now We Know Who’s Paying the Tariffs Producer prices surge, and real wages still aren’t rising fast enough. https://www.wsj.com/opinion/now-we-know-whos-paying-the-tariffs-081f461d?mod=hp_opin_pos_1 "President Trump knows the public is skeptical about his tariffs, which is why Administration officials are anxious to convince voters someone somewhere else in the world will pay for them instead of American households. Inflation data released Thursday tell a different story. "The producer-price index (PPI) in July rose 0.9% in the month and 3.3% over the last year. Consumer-price data released Tuesday (0.2% monthly and 2.7% for the last 12 months) implied households weren’t experiencing tariff-induced price increases, except in some services such as medical care. The PPI numbers tell us this is partly because companies are paying higher prices but haven’t passed them on to customers—yet. "The producer-price data get worse the closer you look. Goods and services both experienced substantial inflation, of 0.7% and 1.1% month-on-month respectively. Goods and services related to business investment in particular are becoming pricier, with the cost of manufacturing equipment rising 0.4% in one month and related services 4.5%. "Prices for intermediate goods—components and raw materials—are also on the rise. Prices for materials used in durable-goods manufacturing increased 1.3% in a single month, and components for manufacturing increased 0.4% in the month. "This hasn’t shown up in consumer prices so far because many companies entered the Trump tariff era with large cash reserves or wider margins, so they can absorb these costs for the time being. But these companies can’t do this forever. Meanwhile, cash lost to paying tariffs or paying tariff-induced higher prices isn’t available for reinvestment in the business, or to return to shareholders."
-
An Overview of Fairfax's 5 Income Streams Fairfax has 5 income streams that flow through to reported earnings. What are they? How big are they? How have they changed over the past 4 years? What are we forecasting for 2025 and 2026? What are some of the key take-aways? What are they? Underwriting profit Interest and dividend income Share of profit of associates Non-insurance consolidated companies Net gains (losses) on investments How big are they? Below is a chart which provides a summary of the size of each of Fairfax’s 5 income streams. Included is: For context, the average for the six years from 2016 to 2021. Actuals for the past 4 years: 2021 to 2024. My current forecast for 2025 and 2026. Forecast for 2025 and 2026 I am forecasting that Fairfax’s 5 income streams will come in at about $7.6 billion in 2025 ($354/share), which would be a solid increase compared to $6.5 billion in 2024 ($301/share). How have the income streams changed in recent years? There are a couple of things that immediately jump out: 1.) The total growth of the 5 income streams since 2021 has been significant. From $2.5 billion (average from 2016-2021) to $7.4 billion (estimate for 2026), and increase of 196%. 2.) The per share growth of the 5 income streams since 2021 has been much better than the total growth. From $96/share (average from 2016-2021) to $349/share (estimate for 2026), an increase of 263%. Fairfax has been very aggressive with share buybacks in recent years and this is delivering significant value to long term shareholders. 3.) Most of the significant growth seen in recent years has been in the four buckets that comprise operating income (underwriting profit, interest and dividend income, share of profit of associates and non-insurance consolidated companies). This is important because operating income is considered to be the highest quality sources of income for a P/C insurance company. They are considered to be high quality because they tend to be predictable and durable. The growth of operating income at Fairfax since 2021 has been exceptionally large. From $1.25 billion (average from 2016-2021) to $5.89 billion (estimate for 2026). From $49/share to $278/share, an increase of 467%. Operating earnings now represents about 80% of total income streams at Fairfax, up from 51% (average from 2016-2020). The dramatic spike in income streams over the past 5 years has transformed earnings at Fairfax – they are much larger and of much higher quality. 4.) Underwriting income is 23% of total income streams For most P/C insurance companies, underwriting income is closer to 45% of their total income streams. Fairfax is MUCH LESS exposed to the P/C insurance cycle (i.e. a soft market) than other P/C insurance companies. For two important and very different reasons: Underwriting income is a much smaller income stream (as a percent) for Fairfax compared to traditional P/C insurance companies. At Fairfax, capital can be shifted from P/C insurance to its investment management business. This will allow Fairfax to continue to compound capital at high rates even as the hard market slows. This is important to keep in mind in the coming years as the hard market comes to an end.
-
I agree. Brett Horn is really publishing an opinion piece. But because it is under the 'Morningstar' brand, people mistakenly think it is a research piece. Why do I think it is an opinion piece? Because he does not provide any meaningful or relevant analysis/facts/logic to support his conclusions. How do you debate an argument that is not based on facts? The answer, of course, is you can't. There is no actual useful/relevant 'research' in what he writes on Fairfax. The problem is people aren't great at ignoring stuff they read - even the really bad stuff. It tends to lodge itself in the deep recesses of the mind. And when a person is in a weakened state, it can come forward and get acted upon. Peter Lynch has talked about this phenomenon. As a result, even really obviously bad opinion pieces like Brett Horne's can have a real (negative) impact on many investors. It is such a bizarre situation.
-
@nwoodman, great example. I agree that Adam Waterous is the real deal and WEF/Strathcona/Greenfire is a sleeper holding for Fairfax (in terms of size and upside potential). Fairfax started with a small investment. Over time, as Adam earned their trust, the investment has increased. Smart. Capital at Fairfax now goes to the best available opportunities. That has important implications for the future returns of Fairfax...
-
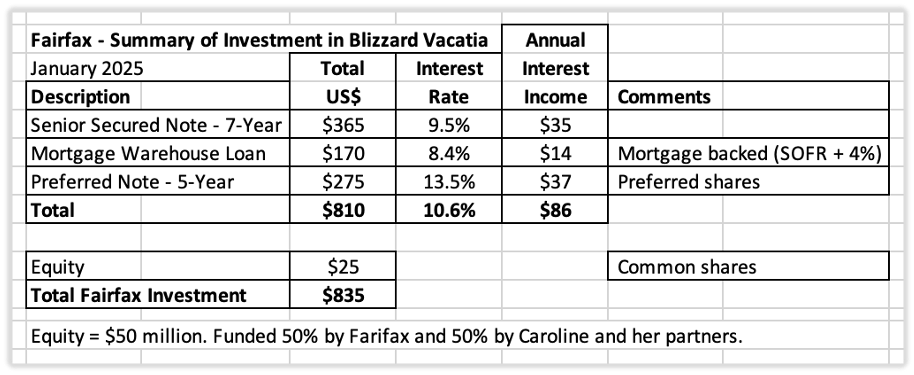
@Marco Van Basten, yes, it is early days with the Caroline Shin/Blizzard Vacatia investment. As we get more information I will update my views. Here is why I like it: High level of confidence/trust in the management team at Fairfax: Fairfax has a very good track record over the past 7 years of partnering with very good/exceptional entrepreneurs/CEO's/founders. Not surprisingly, Fairfax's investment results have also been very good. Peter Lynch said "In this business, if you're good, you're right six times out of ten." Fairfax has been better than that. Carolyn Shin has a very impressive resume. I like that Fairfax has partnered with a highly successful founder/entrepreneur. As per Wade Burton's comments on Fairfax's Q2 conference call, the early results from the investment are promising/ahead of expectations. Below is my summary of the investment (it will be in the next update to my PDF/book). --------- Blizzard Vacatia – Partnering with an Entrepreneur / Boosting Yield of Fixed Income Portfolio Update from Wade Burton on the investment in Blizzard Vacatia. It’s early days in the timeshare investment, Berkeley, run by Caroline Shin, but so far, it has exceeded expectations. Berkeley has approximately 125,000 available room nights per month. They started the year at virtually nil occupancy for overnight stays. In month one, Caroline brought that number to 10%, the next month 20%, and the third month 35%. I’m happy to report year to date operating income has already reached our full year expectations. Again, outstanding and capable partners doing an excellent job for Fairfax shareholders. Wade Burton – Fairfax Q2-2025 conference call ————— July 30, 2025 One of Fairfax’s largest investments in 2025 (January) was the purchase of the Berkley Group, one of the largest independent timeshare companies in the US. With this deal, Fairfax partnered with Caroline Shin and her team at Vacatia. The partnership is called Blizzard Vacatia. This is a private holding that is equity accounted by Fairfax. Fairfax provided the majority of the financing to acquire the Berkley Group. Vacatia is providing the operational expertise to run and maximize the value creation from the assets of the Berkley Group. “Blizzard Vacatia, through its subsidiaries, is engaged in the development, sales, marketing and rental of timeshare resorts.” Fairfax 2024AR Fairfax invested a total of $835 million in Blizzard Vacatia, as follows: Fairfax’s investment is structured in an interesting way. It is a combination of debt and equity. The annual interest income is meaningful. And there is additional upside potential with the equity. Growing the average yield on their fixed income portfolio This investment (along with the acquisition with Kennedy Wilson of the real estate loan portfolio/infrastructure from PacWest) provides a couple of good examples of how Fairfax is over time thoughtfully shifting some of their fixed income portfolio from government bonds to higher yielding corporate securities. This helps improve the average yield on their fixed income portfolio. ————— Who is Vacatia? Below is an article that discusses Vacatia’s recent purchases and emerging capabilities. Vacatia’s Bold Move: A New Era for Independent Resorts - https://resorttrades.com/vacatias-bold-move-a-new-era-for-independent-resorts/amp/ The timeshare industry is undergoing significant change with Vacatia’s acquisition of The Berkley Group and Daily Management, a move that strengthens its position as a key player in the independent resort sector. With the acquisition, Vacatia’s portfolio now includes 460,000 owners, 2,500 associates, and over 11,000 units across 13 states. This means Vacatia is now one of the top five vacation ownership companies in the United States. The acquisition combines Berkley’s expertise in sales, Daily Management’s experience in resort operations, and Vacatia’s technology and rental solutions. Shin sees this integration as a way to provide independent resorts with more flexibility and support. “Independent resorts now have a partner that has every capability of helping an independent resort, large or small,” she says. “We are celebrating the independent resorts, giving them the ability to remain independent, but at the same time leveraging the scale that comes with Vacatia having their back.” One key area where Vacatia sees opportunity is in technology-driven efficiencies, which have historically been more difficult for independent resorts to implement. Shin points to maintenance, housekeeping, reservations, and owner services as examples of areas that can be improved with better digital tools. Who is Caroline Shin, CEO and Co-founder of Vacatia? Caroline co-founded Vacatia to bring innovation and new ideas to timeshares. As a seasoned technology and hospitality executive, Caroline already pioneered well-known travel programs that are now mainstays in the hospitality industry. She was a member of the founding team of Hotwire.com, where she led product and technology functions to develop one of the first online travel agencies in the world. She led CRM and revenue management for Starwood Hotels & Resorts Worldwide, launching a first-of-its-kind pricing and marketing platform that empowered hotels to make impactful, data-driven decisions. At Sentient Jet, she delivered industry-leading customer service by cultivating deep client relationships combined with algorithmic analysis of each flight plan to forecast service issues before they occur. She was also a technology and strategy consultant at Accenture and Scient, advising both Fortune 500 and startup clients to adapt their business online. Caroline is a member of the Board of Directors of the American Resort Development Association (ARDA) and holds a degree in nuclear engineering from MIT. - https://www.vacatiapartnerservices.com/blank ————— On Feb 13, 2025, the Fairfax’s investment in Blizzard Vacatia was discussed on the investing forum ‘Corner of Berkshire and Fairfax.’ Click the link below for more: - https://thecobf.com/forum/topic/16427-fairfax-stock-positions/page/94/#findComment-601100 ————— Comments from Wade Burton about Blizzard Vacatia from Fairfax’s Q4-2024 conference call. Second, I wanted to discuss an investment that closed just after year-end 2024. We invested in the largest independent timeshare company in America called the Berkeley Group. Caroline Shin and her team at Vacatia are Fairfax partners here. The investment is underpinned by asset value, where we directly own 4,950 full-service vacation units mostly located in Las Vegas, Orlando, and other high-traffic vacation areas in the U.S. The opportunity here is for Caroline and her team to generate overnight rental income from the huge stock of nightly vacancies. Her experience designing Hotwire online booking software and then as an executive at Starwood is perfect for what Vacatia is trying to do with Berkeley. In fact, prior to this acquisition, her group at Vacatia made investments in five smaller timeshare assets from 2019 to 2024, and in each case, they were very successful at significantly growing EBITDA in a short period of time. The total deal was $835 million, which we funded with a $275 million five-year preferred note at 13.5%, a $365 million seven-year senior secured note at 9.5%, and $170 million mortgage warehouse loan with a five-year maturity at SOFR plus 400. The $50 million equity is funded 50% by Fairfax and 50% by Caroline and her partners. We are absolutely thrilled to be her partner on this. Wade Burton – Fairfax Q4-2024 Conference Call Comments from Prem about Blizzard Vacatia from Fairfax’s 2024AR. Early in 2025 we invested in the Berkley Group, the largest independent timeshare company in the United States. Caroline Shin and her team at Vacatia are partners with us on this investment. This investment results in us owning 4,950 full-service vacation units mostly located in Las Vegas, Orlando and other high-traffic vacation areas in the U.S. There is great opportunity for Caroline and her team to generate additional overnight rental income from the huge stock of nightly vacancies. In fact, her group at Vacatia made investments in five smaller timeshare assets from 2019 to 2024 and this strategy helped to generate strong growth in EBITDA and free cash flow. Her experience designing Hotwire online booking software and as an executive at Starwood is perfect for what Vacatia is trying to do with Berkley. Our total cash investment was $835 million comprised of a senior secured loan, preferred shares, a mortgage-backed loan and common shares. We are very excited to work together with Caroline and her team at Vacatia on this investment. Prem Watsa – Fairfax 2024AR From Fairfax’s 2024 Annual Report Subsequent to December 31, 2024 On January 1, 2025 the company acquired a 50.0% equity interest in Blizzard Vacatia Equity Partners LLC (“Blizzard Vacatia”). The company’s total cash investment of $835.0 was comprised of a senior secured loan of $365.0, preferred shares of $275.0, a mortgage-backed loan of $170.0 and common shares of $25.0. Blizzard Vacatia, through its subsidiaries, is engaged in the development, sales, marketing and rental of timeshare resorts. Fairfax 2024 AR
-
+1 Fairfax will always be value investors. And like any well run organization they are evolving over time
-
@Parsad, I think Fairfax has fundamentally changed how they invest capital (especially equities). I think 2018 was kind of the turning point. I call the pre-2018 period 'old Fairfax.' And the post-2018 period 'new Fairfax.' Of course there were some great investments were made in the old Fairfax era - like Fairfax India. So my distinction is nuanced. Why do I think this? When you look at what Fairfax owned and where they were putting new capital from 2014 to 2017 it is full of very bad decisions. When you look at what Fairfax owned and where they were putting new capital from 2019 to 2024 it is full of much better decisions. Most importantly, Fairfax appears to be putting a much higher premium on management - choosing to partner with outstanding capital allocators/CEO's/founders. You see that in spades with their biggest investment so far in 2025 - partnering with Caroline Shin at Vacatia. Below is a post I did a couple of years ago that reviews some of the investments that Fairfax made from 2014 to 2017. My view is it is VERY different from how they have been allocating capital over the past 5 years. My view is something changed at Fairfax. Of interest, Fairfax experienced more losses from Farmers Edge (2024) and Boat Rocker (2025). But we might actually 'be there' in terms of the legacy holdings from 2014-2017 (finally) being fixed. I also think it is very healthy to review this topic. Fairfax has made a great deal of progress over the past 6 years. The past must not be forgotten. ----------- A Review of 2014 to 2017: Old Fairfax – too many ‘chronically-leaking boats’ April 14, 2023 “My conclusion from my own experiences and from much observation of other businesses is that a good managerial record (measured by economic returns) is far more a function of what business boat you get into than it is of how effectively you row (though intelligence and effort help considerably, of course, in any business, good or bad). Some years ago I wrote: “When a management with a reputation for brilliance tackles a business with a reputation for poor fundamental economics, it is the reputation of the business that remains intact.” Nothing has since changed my point of view on that matter. Should you find yourself in a chronically-leaking boat, energy devoted to changing vessels is likely to be more productive than energy devoted to patching leaks.” Warren Buffett – Berkshire Hathaway 1985AR Fairfax’s equity portfolio looks very well positioned today. Most of the equity holdings purchased since 2018 have been performing well. And, after years of hard work, the poor performing equity holdings (many purchased from 2014-2017) have largely been fixed and are now performing well. In fact, the equity portfolio looks better positioned today than at any other time in Fairfax’s recent history. We are increasingly seeing the benefits in improved reported results. A good recent example is ‘share of profit of associates,’ which spiked to more than $1 billion in 2022; the previous high was $402 million in 2021. What happened? Three things: 1.) Fairfax learned a few important lessons from the poor purchases they made from 2014-2017. It looks me like Fairfax has tweaked the methodologies used when allocating capital. They are putting a premium on management. Hamblin Watsa has decided it is not a turn-around shop - looking to actively run poorly lead/challenged businesses. They are also looking to invest in better balance sheets. Fairfax is no longer a piggy bank for poorly run companies in search of cash. Others on this board have pointed this out. 2.) The Fed and the ending of easy money (zero interest rates/QE) is likely a driver of the stronger performance the past two years of Fairfax’s equity holdings. Value investing is back. 3.) The timing of the cycle is finally working in Fairfax’s favour and is driving stronger performance of the equity holdings. Value, resource, and commodity stocks appear to be in a secular bull market. At the end of the day, all the above is likely partly responsible for the improvement we have seen in Fairfax's equity holdings in recent years. ————— It can be instructive to look into the past so we can learn. This helps us understand what has been baked into past results. In turn, this can help us understand what might happen in the future. What happened with the purchases from 2014-2017? A total of 10 investments are reviewed below. Fairfax invested a total of about $3.5 billion in these investments over the years. Over the past 8 years my math says Fairfax booked losses of about $1.5 billion on these holdings. That is almost $200 million, on average, each year. For example, in 2022, Fairfax wrote down its investment in Farmers Edge by $133 million. Stuff like that. The bigger cost to shareholders has been the opportunity cost. Prem tells us that Fairfax expects its equity investments to deliver returns of 15% per year. Applying a more modest 10% target, the $3.5 billion in investments (made 2014-2017) should have doubled in value by now to $7 billion. The opportunity cost of the poor investments made from 2014-2017 is likely an additional $2 billion. This is actually a good news post. The good news is: The equity purchases made from 2018 to April 2023, as a group, look very good and are performing well. As I will review below, the problem investments from 2014-2017 look like they are not only fixed - they are also poised to deliver solid returns for Fairfax shareholders moving forward. An 8 year-long headwind has now become a tailwind. As a result, I expect Fairfax’s $16 billion equity portfolio to generate a higher total return (percent and absolute) in the coming years than it has delivered over the last decade. Given its current construction, it could well compound at 12% over the next couple of years = $1.9 billion/year. dividends = $120 million share of profit of associates = $900 million consolidated earnings = $240 million mark-to-market investment gains = $650 million (not including fixed income) —————- Below is a short review of 10 large investments made over the 4 years from 2014-2017. 1.) EXCO Resources (2015): Fairfax’s initial investment was $300 million in 2015. We have since learned that shale was a bubble and it eviscerated something like $5 billion in capital up until 2020. Fairfax reported cumulative realized losses of $296 million on EXCO in 2019 (as per the AR). Learning: the old economic model for shale was a sham. The good news: energy looks like it is in a structural bull market; the new economic model for shale looks good - focussed on shareholder return. 2.) APR (2016): Fairfax invested a total of $462 million in APR in 2016 and 2017. In 2018 they sold it to Atlas for $200 million (in Atlas stock). The first thing Atlas did was replace the CEO. Learning: Terrible business. Poorly managed. The good news: APR is now Atlas’ problem. 3.) Fairfax Africa (2017): launched with much fanfare in 2017, Fairfax invested a total $476 million. Two short years later Fairfax exited its management of the business and moved the assets to a fund managed by Helios. The value of the Helios fund today is about $100 million. I am not sure what the total financial loss was for Fairfax on this investment, but it was significant. The damage to Fairfax’s reputation was also significant. Learning: Hubris on steroids? Terrible idea. Worse execution. The good news: Fairfax is partnered with Helios and looks well positioned moving forward in Africa. This is now a small investment for Fairfax. 4.) Farmers Edge (2017): Fairfax invested $159 million in Farmers Edge in 2017. Farmers Edge completed its IPO in 2021 and in the 2021 AR Fairfax said their total investment in Farmers Edge to that point was $376 million. The CEO ‘stepped down’ in April of 2022. In the 2022 AR, Fairfax said Farmer’s Edge had a carrying value of $71 million, after taking a $133 million write down in 2022. The market value of Fairfax stake was $5 million at Dec 31, 2022. My guess is this investment, because it performed so terribly post-IPO, has caused Fairfax some damage to its reputation (given Fairfax was the majority shareholder). Learning: Yup, SPAC’s were a bubble. The good news: carrying value is $71 million. This is now a small investment for Fairfax. 5.) Eurobank (2014): Fairfax invested $444 million in Eurobank in 2014. This initial investment went to close to zero later that year when the ECB mandated a 1-for-100 reverse share split. What was the problem? Greece was in the midst of a depression. What did Fairfax do? It doubled down and invested another $389 million in Eurobank in 2015. In 2019, Eurobank did a capital raise/merger with Grivalia. Greece elected a pro-business government in 2018. Eurobank fixed its balance sheet. Learning: Because the strategy worked in Ireland doesn’t mean it would work in Greece. The good news: Greece’s economy is well positioned. Eurobank, always well managed, is executing well and earnings are spiking. Share of profit of associates was $263 million in 2022, up from $162 million in 2021. Prem estimated Eurobank could earn €0.20/share in 2023; if so, Fairfax’s share of profits for Eurobank could be +$300 million in 2023. This investment is turning into a home run for Fairfax - a Greek tragedy turns to a triumph! 6.) AGT (2017): Fairfax invested $148 million in AGT in 2017. In 2019, as AGT was experiencing financial difficulties, Fairfax took AGT private, spending another $227 million (I think). Learning: It takes much more than a dynamic Canadian founder to succeed. The good news: from 2022 Fairfax AR: “AGT, run by founder and CEO Murad Al-Katib, had a record year in 2022, with EBITDA of over Cdn$150 million. This is a dramatic improvement from the time of the take-private transaction almost four years ago when the business was generating slightly over Cdn$60 million in EBITDA… Fairfax has an approximate 60% stake in AGT.” 7.) Commercial Industrial Bank (CIB) Egypt (2014): Fairfax invested $330 million in CIB in 2014. Today the position is worth about $240 million. Great company. Solid management. What is the problem? Egypt’s economy has been a slow-moving train wreck for decades - with constant currency devaluations. Learning: Constant currency devaluations (like 50% in the last year) hurt equity values. The good news: the bank is well managed. 8.) Mosaic Capital (2017): Fairfax invested $116 million in Mosaic in 2017. In 2021, Mosaic was taken private (not by Fairfax) with Fairfax owning 20% of the new investment. This investment went sideways for many years (that opportunity cost thing). Learning: not every investment you make is going to work out. The good news: Fairfax found a partner where Mosaic will hopefully be a better fit. 9.) Recipe/CARA (2014 & 2016): Fairfax made a couple of restaurant investments from 2014-2017: $77 million in the Keg in 2014 (merged with CARA in 2018) and $100 million in the CARA capital raise in $2016. Recipe/CARA was a poor investment for minority shareholders over its lifetime. Learning: the restaurant business in Canada is a tough business. Consolidating it proved to be even tougher. The good news: In the take private deal in 2022, Fairfax purchased Recipe at a Covid-low price. Recipe has a solid collection of assets that should be able to produce a solid amount of free cash flow for Fairfax moving forward. 10.) Astarta (2017): Fairfax invested $104 million in Astarta in 2017. Today that investment is worth around $45 million. I know very little about this investment. I wonder if it is not a similar situation to CIB, with opportunity cost being the big issue. Honorable mention: Torstar was initiated as a position before 2014 so I did not include it. However, Fairfax added to its position in 2014, 2016 and 2017 (yes, small amounts). In 2020 it sold the business and booked a $52 million loss. I see lots of self-inflicted wounds in the investments listed above – reading the list reminds me of the Monty Python skit “tis but a scratch".
-
The Eurobank investment for Fairfax has many twists and turns. There was the initial investment, which effectively went to zero. The second large investment. And the merger with Grivalia Properties. Eurolife is also an important part of the story (it was owned by Eurobank and they still own 20%). To do a proper analysis of Fairfax’s investment it needs to include Eurobank, Grivalia Properties and Eurolife. The bottom line, since 2000 this investment has worked out fabulously well for Fairfax. And Eurobank looks very well positioned today. Which is all I really care about today (since my current position in Fairfax was established in late 2020).
-
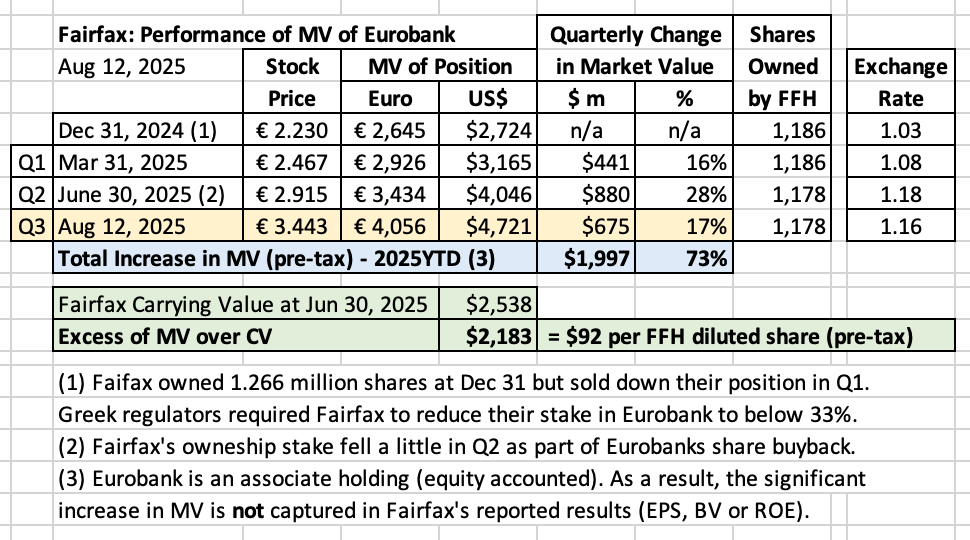
It appears investors liked Eurobank's Q2 results. Fairfax's investment in Eurobank is up $675m ($28/diluted FFH share) so far in Q3-2025. That is a monster move in 6 weeks. Fairfax's investment in Eurobank is up $2 billion YTD-2025, or about 73%. This is a crazy move in 7.5 months. Excess of FV over CV is about $2.18 billion ($92/diluted FFH share pre-tax). This is value that has been created that is not captured in EPS, ROE or BV. Also nuts. ---------- PS: The number of Eurobank shares owned by Fairfax dropped a little in Q2 due to the Eurobank stock buyback.
-
It is normal for a stock to fluctuate 40% in value over the course of one year (comparing 52 week high with 52 week low). Buffett says a long term shareholder should welcome a low stock price - it gives management the opportunity to buy back stock on the cheap. One of the keys with share price changes is timeframe… if it is today or this week or this month… well, good luck with that. If it is 5 or more years… well things get much easier the longer your timeframe. Chapter 8 of the Intelligent Investor is the best thing to read to help build a good mental model on this topic. In terms of how Fairfax intends to surface value, they have lots of options. Two quick examples for perhaps the two largest ‘hidden values’: 1.) Eurobank - reduce ownership stake to below 20%. 2.) BIAL - Anchorage IPO should do the trick. But why would they want to sell an asset that is cheap, has strong fundamentals, is well managed and has strong prospects? Let these puppies compound in value for a few more years. Every year Fairfax is opportunistically harvesting/surfacing ‘hidden value’. So far this year it was Sigma (Q1) and Praktiker (Q3). In 2024 it was the Digit IPO (confirmed value), Stelco and Peak. In 2023 it was Ambridge and GIG. In 2022 it was pet insurance and Resolute Forest Products. In 2021 it was the sale of their corporate bond portfolio (at 1% yields). The buyback of their preferred shares is surfacing ‘hidden value’. The recent split of Quess into three companies is an example of Fairfax surfacing value (this time hidden in Quess). The same playbook was used when IIFL was split into 4 companies and it worked out fabulously well. Yes, we do not know what Fairfax will do or when. And we don’t need to. What we need to know is that value is being created. That is what I focus on. And given the quality of Fairfax’s collection of equity holdings significant value is now being created each and every year. It is like a spring that is getting coiled - tighter and tighter every year (hidden value is spiking higher). And I love it. Welcome to new Fairfax. All that is required is patience.
-
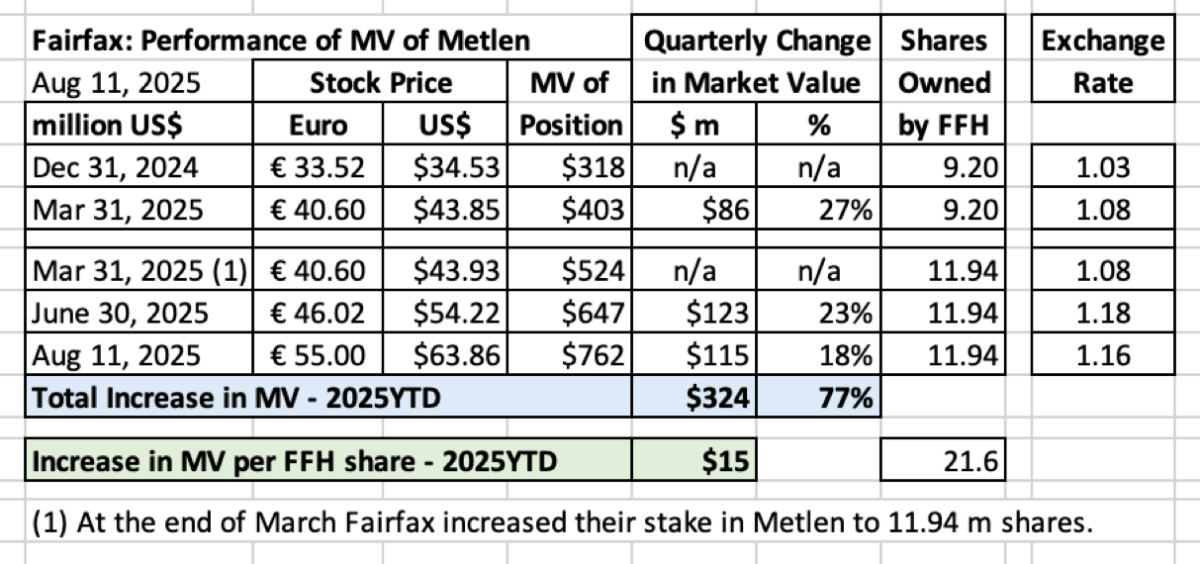
Metlen's listing on the LSE (on Aug 4) appears to have been a catalyst for the shares. Fairfax's investment in Metlen is now valued at $762 million (making it Fairfax’s 6th largest equity holding). 2025YTD, it has increased in MV by about $324 million or 77%. Outstanding. $MTLN $MYTIL.AT Q1 = $86 million Q2 = $123 million QTD-Q3 = $115 million
-
-
@Parsad, if I was in Wade’s shoes, and I wanted to sell some Fairfax for estate planning reasons I probable would start with my RRSP. Actually that is what I have been doing. RRSP’s are wonderful accounts but too much is not a wonderful thing. One day they will be taxed at +50% (at death). It is great to grow an RRSP to a couple of million. But much more than that and it becomes pretty much impossible to ever wind down in a tax efficient manner. Especially if you plan on working into later in life. All of my Fairfax is held in my TFSA and non-registered accounts today (those are the accounts I want to grow the fastest). I put my best ideas in those accounts. Today I hold very little Fairfax in my RRSP/LIF’s (this is where I do my tactical trades with Fairfax).
-
@sholland, I think Fairfax includes what I call 'non-insurance consolidated ops' in their calculation of operating income (under 'share of profit of associates and consolidated non-insurance income'). If this is accurate, this would add $270 million to 2025E and $450 million to 2026E. This also would put them comfortably over their 2025E of $5 billion. I probably should start to include 'non-insurance consolidated ops' in my calculation of operating income. What do board members think? Yes? or no?
-
@djokovic1, I think we are very similar in how we are looking at things. 1.) For 2025, I think my estimate for investment gains might be light. But I did lean out a little with underwriting, interest and dividend income and share of profit of associates. Bottom line, investment gains could surprise to the upside each year moving forward (Fairfax is sitting on so many material assets they could monetize). A big part of the returns from the equity portfolio are showing up in the excess of FV over CV bucket. My estimate for investment returns are 10.1% for 2025 and 8.0% for 2026 (and I include excess of FV over CV). 2.) What do they do with significant earnings from 2025? Blizzard Vacatia investment in January ($835 million). Grow size of fixed income portfolio (in addition to Blizzard Vacatia). Equity investments: Buy out minority owner in Recipe. Buy out minority holders in KRIF. Materially increase size of investment with Waterous. Increase size of investment in Metlen, Cleveland Cliffs and Foran. buy back stock. Move to 100% ownership in Allied World - Q4? The big ‘investment’ is taking out the minority partner in Allied World (if it happens). This will reduce ‘non-controlling interests’ and increase ‘net earnings attributable to Fairfax shareholders.’ I took down ‘non-controlling interest’ for 2026. Recipe is getting a bunch of attention. As a result, their earnings should increase nicely in 2026. The large Waterous investment is long term in nature and it is a commodity investment (oil) so it will be volatile and will likely take a few years to come together. Anyways there are some examples of things I built into my 2026 forecast. I am likely light on the net impact - I have been every year for the past 4.
-
@Santayana, I have done as you suggest each of the past three years and I have been proven wrong each time. The reason is not that Q3 losses are not elevated but that Q4 tends to be quite favourable (the level of reserve releases will be key). With my 2025 forecast I tried to nail the final number (we are less than 5 months away). 50% chance it is a little higher. And a 50% chance it is a little lower. With my 2026 forecast I think there is a little more conservatism. 55% it is higher. 45% chance it is lower. I appreciate the question. Please keep them coming.
-
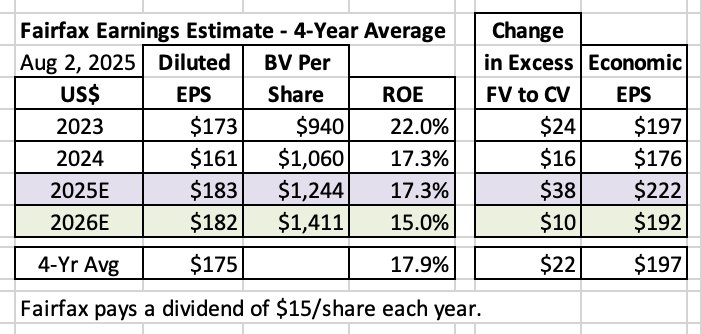
Earnings Estimate For Fairfax For 2025 and 2026 Below is my updated earnings estimates for Fairfax for 2025 and initial estimate for 2026. This forecast includes learnings from Fairfax’s AGM (in April) and Q1 and Q2 earnings reports. And general developments since my last update (which was on March 15). My old estimate for 2025 was diluted EPS of $161/share. Yes, I know... I am such a Fairfax fanboy! Let me know your thoughts. Too optimistic? If so, why? Or too pessimistic? If so, Why? Summary For 2025, my current estimate is diluted EPS at Fairfax will be about $183/share. This does not include the increase in excess of fair value over carrying value for Fairfax’s associate and consolidated holdings. I expect ‘excess of FV over CV’ to deliver another $38/share (after tax) in value in 2025. So, my forecast for ‘economic EPS’ for Fairfax in 2025 is about $221/diluted share. For 2026, my initial estimate is diluted EPS at Fairfax will be about $182/share. This does not include the increase in excess of fair value over carrying value for Fairfax’s associate and consolidated holdings. I expect ‘excess of FV over CV’ to deliver another $10/share (after tax) in value in 2026. So, my forecast for ‘economic EPS’ for Fairfax in 2026 is about $192/diluted share. Over the 4-year period, from 2023 to 2026E, diluted EPS at Fairfax is poised to average about $175/share and the increase in ‘excess of FV over CV’ is poised to average about $22/share (after tax). This would put the average increase in ‘economic EPS’ each year from 2023 to 2026E at about $197/diluted share. This amount is likely a good number to use as a baseline (starting point) when trying to estimate ‘economic EPS’ for Fairfax in future years (2027 and further out). With shares trading today at around $1,750, this gives it a PE of about 9x 'normalized economic EPS.' That is very cheap for a company of Fairfax's quality, earnings and prospects. Will retained earnings be re-invested in a way that builds value for shareholders? Perhaps the hardest piece to forecast with Fairfax today is what they will be doing with the substantial amount of earnings that they are currently generating (about $4.5 billion per year). And the impact the re-investment of current earnings will have on future earnings. Both the size - how much. And the speed - how fast. When it comes to re-investing earnings, Fairfax has lots of very good options: Grow insurance - Continuation of the hard market? Bolt-on acquisitions? Buy out minority partners in insurance (Allied World/Odyssey)? Buy fixed income securities? Buy equities? Buy back a meaningful amount of Fairfax stock? What Fairfax does will determine which of Fairfax’s 5 income streams will grow the most. Because we don’t know what Fairfax will actually do when we build our forecast, we have to guess which income streams will benefit and by how much. Please keep this in mind when you review our forecast – it is a guess at a point in time. As results come in each quarter, we will update our forecast to reflect the new news. Looking at the last 5 years, the management team at Fairfax has done an outstanding job with capital allocation. My guess is they will continue to make good decisions (on balance) and this will benefit shareholders in the coming years – likely providing a tailwind to my forecasts for 2025 and beyond. What are the key assumptions we have used to build our forecast? To estimate future EPS, BVPS and ROE for Fairfax, an investor needs to think about three things: Combined ratio – How good is the P/C insurance business? Total return on the investment portfolio – How good is the team at Hamblin Watsa? Capital allocation – How good is the senior management team? Note, when calculating the total return for the investment portfolio, I am including the change each year for ‘excess of FV over CV’ for associate and consolidated holdings. As stated earlier, this is value that is being created by Fairfax and it needs to be incorporated into models. Interest rates: I am assuming interest rates remain roughly at current levels (at August 2, 2025). Of course, this will not be the case. The average duration of Fairfax’s fixed income portfolio (about 2.4 years) is less than the average duration of their insurance liabilities (a little under 4 years?). Changes in interest rates will offset (in ‘net gains/losses on investments’ and ‘effects of discounting and risk adjustment- IFRS 17’) but not perfectly. Bottom line, with IFRS 17, changes in interest rates will result in less volatility in Fairfax’s reported final results moving forward – but there will be some volatility. The investment community should like that (the less volatility part). Below is a 6-year snapshot of earnings for Fairfax. It communicates in a concise manner the dramatic transformation that has happened at the company, beginning in 2021. There has been a spike in operating income per share – from an average of $39/share from 2016-2020, to $235/share in 2024. This much higher amount has become the new baseline for the company. For 2025, my estimate has operating income coming in at $229/share, which is a 487% increase from the average from 2016-2020. ‘Normalized earnings’ at Fairfax have moved to a much higher level – and, importantly, this higher level looks durable/sustainable. What are analysts’ current earnings estimates for Fairfax? At Aug 6, 2025, analysts’ average diluted EPS estimates for Fairfax are: 2025 = US$185 2026 = US$187 These estimates do not include changes in the value of ‘excess of FV over CV’ for associate and consolidated holdings. Yes, analysts today understand Fairfax much better than they did a year or two ago. As a result, their average diluted EPS estimates are much more accurate than they were. Here are the most important assumptions that went into each line item in our forecast: 1.) Underwriting profit: Estimate = $1.55 billion in 2025. Net premiums written growth of 5% in 2025. Yes, the hard market is slowing. Combined ratio (CR) of 94% in 2025. Catastrophe losses: 2025 will finish the year higher than 2024. Reserve releases: continuation of the positive trend observed in 2024. 2.) Interest and dividend income: Estimate = $2.6 billion in 2025. Tailwinds: The size of the fixed income portfolio continues to increase (from $47 to $50 billion. Interest income from $810 million investment in Blizzard Vacatia Equity Partners. Continued growth of mortgage loan portfolio (managed by Kennedy Wilson). Headwinds: Lower short-term interest rates. The average yield of the fixed income portfolio was about 5.1% in 2024. For 2025 we estimate the average yield will be about 5.1%. 3.) Share of profit of associates: Estimate = $770 million in 2025. Earnings at Eurobank and Poseidon/Atlas should continue to chug along. Headwind in 1H not expected to continue in 2H: Unrealized loss of $157.7 million on Waterous III investment in Greenfire. Two more headwinds for 2025: Shift of Peak Achievement to a consolidated holding ($57m). Sale of Stelco ($18m). 4.) Effects of discounting and risk adjustment (IFRS 17): The two key drivers for this bucket are the trend in net written premiums of the insurance business and changes in interest rates. Net written premiums growth of 5% in 2025 should be a small tailwind. We assume Treasury yields remain constant at June 30 levels. This bucket is difficult to model – therefore, my confidence level in my estimates is low. Important. Plug number. For actuals, we are combining Bucket 4 (impacts from IFRS 17) and Bucket 5 (life insurance and run-off) together. We do not get either of these numbers from Fairfax. However, we can back in to the total for these two buckets (because they give us all the other numbers we use in our earnings model). 5.) Life insurance and runoff: Estimate = a loss of $150 million in 2025. Adverse reserve development at runoff should be offset by earnings from the life insurance business in Greece. 6.) Non-insurance consolidated operations (Other revenue – expenses): Estimate = $270 million in 2025. This income stream has a number of significant tailwinds for 2025: Acquisitions: Sleep Country (closed Oct 1, 2024). Shift from associates: Peak Achievements and Meadow Foods (Q4, 2024). This bucket is poised to grow nicely in the coming years. 7.) Interest expense: Estimate = $828 million in 2025. Run rate: Q2 2025 = $208 million 8.) Corporate overhead and other: Estimate = $470 million in 2025. An increase from 2024, which was $450 million. 9.) Net gains on investments: Estimate = $2.4 billion in 2025 Key drivers in 1H-2025: FFH-total return swaps Increase in value of remaining mark to market holdings. Benefit from decline in bond yields. Realized gain on sale of Sigma in Q1 = $178.7 million 10.) Gain on sale/deconsol of insurance sub: Estimate = $0 in 2025 This is where I put the large asset sales/revaluations. These items are very lumpy and therefore difficult to forecast precisely for any one year. Sometimes these gains show up as a separate line item and other times they show up in investment gains. I like to break them out at the start of the year as a separate line item. Over the past 5 years, large one-time gains from asset sales/revaluations have averaged about $500 million per year – so using an estimate of $400 million for 2026 seems like a reasonable and conservative estimate. Bottom line, this bucket is a wild card. But Fairfax has a long history of surfacing the significant value that is residing/hidden on its balance sheet. When they do, we see significant realized gains (from both insurance and non-insurance holdings). 11.) Income taxes: Estimate = 21% for 2025 Fairfax’s tax rate was 24.4% in 2024. We expect investment gains to be a significant driver of earnings in 2025 – and these are taxed at a lower rate. 12.) Non-controlling interests: Estimate = 7% for 2025 As Fairfax continues to take out its minority P/C insurance partners this number should shrink. In 2024, Fairfax took out its minority partner in Brit. Later in 2025 it is likely they will increase their ownership in Allied World. As minority P/C insurance partners are taken out, non-controlling interest should continue to shrink in size. 13.) Effective Shares Outstanding (year-end): Estimate = 21.4 million for 2025 We focus on effective shares outstanding as this is what Fairfax highlights in their reporting. Fairfax finished 2024 with effective shares outstanding = 21.7 million. This was down 1.3 million in 2024 (from 23.0 million at 2023YE). In 2025, we estimate Fairfax will reduce effective shares outstanding by 300,000 which is a slower pace compared to 2024. Additional notes: ‘Underwriting profit’: Includes insurance and reinsurance; does not include life insurance and run-off. ‘Interest and dividends’ and ‘share of profit of associates’: Includes insurance, reinsurance and life insurance and run-off.