Viking
-
Posts
4,928 -
Joined
-
Last visited
-
Days Won
44
Content Type
Profiles
Forums
Events
Everything posted by Viking
-
+35% for the year. The driver was Fairfax - simply an amazing year. I also had lots of single base hits - the volatility made trading around positions work really well (oil, US banks, retail etc). The run the last three years with Fairfax has been epic (at least that is how my kids would likely describe it). The crazy thing is i think Fairfax has lots left in the tank (it continues to be my largest holding by far). I have also started to diversify my portfolio. I now hold 25% in index funds: XIC.TO, VOO and VO. About 1/3 in each. My total portfolio is now of a size that i want to put a big chunk of it on ‘set and forget’. My plan is to grow the index portions to +50% in the coming years. Part of that is wealth preservation - versus going for maximum return. Historically, my strength has been avoiding bear markets. My weakness the past couple of bear markets is being too cautious coming out of them. Index funds are a nice solution: lock in the gains and stay invested. Today, other than Fairfax, i don’t have any ‘strong conviction’, table pounding, ideas. A little surprising - to me at least. I see lots of cheapish things but not much that i think will materially outperform an index. So i am happy to increase my allocation to index funds because i am bullish on the economy and stocks in general in the coming years. Of course, all of this could change. And that is what i love about investing.
-
@Ross812 from my perspective the big unknown with Fairfax is asset sales/monetizations/revaluations. Will be get one big one - +$500 million - over the next 4 years? Two big ones? Or do we get a number of smaller ones - $250 million to $500 million - like the 2 we saw in 2023 (Ambridge and GIG). - Digit IPO and getting to 74% ownership - Anchorage IPO - BIAL - Stelco - does it get taken out? - AGT Food Ingredients - delivered +$100 million in EBITDA in 2022 (if i remember correctly). Time to spin out? - Foran Mining - will we need more copper in about 2 years? I could go on. Fairfax has lots of levers to pull to surface significant value. Bottom line, one or two big moves here (or a number of smaller moves) would really move the needle in terms of BV growth, which would likely pop the stock price. What i like about Fairfax today is most investors expect zero in their earnings estimates / valuation models for big gains. I don’t build them into my models (until they are announced) - hence why i think my estimates will likely prove to be conservative.
-
@bargainman my strategy has been to invest in Fairfax only when i am in agreement/aligned with the general positioning of their investment portfolio. As i have stated before, I like what they have been doing since about 2018 (in aggregate).
-
@bargainman I have looked at Fairfax in lots of different ways over the years but i have never attempted that type of analysis - there are so many important moving/unknown parts i am not sure it can be done in a quality way. One of the challenges is we have incomplete information - Fairfax has lots of equity investments that are of significant size that we know nothing about. Fairfax is also very active - positions change. Part of the analysis would need to include dividends. And what do you include? Do you include the TRS-FFH? How do you value a company like AGT Food Ingredients? Or Bauer Hockey? Or the significant private equity holdings? The other question: what benchmark should be used? S&P500, which is dominated by 7 or 8 companies? At the end of the day, from my perspective, what really matters is total return on the total investment portfolio. And how does Fairfax’s performance compare to peers? That we can take a stab at. My math says Fairfax is tracking to earn 8.1% in 2023. And my estimate is for Fairfax to earn around 7.2% in 2024 and 2025. My estimates for 2024 and 2025 assume zero from large asset sales / revaluations - which i think will be wrong. My guess is Fairfax will continue to monetize/revalue some assets in the coming years so 7.2% will likely be more like 7.5% or higher. My guess is Fairfax is earning best-in-class total returns on its total investment portfolio when compared to other P/C insurance companies (most of whom are likely earnings in the 4 to 5% total return range). And I expect the large outperformance by Fairfax to persist in the current environment (where active management matters once again). ————— Another approach would be to look at Fairfax’s largest equity investments. The big three are Eurobank, Poseidon and FFH-TRS. These three holdings represent about 33% of Fairfax’s equity holdings. If you look at Fairfax’s top 12 holdings, that would get you to about 60% of their equity holdings. That might be a pretty good proxy for how the total equity portfolio was performing.
-
@Spekulatius i agree that we will see some tailwinds turn into headwinds in the coming years. At the same time we will see some headwinds turn into tailwinds. Insurers are in the capital management business - and the well run companies will make adjustments. Fairfax likely has more options than any other P/C insurer. I think the relationship between CR and interest rates is way more complicated than people think. Why? 1.) there is no insurance market. There are many insurance markets. Workers comp is still in a soft market - its hard market is likely coming. Personal (auto) has been a terrible business in recent years - and it is a very large market. Reinsurance (property cat) looks to be in a hard market. This is just for the US. Each region of the world also has its own unique characteristics. All these lines and regions have their own unique insurance cycle. Sometimes they line up and other times (like now) they do not. WR Berkley talked about this on one of their conference calls this year. 2.) interest rates are not having a significant impact on investment portfolios today. The Swiss Re Institute released a comprehensive study recently and they are projecting portfolio returns to tick modestly higher in both 2023 and 2024. Most P/C insurers were not positioned like Fairfax was in 2021 - so they are not seeing a spike in interest income. If interest rates go lower in 2H 2024 most insurers will likely have missed the big move higher. I also think the whole CR/interest rate discussion matters way less for Fairfax compared to traditional P/C insurers. 3.) For Fairfax, today only 20% of their various income streams comes from underwriting profit and 80% comes from other sources (40% from interest and dividends, 20% from share of profit of associates and 20% from mark to market equities and investment gains). Underwriting profit is a much more important income stream for traditional P/C insurers. So even if the CR at Fairfax declines slightly in the coming years (this is not a given), given its small relative size, it will likely have a small impact on Fairfax’s total earnings - the total $ decline will likely easily be absorbed by another income stream. 4.) everyone is laser focussed on interest income today. Guess what rarely gets discussed? Equities/non-interest bearing investments. Even at Fairfax. Why? Equities have been in a bear market - pretty much everything ex the magnificent seven. This will reverse. And when it does Fairfax will likely see some big gains from its equity portfolio - likely +$2 billion in one year. And to really blow your mind (love the Matrix movie), try and forecast these individual buckets with precision looking out 3 or 4 years.
-
Ho Ho Ho! To everyone on the board: may your holiday season be filled with joy, laughter, and cherished moments with family and friends.
-
@petec i build my forecasts from the bottom up. You can see all my assumptions for 2024 and 2025. After 2025? Looking out 3 years or more i do not have any hard numbers. But for operating income, $200/share looks to me like a reasonable baseline to use. There will be lots of important puts and takes: - share count: will likely come down, perhaps meaningfully (i think 2% per year is meaningful if sustained over many years) - minority interest: Fairfax will likely continue to take minority partners out - leverage: Fairfax will likely continue to use leverage. The GIG acquisition includes a sizeable ‘promissory note’ All three of these things will meaningfully impact the $200/share number looking out 5 years (and how much accrues to Fairfax shareholders). - net written premiums: my guess is this will continue to grow. Even if hard market ends? Yes. How? No idea, but GIG acquisition might provide a clue. - size of fixed income portfolio: i expect this to continue to grow. $55 billion is not a crazy number looking out 5 years (it is $41 billion today). - dividends: Eurobank could increase this by 50% in 2024. This bucket should grow nicely each year moving forward. - share of profit of associates: Stelco is delivering close to zero today. Guess what it will deliver in the next steel up-cycle? Earnings at Poseidon/Atlas have been a mild headwind (underperforming); my guess is this will flip to a tailwind. More holdings will likely be coming into this bucket which would be another tailwind. The Hellenic Bank acquisition should be a big tailwind for Eurobank. Now you asked about interest rate and CR. I don’t have a strong opinion about either. Perhaps rates move lower looking out 3 years. Or perhaps interest rates move higher again (perhaps we get a resurgence in inflation in 2H 2024 or 2025), which gives Fairfax the opportunity to lock in high rates for longer in another year or two. Or perhaps we get an event that causes credit spreads to blow out (like what happened to the regional banks but on a larger scale), and Fairfax flips to higher yielding corporates. Perhaps the hard market continues to chug along. When the hard market ends perhaps it just goes sideways for 4 or 5 years (which i think is what usually happens). Perhaps Fairfax takes a bunch of the excess capital and buys back a bunch of stock and takes out some minority partners. Crisis and opportunity are different sides of the same coin. And Fairfax has excelled since 2018 at exploiting this relationship. I expect this to continue… i just can’t provide any details today of what they are going to do in 3 or 4 years time. You said in an earlier post that you felt the increase in interest rates was the primary driver of the increase in earnings at Fairfax. I couldn’t disagree more. My view is the biggest driver of earnings at Fairfax today are the collective decisions being made by the management team at Fairfax. Their many capital allocation decisions, some going back all the way to 2014. Fairfax’s future results (including where operating income/share goes) depends primarily on the decisions the management team has made and will make moving forward. External factors (the path of interest rates and the insurance cycle) matter, but much less. This is where Fairfax differs from most other P/C insurers.
-
@steph there are lots of things that could happen that would impact my earnings estimates. Some are bad. Some are good. Time frame also matters: short term or long term - some things will be short term negative and long term positive (and the opposite). A really bad year for catastrophe losses in 2024 would likely extend the current hard market - so it might be a positive looking out 2 or 3 years. If Fairfax’s stock sold off aggressively this would give the company the opportunity to buyback a meaningful amount of shares on the cheap - which would be a big positive looking out 2 or 3 years. Bottom line, we know all of my estimates will be wrong. What we don’t know is if they will be too high or too low - and by how much. Especially over a couple of years. And that is the fun/interesting part of investing.
-
Operating income at Fairfax averaged around $40/share from 2015-2018. During this time, Fairfax was experiencing big losses from equity hedges and its new equity purchases were pretty terrible (APR, Farmers Edge, Fairfax Africa, AGT, Exco bankruptcy etc). Insurance was a tough business. Interest rates were low. Over this same timeframe, Fairfax’s stock price averaged around $525. That is what investors felt all the above was ‘worth.’ In 2024, operating income at Fairfax could come in around $200/share. This number is sustainable. That is 5 times higher. That is a massive increase in quality earnings. Capital allocation has been MUCH better from 2018-2023. Actually, it has been exceptional. Interest rates are much higher (even at current levels). Insurance has been in a 4 year hard market - and the business is now twice the size. Fairfax’s stock price today is $890, up a ‘whopping’ 70% from its average 2015-2018. Do people seriously think Fairfax is close to being fully valued today at $890? It appears we are at the ‘wall of worry’ phase with Fairfax. All the hand wringing on this board is probably a pretty bullish set up for the stock. I keep coming back to this… the key is earnings. And what a ‘normalized’ level is for Fairfax. There is no consensus on what this number is today. IF the number is (as i suspect) $150/share then Fairfax is still crazy cheap. If correct, Fairfax should be able to grow this by 8-10% per year over the next couple of years (with volatility). And with this, we should see modest multiple expansion. With very modest assumptions it is fairly easy to get a double in Fairfax’s stock price over the next 3 to 3.5 years. How? 1.) 2023YE BV = $925 2.) modest earnings growth each year - 2024 = $165 (lets be conservative here). - 2025 = $175 - 2026 = $185 3.) 2026BV = $1,450 (ignore dividends) 4.) modest multiple expansion to 1.2 x BV = $1,740 = double from current stock price. That would be a CAGR of 25%. Pretty good. What if earnings increase at more than $10/year? Likely in my view. What if the multiple goes to more than 1.2 x BV? Also likely. Well, your 25% CAGR gets even better. What are board members currently getting most wrong about Fairfax? 1.) what baseline earnings are today 2.) how good Fairfax is at capital allocation 3.) the impact record earnings and the magic of compounding will have on the trajectory of earnings over the next couple of years.
-
My mistake - edit has been made
-
@Hamburg Investor if i understand your question correctly, i think Prem is trying to provide a shorthand way to value Fairfax (this is just a guess): CR + Total return on investment portfolio = possible ROE = way to value Fairfax. Here is a link to an old writeup on Fairfax from 2019 that discusses this relationship. - https://www.woodlockhousefamilycapital.com/post/the-horse-story “Moreover, I think the assets collectively could generate a ~10%-type ROE. Watsa has made a public goal of hitting 15%. (FFH’s ROE was 15% in the second quarter, thanks to investment gains). He says a 95% combined ratio and a 7% return on FFH’s investments gets to a 15% ROE. “But in a low-interest rate environment, and given a large bond portfolio, a 7% return seems unlikely. But possible. Sustaining a double-digit ROE is key. (FFH can reach 10% by following a number of roads. For example, one road requires a ~95% combined ratio and ~5% return on its portfolio. That seems do-able.) “Anyway, a consistent 10% would grow book value at a decent clip and then you’d likely get an additional lift from the valuation even if the stock moved just to 1.2x book. As RayJay reports, a comparable set of North American insurers with an 11% ROE trades for 1.7x book value per share.”
-
@Xerxes i really enjoy the back and forth. Writing is a great way to think and get ones thoughts straight. Here is a good thought exercise. Go back to Fairfax version 2019. Look at all the important metrics. Now look at Fairfax 2023 and look at those same metrics. Importantly, look at all the decisions made each year from 2019-2023. The company is unrecognizable today to the company that existed 4 years ago. But here is the key: Fairfax did all of this when they had much lower earnings! Today Fairfax is earning gobs of money that is sustainable. Do people seriously think Fairfax in 2027 is going to resemble the Fairfax of 2023? Seriously?
-
That only makes sense if Fairfax puts the earnings under a mattress. Or if they allocate capital in a value destructive way. With each passing year, this is looking less and less likely.
-
@OCLMTL great add. I think what you are getting at is the power of compounding - earnings on earnings. It cracks me up that we have a bunch of value investors on this board who seem to be ignoring this ‘8th wonder of the world’ when they look at Fairfax and the significant earnings that is rolling in each quarter. Yes, we don’t know exactly what Fairfax is going to do. But does this mean we assign it a value of zero? Expecting Fairfax to earn 10% on reinvested earnings (on average) makes sense to me. Related, the size and timing of earnings matter. A lot. Well, at least that’s what Buffett says. Companies that get the cash flow up front are supposed to be valued higher. Especially if it outsized. Fairfax has been generating record operating earnings starting back in 2022. New record in 2023. Likely a new record in 2024. Outlook for 2025 and 2026 is good. This is a massive amount of earnings coming over a 5 year period. This pile of gold has been/will be reinvested each year. Those investments are/will grow new earnings streams. Which, over time, will grow into rivers. So in 5 years time guess what? The idea that earnings at Fairfax will flatline at $150/share for the next two years and then drop from there makes no sense to me. At least based on what we know today.
-
In terms of return on their total investment portfolio, I have Fairfax tracking at 8.2% for 2023. And 7.2% for 2024 and 2025. For both 2024 and 2025 i am modelling nothing for large realized gains: items like selling pet insurance or Ambridge. Or revaluing of GIG (this should drop into 2023). I think it is highly likely Fairfax will do something meaningful to surface value in 2024 or 2025. So i think my 7.2% estimate is conservative. What about 2026? And further out? That is simply a bet on management. And their capital allocation skills. Fairfax has been putting on a clinic the past 5 years when it comes to capital allocation. Volatility is a tailwind for Fairfax - not a headwind. Why do people expect they are going to all of sudden get stupid? From my perspective that approach is not being conservative.
-
@Haryana thanks for pointing out my error. I have corrected my post above. Assuming the news Dec 14 from KIPCO is accurate (and the GIG deal has been approved/has closed), it looks to me like Fairfax should be booking a gain of about $290 million in Q4.
-
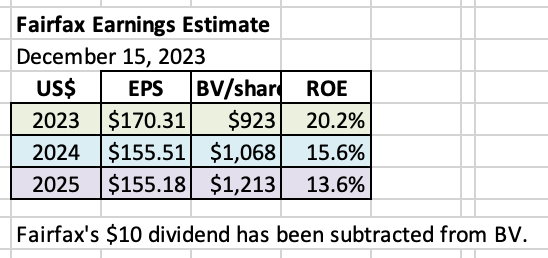
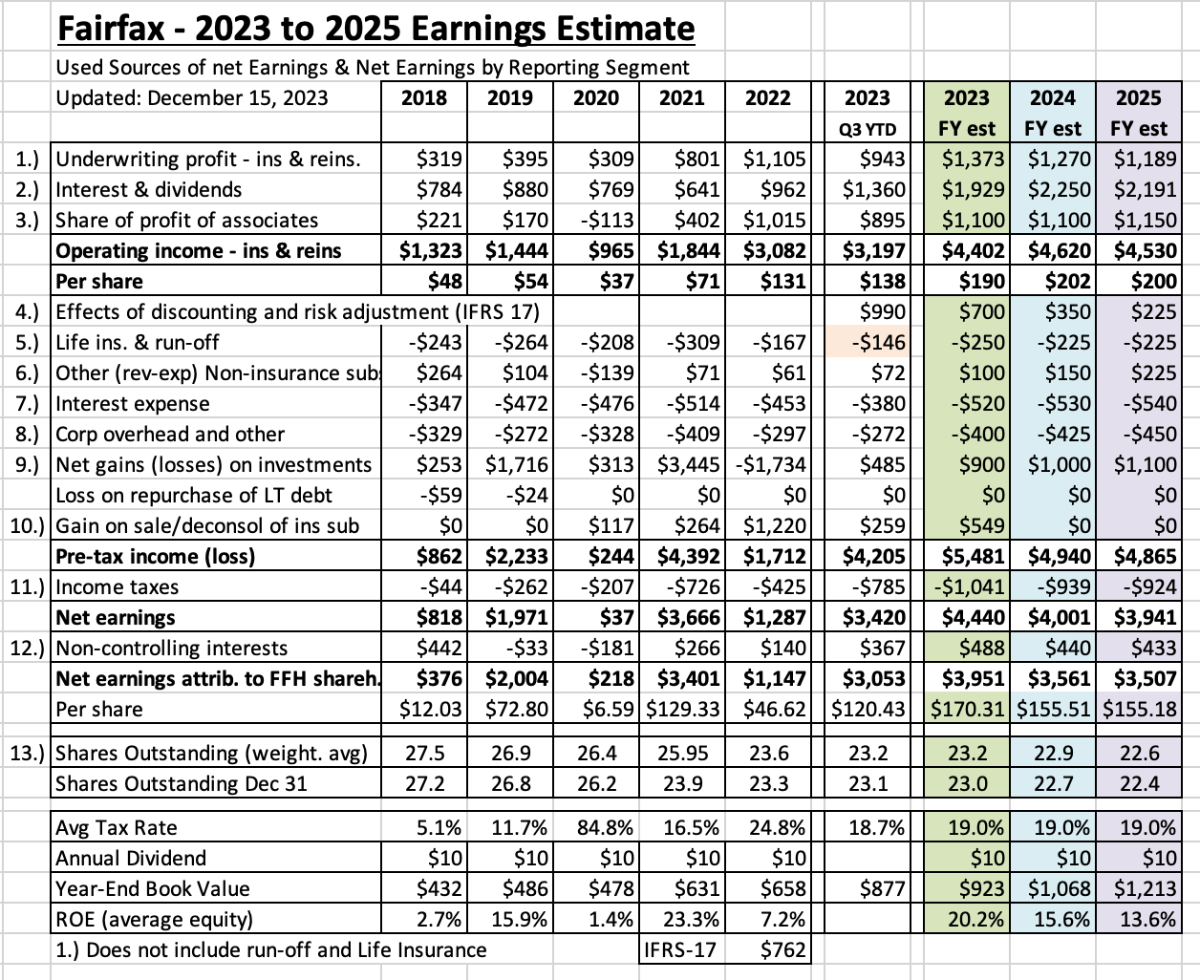
Below is an update to my 3-year earnings estimate for Fairfax. What line item in my full year earnings forecast for 2023 do you think I am most wrong with? Why? 2024? I do appreciate feedback (and I have thick skin). So please provide your comments! Please note, forecasts are a guess at a point in time. To state the obvious, things are constantly changing (and I am still learning about lots of stuff). As a result, my earnings forecasts quickly become outdated – and my frequent updates change quite a bit. These updates are intended solely for entertainment purposes – please keep this in mind. Since my last earnings update, below is a recap of a number of important developments: Fairfax reported Q3 results (and held a conference call) – which provided us with lots of new information. Interest rates, especially longer-dated, have moved significantly lower in November and December. This will impact Fairfax’s reported results: the $41 billion fixed income portfolio – a big tailwind? the ‘Effects of discounting and risk adjustment – IFRS’ bucket – a big headwind? On the Q3 conference call, Prem said Fairfax extended the average duration of their fixed income portfolio to 3.1 years in October (right before the plunge in yields). This could be another tailwind for the fixed income portfolio. But to do this, did Fairfax sell significant amounts of shorter dated bonds at a loss (as happened in Q1 when they aggressively extended duration)? If so, this part would be a headwind. On December 14, KIPCO communicated the GIG acquisition has closed. Fairfax previously reported they expected this to result in a realized gain of about $290 million which we should see in Q4 results. What other impacts will the GIG transaction closing have on Fairfax’s balance sheet and year-end results? Summary My current estimate is Fairfax will earn about $170/share in 2023 and about $155/share in both 2024 and 2025. What could we see for EPS in Q4? Reported earnings to September 30, 2023 was $120/share. If Fairfax finished the year at $170/share that would put Q4 earnings at $50/share. 2023-2025 Forecast A hard piece to forecast with Fairfax is capital allocation. Fairfax is generating a significant amount of earnings. But we don’t know today how the future cash flows will be invested. Looking at the last 5 years, the management team has done an outstanding job at capital allocation. My guess is they will continue to make good decisions (on balance) and this will benefit shareholders – likely providing a tailwind to my forecasts for 2024 and 2025. I am assuming interest rates remain roughly at current levels (at Dec 15, 2023). Of course, this will not be the case. Below is an 8-year snapshot for Fairfax. It communicates in a concise manner the dramatic transformation that has happened at this company, beginning around 2021. Look at the trend in operating income per share – it has increased from $48/share in 2018 to an estimated $190/share in 2023. The higher amount is looking like the new baseline for the company. It is a pretty amazing story. Fairfax today is like a phoenix, rising from the ashes of its past, renewed and stronger. What are the key assumptions? 1.) underwriting profit: Estimated to increase to a record $1.4 billion in 2023. Although slowing, it appears the hard market will continue into 2024. This should support mid-single digit organic growth. The Gulf Insurance Group (GIG) acquisition should add about $1.7 billion to net written premiums. Between organic growth and GIG, low double digit growth in net premiums written seems reasonable for 2024. Combined ratio (CR) forcasts: Full year 2023 = 94%. (YTD to Sept 30, it is at 94.3%) 2024 = 95% 2025 = 95.5% I am assuming a ‘normal/historical’ level of catastrophe losses in both 2024 and 2025. 2.) interest and dividend income: Estimated to increase to a record $1.9 billion in 2023. Interest rate pickup (re-investing maturing bonds): will this become a headwind in 2024? New business: starting in Q3, 2023, the $2 billion PacWest real estate loans started delivering incremental interest income; this should be a tailwind for 12 months. It was reported by Kennedy Wilson in December 2023 that Fairfax increased its commitment to the KW real estate debt platform by another $2 billion which suggests we could see a further pickup in yield in 2024. GIG should add about $2.4 billion to the total investment portfolio. Big tailwind for 2024. Eurobank: the plan is to start paying a dividend in 2024. If this happens, we should see a nice increase in dividend income. The path of interest rates will be key. Aggressive interest rate cuts from global central banks in 2024 would be a headwind to interest income later in the year. 3.) Share of profit of associates: Estimated to increase to a record $1.1 billion in 2023. Earnings at Eurobank, Poseidon, EXCO, Stelco and Fairfax India, in aggregate, should continue to grow nicely. Poseidon (interest expense) and EXCO (nat gas prices) could be headwinds. 2023 headwind: Resolute Forest Products was sold earlier in 2023. It contributed $159 million in 2022, which I have removed from my 2023 forecast. 2024 headwind: I estimate GIG will contribute $70 million in 2023. To reflect the GIG transaction, I removed $70 million from my 2024 estimate. 4.) Effects of discounting and risk adjustment (IFRS 17). The two key drivers for this bucket are the trend in net written premiums of the insurance business and changes in interest rates. Net written premiums should continue to grow around 7% in Q4 and should be a tailwind. For 2024, organic growth and the GIG acquisition should provide a nice tailwind. Interest rates further out on the curve have declined substantially in Q4. If interest rates hold at current levels into year-end, then this bucket could give back a chunk its gains from the first 9 months. How much? No idea. I have modelled a decline from the Q3-YTD number, but I really have no idea how all the puts and take will shake out for this bucket. 5.) Life insurance and runoff: This combination of businesses lost $167 million in 2022. This bucket is forecasted to lose $250 million in 2023 (it was at a loss of about $146 million at Sept YTD). Life insurance is likely a tailwind and runoff is likely a big headwind. 6.) Other (revenue-expenses) - Non-insurance subsidiaries: Results from consolidated holdings are estimated to finish 2023 at $100 million. Includes Recipe, Dexterra, AGT, Grivalia Hospitality, Boat Rocker, Farmers Edge etc. Do we get small write downs from both Boat Rocker and Farmers Edge? This bucket is poised to grow nicely for Fairfax in the coming years. It could surprise to the upside. Yes, the results will be lumpy. 7.) Interest expense: A slight increase to the current run rate. 8.) Corporate overhead and other: A slight increase to the current run rate. 9.) Net gains on investments: Estimated to finish around $900 million in 2023. Given the significant drop in interest rates, unrealized gains in the fixed income portfolio could be a big tailwind in Q4. To move to 3.1 years average duration in October, did Fairfax sell a bunch of short-dated bonds at a loss? If so, this part would be a headwind. As of Dec 15, equities should be a tailwind. My estimates for 2024 ($1 billion) and 2025 ($1.1 billion) assume (this is very general): Mark-to-market equity holdings of about $8 billion increase in value by 10% per year, or $800 million. I include the total return swap of 1.96 million Fairfax shares here; as a reminder, every $100 increase in Fairfax’s share price results in a $200 million gain. A small bump of $200 million per year from additional gains (equities and fixed income). 10.) Gain on sale/deconsol of insurance sub: This is where I put the large asset sales. In 2022, it was the sale of pet insurance business for $1.4 billion. In 2023, it is: Ambridge sale: closed May 10, 2023 and resulted in a pre-tax gain of $259.1 million. GIG acquisition: KIPCO reported the deal closed Dec 14. Fairfax previously communicated they will likely record a pre-tax gain of about $290 million. Moving forward, this bucket is a wild card. For 2024 and 2025, I estimate no gains from asset sales/write up of assets. I think this is highly unlikely – my guess is Fairfax will continue to surface value in its vast $57 billion investment portfolio/collection of assets: Perhaps we get a Digit IPO. Perhaps Fairfax sells another holding for a large gain. Developments here will be incremental to my earnings estimates - and a big reason why I feel my estimates for 2024 and 2025 could prove to be conservative. 11.) Income taxes: estimated at 19% (historical average rate) 12.) Non-controlling interests: estimated at 11% (historical average rate) 13.) Shares Outstanding: Estimated that effective shares outstanding will be reduced by 300,000 shares per year for each of 2023, 2024 and 2025. Fairfax reduced their share count over the first 9 months of 2023 by a little over 200,000 so my guess is they will finish this year around 300,000. In recent years, Fairfax has been much more aggressive on the share buyback front. This will be something to monitor moving forward. Notes: ‘Underwriting profit’: Includes insurance and reinsurance; does not include runoff or Eurolife life insurance. ‘Interest and dividends’ and ‘share of profit of associates’: Includes insurance, reinsurance and runoff. ————— Return on Equity Calculation Return on equity (ROE) is calculated below using ‘average equity’ which is: (PY ending BV/share + CY ending BV/share) / 2 I think most of the industry (other P/C insurance companies, analysts) calculate ROE using an average number for equity. So, this likely makes my estimates more comparable with industry numbers. My current earnings estimate has Fairfax achieving an ROE of 20.2% for 2023. Outstanding. And much better than the average of 10.1% that Fairfax delivered from 2018-2022.

-
@Hoodlum thanks for posting... made my day!
-
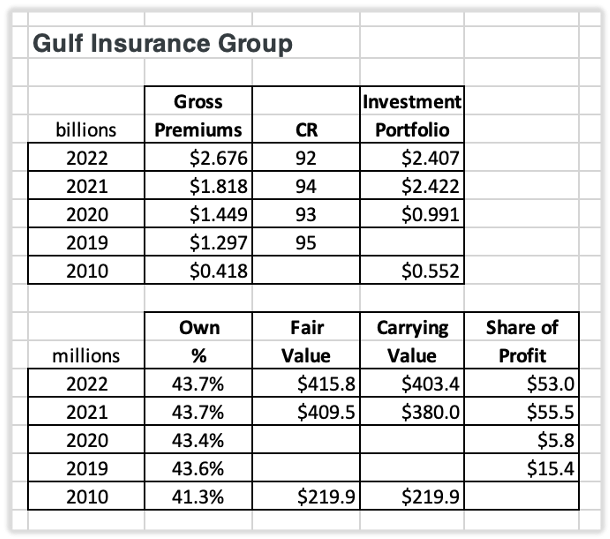
Earlier today, KIPCO announced the closing of the sale of their 46.3% interest in the Gulf Insurance Group (GIG) to Fairfax. Fairfax’s equity interest in GIG increased from 43.7% to a controlling interest of 90.0%. Based on the financial details that were provided in Fairfax’s Q3 interim report, Fairfax is making an upfront payment of around $177 million. And then 4 equal annual payments of $165 million, beginning Dec 14, 2024. “The company's acquisition of all of KIPCO's shares in Gulf Insurance will be for aggregate fair valuation consideration of approximately $740 (approximately 227 million Kuwaiti Dinar), to be paid as approximately $177 in cash ($200.0 less dividends of approximately $23 received by KIPCO during the second quarter of 2023) and the fair value of approximately $563 in a payment deed.” Fairfax will book a significant gain of around $290 million when it reports Q4 results. “Accordingly, the company anticipates that upon closing it will consolidate the assets and liabilities of Gulf Insurance and will record a pre-tax gain of approximately $290, with changes in the company's carrying value of its equity accounted investment in Gulf Insurance up until the date of closing affecting the pre-tax gain.” This purchase will be an important growth driver for Fairfax’s results in 2024. The timing of the news is important (before year-end), so we will get more complete details of the financial impact on Fairfax when they report Q4 results in Feb 2024. Now that the deal has closed, analysts can include GIG in their estimates for Fairfax for 2024. Below are highlights of GIG’s full year financial results from 2022: Net premiums written $1.7 billion Underwriting surplus $164 million Total Investments $2.4 billion Shareholder’s equity $748 milion Net profit $125 million Some random thoughts on the GIG purchase: Fairfax goes from being a minority shareholder in GIG to the controlling shareholder. This is a big deal. Strategically, this secures Fairfax’s position as one of the leading P&C insurance providers in the Middle East North Africa (MENA) region. This is a big deal. Gulf economies, with young and growing populations, are expected to be strong growers in the coming decade. Growing economies should be good for an insurance business. This purchase highlights a couple of strengths of Fairfax: International - this has been a growing part of Fairfax’s insurance business for 20 years Partner with leading organizations - in this case KIPCO Long term focus - this transaction was incubating for 13 years Capital allocation Fairfax is earning a record amount of operating earnings in 2023 and the set-up for the next couple of years looks outstanding. What will Fairfax do with all the cash that is raining down? “The best stock to buy is the one you already own.” Peter Lynch The past couple of years, Fairfax has been cannibal investing (gorging) - buying significantly more of companies it already owns. GIG is the latest example of this strategy. Fairfax owned 43.7% and now they own 90%. This is such a good strategy because it is very low risk. They understand GIG very well, having been closely involved with the company for the past 13 years. Fairfax is also paying up for quality (and to get control of the company). Bottom line, this purchase makes Fairfax a more profitable and higher quality company. ————— GIG recently updated their web site. They added lots of new information. Below are links to a couple of presentations and investor relations. Investor Presentation – May 2023 (short – 7 pages) https://www.gulfinsgroup.com/media/GIG_Investor_Presentation_2023_EN_Final.pdf Corporate Profile https://www.gulfinsgroup.com/media/GIG-Corporate-Profile-ENG_D5wymRk.pdf Investor Relations https://www.gulfinsgroup.com/en/investor-relations/ ————— In 2010, Fairfax invested $217 million for a 41.3% interest in Gulf Insurance. Fairfax partnered with KIPCO (Kuwait), the controlling shareholder of Gulf Insurance. GIG became the vehicle for Fairfax to grow its insurance business in the MENA region (Middle East North Africa). The growth for the next 10 years was largely organic. Late in 2020, as the world was struggling with covid, GIG opportunistically agreed to purchase the insurance operations of AXA Gulf & Yusuf Bin Ahmed Kanoo for $475 million. This purchase almost doubled the size of GIG - it was a big, bold move. Parent AXA was looking to re-build its capital levels due to losses experienced from covid. The purchase closed in Sept of 2021. Fairfax did invest new money in GIG (as did KIPCO) in 2021 to keep its ownership in GIG steady at 43.7% (not sure exactly how much they spent). The shares of GIG are publicly traded on the Kuwait stock exchange. However, they are thinly traded, with KIPCO and Fairfax together owning 90%. Who is KIPCO? Kuwait Projects Company (Holding) – KIPCO – is a holding company that focuses on investments in the Middle East and North Africa. It’s strategy of acquiring, building, scaling and selling companies in the MENA region has worked successfully for over 30 years. https://kipco.com ————— Historical Information ————— Prem’s comments about GIG from Fairfax’s 2022AR. “Gulf Insurance Group had another excellent year led by CEO Khaled Saoud Al-Hasan and GIG Gulf CEO Paul Adamson. 2022, the first full year with GIG Gulf results, produced gross premiums of over $2.5 billion and a combined ratio of approximately 92%. We have a wonderful partnership with Kipco, led by CEO Sheikha Dana, in the ownership of Gulf Insurance.” “Bijan (Khosrowshahi), along with Jean Cloutier, have been deeply involved with Gulf Insurance Group in the Middle East as well. After the acquisition of AXA Gulf (now GIG Gulf) in 2021, Gulf Insurance is one of the most prominent players in the region. Led by Khaled Al-Hasan, with Paul Adamson running GIG Gulf as a standalone unit, Gulf Insurance will be an increasingly important contributor to Fairfax.” ---------- From Fairfax's Q3 interim earnings report Subsequent to September 30, 2023 Acquisition of additional interest in Gulf Insurance "On April 19, 2023 the company entered into an agreement to acquire all shares of Gulf Insurance under the control of KIPCO and certain of its affiliates, representing 46.3% of the equity of Gulf Insurance. In accordance with applicable Kuwaiti regulatory requirements and the rules of the Boursa Kuwait, the exchange on which Gulf Insurance’s shares are traded, the company will pay the purchase price to KIPCO in full in Kuwaiti Dinar on closing. Pursuant to the terms of the agreement, immediately following settlement of the transaction, KIPCO shall return to the company in cash the full purchase price less an amount of Kuwaiti Dinar equal to $200.0, together with a cash payment equal to all dividends received by KIPCO from Gulf Insurance after January 1, 2023, and the company will deliver to KIPCO a payment deed of $660.0 which requires the company to make four equal annual payments of $165.0 to KIPCO beginning on the first anniversary of closing of the transaction. "The company's acquisition of all of KIPCO's shares in Gulf Insurance will be for aggregate fair valuation consideration of approximately $740 (approximately 227 million Kuwaiti Dinar), to be paid as approximately $177 in cash ($200.0 less dividends of approximately $23 received by KIPCO during the second quarter of 2023) and the fair value of approximately $563 in a payment deed. Closing of the transaction is subject to customary closing conditions, including regulatory approvals, and is expected to be in the fourth quarter of 2023. On closing of the transaction, the company's equity interest in Gulf Insurance will increase from 43.7% to a controlling interest of 90.0%. Accordingly, the company anticipates that upon closing it will consolidate the assets and liabilities of Gulf Insurance and will record a pre-tax gain of approximately $290, with changes in the company's carrying value of its equity accounted investment in Gulf Insurance up until the date of closing affecting the pre-tax gain."
-
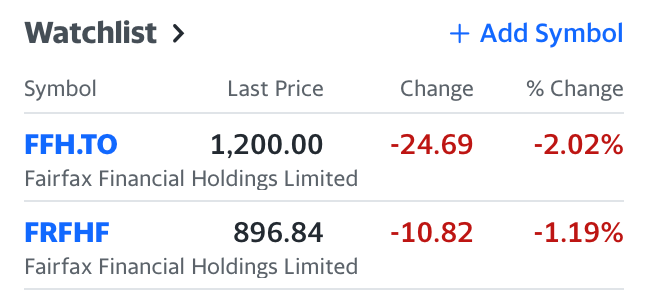
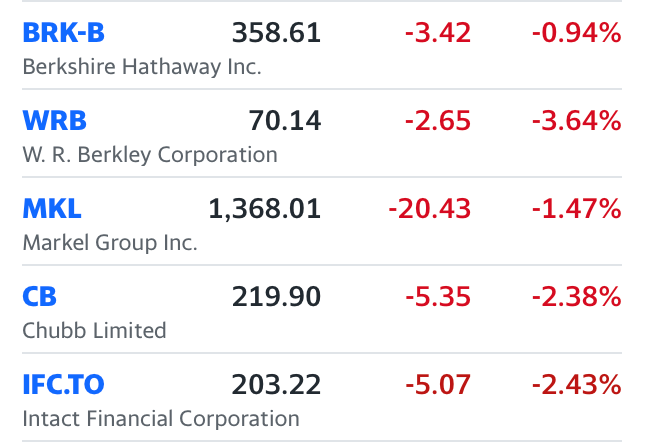
The whole sector is selling off pretty hard. P&C insurance sector has been a pretty strong performer lately. The sell off is probably interest rate related and also a shift from defensive sectors (P&C insurance) to risk-on sectors. Fairfax was very weak earlier today and it has since bounced back a little.
-
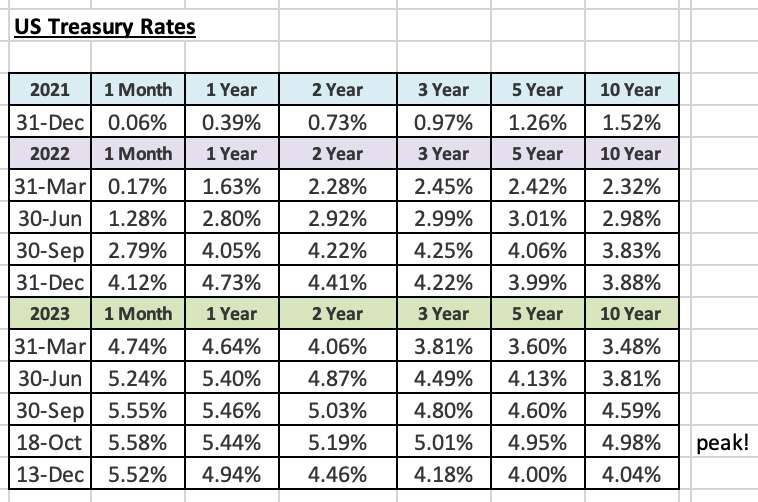
Investing 101: rule #1 - don’t fight the Fed. I think the key to using macro as an input to your investing strategy is to not get too cute. Focus on the big things. Back in late 2021 and early 2022, when inflation was spiking and the Fed started to telegraph rate hikes, the obvious macro trade was to sell long dated fixed income and stocks (risk assets). Shift to cash. And look at all the wonderful buying opportunities that materialized over 2022. No one knew what opportunities were going to show up and when. All you had to do was get to cash and be patient. Today? The Fed just told the world that they are done hiking. And the next move in Fed funds will be down. When? No idea. But you don’t need to know when. You just need to get invested. Look at the move in rates across the curve over the past 7 weeks. It has been stunning. The Fed today just poured gasoline on that fire. The easing cycle has started and in a big, big way. Oil and gas prices are super low. That is stimulative, if it lasts. The big risk for investors today is to be underweight stocks, especially the stocks that have lagged badly this year (pretty much everything other than the magnificent 7). I am not saying they will go straight up from here. But they might. Bottom line, the odds are stacked big time in your favour if your holding period is 3 or 4 years - you pretty much know most stocks will be much higher in 3 or 4 years time. You just don’t know when the big move is going to happen. And if you miss the big moves, well good luck earning a good return on your portfolio. What if we get a recession in 2024? We got our answer today. The Fed will ease aggressively. And governments are still spending like drunken sailors (fiscal easing). So expect some volatility - it will not be a straight ride up. But the Fed will likely be easing regardless. The Fed will cut rates because inflation is coming down aggressively. Guess what Fed rate cuts will do in an ok economy? What about inflation? I think there is a good chance it comes back. Not super high. I think governments would love 3% inflation/year for the next 5 years… that’s how you solve a too-much-debt problem. Bottom line, the Fed, once again, has your back.
-
This is shaping up to be a pretty interesting quarter for Fairfax on the earnings front. The shift to 3.1 years average duration in October is looking better and better. The massive move in bond yields the past 7 weeks should result in significant unrealized gains in the fixed income portfolio. Offsetting this will likely be a big drop in the IFRS-17 bucket (if I am understanding this properly). Does anyone have an opinion on size/magnitude of either move? The next thing to watch might be Fairfax's stock portfolio - if we get a stock market rally into year end. Hopefully the GIG acquisition closes before year end. But not a big deal if it is pushed into 2024.
-
It appears we have seen the peak in interest rates for this cycle. Wow! The Fed meeting today was shockingly dovish. Materially lower interest rates will be stimulative for the economy. How do stocks, especially small caps which are cheap, not rip higher? Look at all the high dividend stocks - 6 to 7% yields? Nuts. Soft landing is looking more and more likely…
-
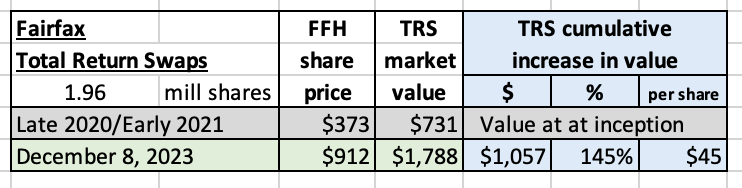
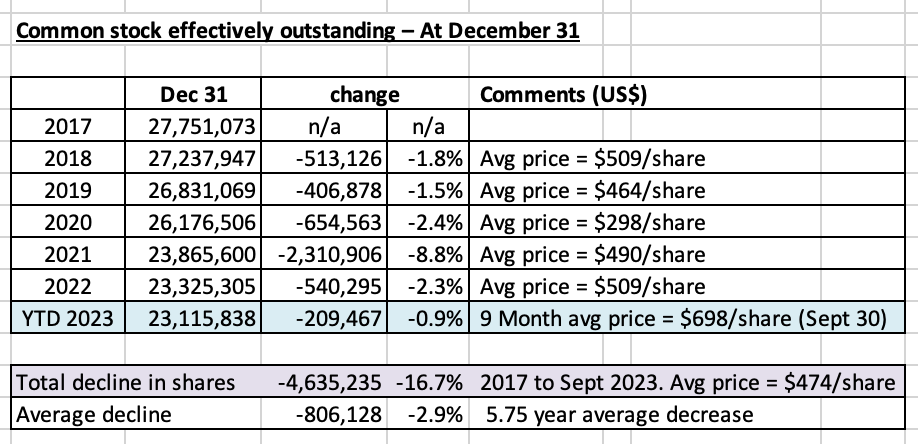
Here is an update on what Fairfax has done with share buybacks over the past 5.75 years. The big picture Three factors drive stock returns over the long term: earnings multiple shares outstanding The last factor is often ignored by investors. Capital allocation Capital allocation is the most important function of a management team and stock buybacks are one of many options that are available. Share buybacks can be very beneficial for shareholders if they are done in a responsible manner (purchased at attractive prices) and sustained over many years. It is counterintuitive, but for long term shareholders a low share price can be a big benefit - if the company is buying back shares and in a significant quantity. Especially if it persists for years. How does Fairfax approach buybacks? Prem laid out Fairfax’s strategy regarding share buybacks in the 2018 annual report: “I mentioned to you last year that we are focused on buying back our shares over the next ten years as and when we get the opportunity to do so at attractive prices. Henry Singleton from Teledyne was our hero as he reduced shares outstanding from approximately 88 million to 12 million over about 15 years.” Prem Watsa – Fairfax 2018AR Fairfax approaches stock buybacks from the framework of a value investor: buy back shares when they are cheap and back up the truck when they are really cheap. What has Fairfax been doing in recent years? Fairfax’s year-end ‘effective shares outstanding’ peaked in 2017 at 27.75 million. Fairfax issued a total of 7.2 million shares in 2015, 2016 and 2017 to help fund its aggressive international expansion in insurance. The new shares were issued at an average price of about $462/share. At September 30, 2023, the ‘effective shares outstanding’ at Fairfax had fallen to 23.1 million shares. Over the last 5.75 years (2018-Sept 2023), Fairfax has reduced its share count by approximately 4.6 million shares or 16.7%. The average price paid to buy back shares was about $474/share. The average price paid for the shares repurchased by Fairfax over the past 5.75 years is slightly higher than the price that shares were issued at from 2015-2017. Fairfax’s book value at Sept 30, 2023 was $876.55/share. Fairfax has been able to buy back a significant number of shares at a very attractive average price - well below intrinsic value (more than 50% below current intrinsic value?). The big share re-purchase was in December 2021, when Fairfax executed a Dutch auction and purchased 2 million shares at US$500/share at a total cost of $1 billion. To fund the purchase, Fairfax sold 10% of Odyssey for US$900 million. The management team at Fairfax was both creative and opportunistic in executing this transaction. Fairfax has been buying back shares, and in volume, the past couple of years because, at the time of purchase, they felt the shares represented outstanding value. Pretty simple. Rational. Very shareholder friendly. What have we seen so far in 2023? Fairfax lowered ‘effective shares outstanding’ by 209,000 shares in the first nine months of 2023. The pace so far in 2023 is below that of the past few years. My current forecast is that Fairfax will reduce effective shares outstanding by about 300,000 shares in 2023. With Fairfax’s share price currently trading at around $900 it will be interesting to see what Fairfax does with share buybacks moving forward. ————— Fairfax’s total return swaps (TRS) on 1.96 million Fairfax shares Some investors consider this investment to represent a buyback of sorts. Here is an update on this holding. It is turning into one of Fairfax’s best investments ever. The TRS-FFH has increased in value by about $1.06 billion, or more than 145% over 36months (not including the costs to maintain the position). ————— What does Warren Buffett have to say about share buybacks? “A very minor gain in per-share intrinsic value took place in 2022 through Berkshire share repurchases as well as similar moves at Apple and American Express, both significant investees of ours. At Berkshire, we directly increased your interest in our unique collection of businesses by repurchasing 1.2% of the company’s outstanding shares. At Apple and Amex, repurchases increased Berkshire’s ownership a bit without any cost to us. “The math isn’t complicated: When the share count goes down, your interest in our many businesses goes up. Every small bit helps if repurchases are made at value-accretive prices. Just as surely, when a company overpays for repurchases, the continuing shareholders lose. At such times, gains flow only to the selling shareholders and to the friendly, but expensive, investment banker who recommended the foolish purchases. “Gains from value-accretive repurchases, it should be emphasized, benefit all owners – in every respect. Imagine, if you will, three fully-informed shareholders of a local auto dealership, one of whom manages the business. Imagine, further, that one of the passive owners wishes to sell his interest back to the company at a price attractive to the two continuing shareholders. When completed, has this transaction harmed anyone? Is the manager somehow favored over the continuing passive owners? Has the public been hurt? “When you are told that all repurchases are harmful to shareholders or to the country, or particularly beneficial to CEOs, you are listening to either an economic illiterate or a silver-tongued demagogue (characters that are not mutually exclusive).” Warren Buffett - Berkshire Hathaway 2022AR
-
What Is the Best Investment That You've Ever Made?
Viking replied to Blake Hampton's topic in General Discussion
What Is the Best Investment That You've Ever Made? My choice of life partner. For two key reasons: 1.) she is old school Italian when it comes to spending (very thrifty). It has been very easy for us to live below our means. This allowed us to save significant sums early (we saved one income after we both had graduating from university). 2.) she has always been very supportive of me managing our finances - she has never questioned my choices when it comes to investing. I have been able to compound returns at close to 20% for 20+ years. Having an extremely supportive partner through this journey/process has been pure gold. It has had lots of set backs - but i was always able to keep moving forward because i always have received the right support at home. Investing has always been a blue job. Not a pink. Or purple. —————- What Is the Best Investment That You've Ever Made? For me timing matters a lot when answering this question. That is because i am older. A 100% return when i was young (with a small net worth) is very different than a 100% return today (with a much larger net worth). (We also sold our house in mid-2021 and rolled much of the significant proceeds into the stock i mention below.) My best ever investment was loading up on Fairfax in Oct/Nov 2020. - thesis: i think everyone on this board knows the thesis. Sanjeev pounding the table in Oct 2020 got it back onto my radar. - holding period: it continues to be my largest holding today. - position size: i was close to 100% at times (not today). - return: Fairfax is up more than 200% from its lows in October 2020.