Viking
-
Posts
6,052 -
Joined
-
Last visited
-
Days Won
78
Content Type
Profiles
Forums
Events
Everything posted by Viking
-
I think it is hard to pin down an exact number. Underwriting will likely be a headwind (given the LA fires) but hard to know how much. And yes, there will be tailwinds: Investment gains - mark to market stocks Investment gains - fixed income (offset somewhat by IFRS 17) Currency (strong euro) - which will be a small tailwind to book value The big gains from Eurobank will boost excess of FV over CV but this will not impact EPS or BV. Bottom line, my guess is we see a solid quarter (but I am not expecting a blowout quarter).
-
@Haryana , sorry, I am not following you. Here is my understanding: If bond yields fall (they are down quite a bit since December 31, 2024), Fairfax will book a big investment gain. They also will take a hit with IFRS. But the gain will be bigger than the hit. The opposite will happen if interest rates move in the opposite direction. But you mention ‘vulnerable’. What do you mean by this? If we get volatility, there will be many different puts and takes. When I look at risks I also try and come up with what the corresponding opportunity will be. And vice versa.
-
Well it looks like the American science experiment is moving from the theory stage to the practical stage. The theory stage was the fun part - because, well, there are no real consequences at this stage. You get to say whatever you want - and you don’t need to be right (or even in the right zip code). But once you move to the practical stage - well, this is when we start to see consequences. And if it turns out you are wrong - well, things will not be pretty. How will we know how things are going? The problem today, is it is almost impossible to find an impartial observer. Except we are talking about the economy and financial markets. And the last time I checked, the stock market is as impartial as it gets - it is not Republican or Democrat. So what does the stock market think about the theory part of America’s science experiment? It is giving it a solid ‘C-‘ grade. Stock averages are down about 8% from their all-time highs. Business and consumer confidence is tanking. And the economy looks like it is slowing. And starting tomorrow, we are moving to the practical stage. So things are likely about to get real. It will be very interesting to see what financial markets do in the coming weeks/months. —————- What was one of the reasons the ‘theory’ part got such a low grade? Well, our student did not put anything in writing. What they discussed (in the verbal part) was not coherent. And their communication skills were terrible. So why didn’t they get a lower grade? Because that would be mean. And cruel on the part of the grader. (And this student has notoriously thin skin).
-
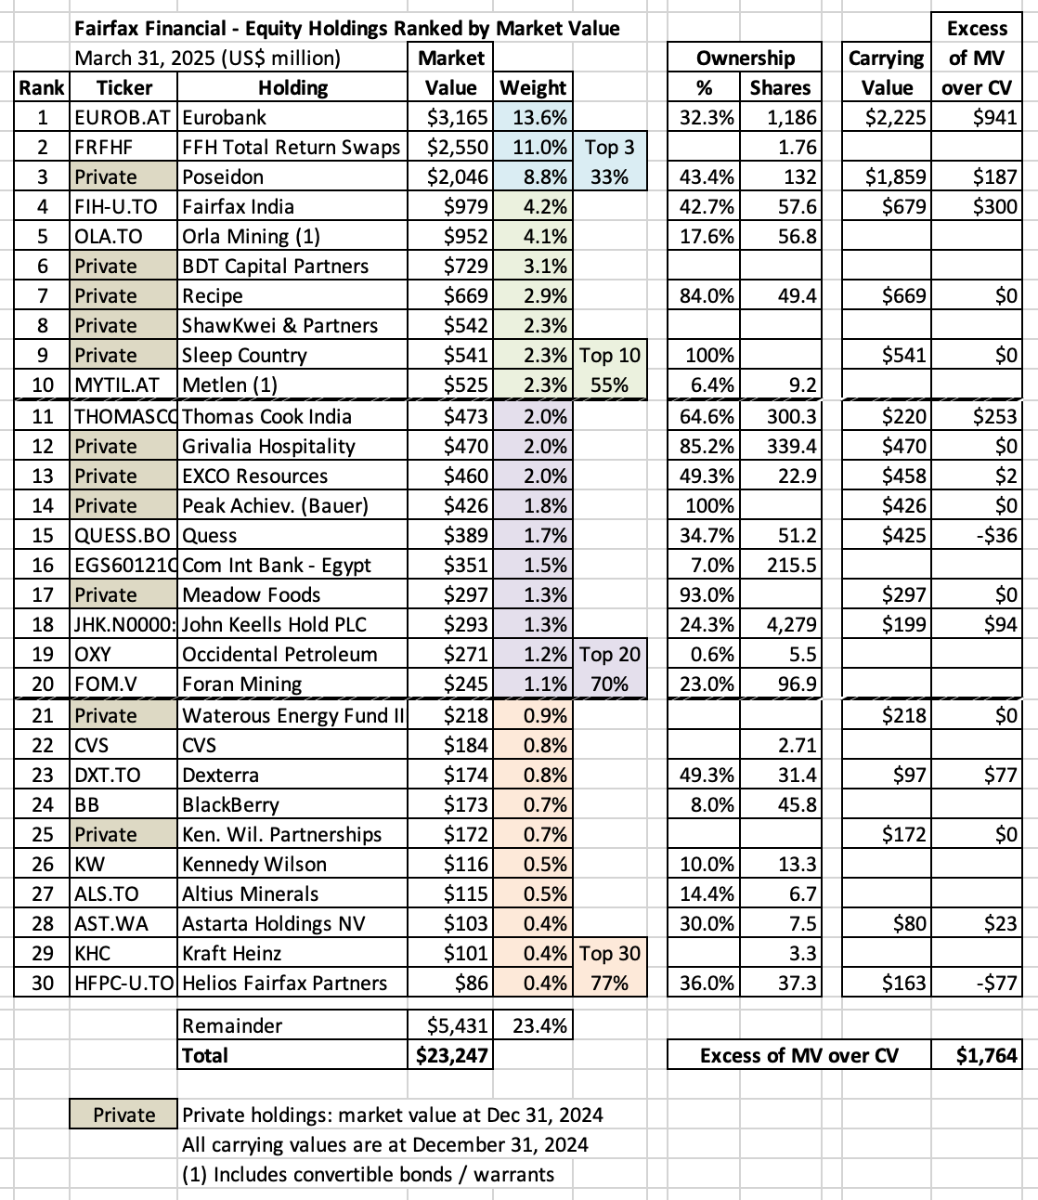
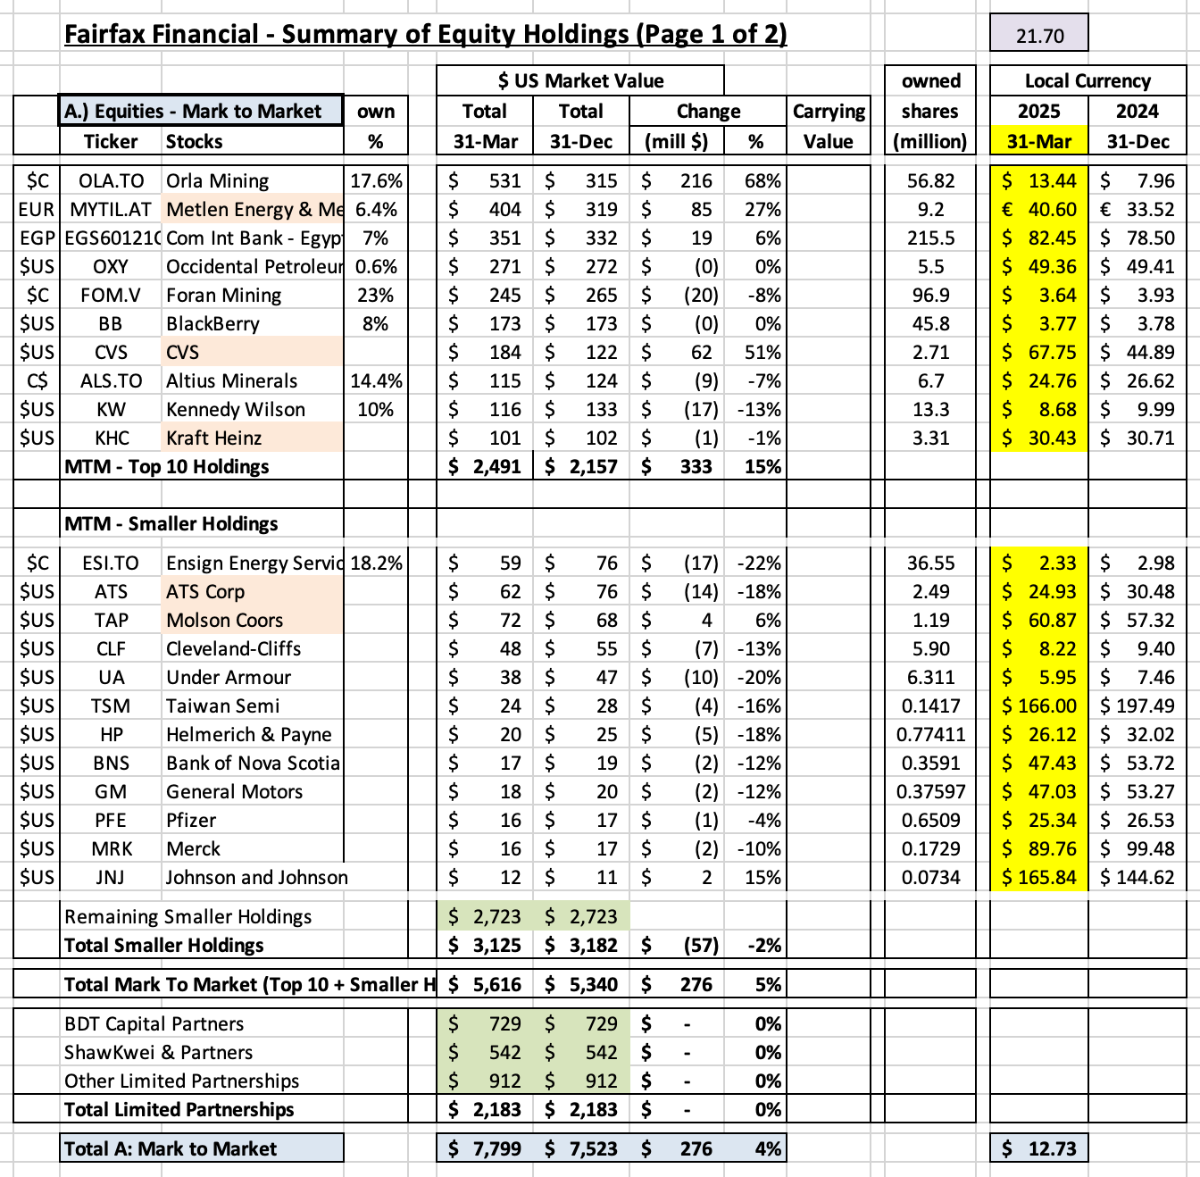
Equity Holdings – Size Ranking at March 31, 2025 In this post we provide a list of Fairfax’s 30 largest equity holdings. To value a holding, we normally use current market value, which is the stock price at March 31, 2025, multiplied by the number of shares that Fairfax owns. For private holdings we use Fairfax’s latest reported market/carrying value (December 31, 2024). The FFH-TRS position is included at its notional value. For Orla and Metlen, the share count includes convertible bonds/warrants What holdings are missing from my list below? Private holding, AGT Foods and Ingredients, is one that come to mind (MV = $150 million?). Ok, let’s get to the fun part of this post. What can we learn from looking at a list of Fairfax’s largest equity holdings? 1.) Fairfax has a pretty concentrated portfolio The top 3 holdings make up 33% of the total. The top 10 holdings make up 55% of the total. 2.) Mr. Market probably dislikes (hates?) a lot of the stocks that are on this list A Greek bank? What is a P/C insurance company doing buying a total return swap on its own shares? A containership company? Significant investments in an emerging market like India? Greece? Significant investments in resource / commodity producers? I could go on. But here is the key point. Ask Mr. Market (the detractors) if they actually follow any of Fairfax’s 10 largest holdings. My guess is they don’t. I love it when people have strong opinions about something they know nothing about. That Greek bank has increased in market value by $2 billion over the past 4 years (2020 to 2024). It is up another $428 million in Q1, 2025. That TRS has increased in market value by $2 billion over the past 4 years (2020 to 2024). It is up another $102 million in Q1, 2025. That shipping container company just completed a massive new-built expansion program - cost to build today has shot up 30% (from what they recently paid). Through Fairfax India, they now own 69% of Bangalore International Airport (BIAL) the 3rd largest and fastest growing airport in India. The largest commodity holding, Orla (a gold producer), is up $343 million in Q1, 2025. Another of their commodity holdings, Stelco, was sold in Q4, 2024. Over its 6-year holding period, this investment delivered a total return of $568 million (CAGR of 25.5%). Bottom line, Fairfax’s equity holdings have been performing exceptionally well in recent years. 3.) Fairfax is not Berkshire Hathaway Over the past 59 years, Warren Buffett / Berkshire Hathaway has been the GOAT. As a result, P/C insurance companies (that invest in equities) today are evaluated by how much they clone Warren Buffett. Of course, there will only ever be one Warren Buffett - and he can’t be cloned (no matter how hard Tom Gaynor at Markel might try). Here is the really interesting point. Warren Buffett/Berkshire Hathaway is not the only person/company to build great wealth by exploiting the P/C insurance business model. I know this might sound like heresy to all of those investors who worship at the altar of Warren Buffett. Here are a few other individuals/companies that have built great wealth for themselves and their shareholders over decades (my list is not comprehensive… there are more): Shelby Davis Peter B Lewis / Progressive Hank Greenberg / AIG Tisch family / Lowes Bill Berkley / WR Berkley Markel family / Markel Prem Watsa / Fairfax Financial The important point is they all did it in very different ways - there is no one/right way. Companies should be evaluated on their own merits (management, fundamentals, results and prospects). Not by how well they are cloning Buffett. So, if you look at Fairfax’s top equity holdings and you hear yourself saying ‘Warren Buffett wouldn’t do that’… well, good luck with that type of ‘analysis’. 4.) Shift to private/associate holdings A big change has been happening with the composition of Fairfax’s equity holdings over the past 7 or 8 years. There has been a shift from publicly traded stocks to private holdings. Today most of Fairfax’s largest equity holdings fall into the ‘private’ bucket. And most of those that don’t fall into the ‘associates’ bucket (which means Fairfax exerts significant influence). This shift at Fairfax reflects what has also been happening in financial markets in general in recent years - more and more capital is shifting from public to private markets, especially with large institutional investors. This is trend looks like it is just getting started. In recent years, many of Fairfax’s large equity investments have been private: 2022: Purchase/take private of Recipe and significantly increase stake in Grivalia Hospitality. 2023: Purchase of Meadow Foods. 2024: Purchase/take private of Sleep Country (100%) and significantly increase stakes in Meadow Foods (93%) and Peak Achievements (100%). The shift to private/associate holdings will have important implications for investors in how it impacts reported results (the income statement and balance sheet). Another meaningful income stream is being created: ‘non-insurance consolidated holdings’ income stream will be spiking higher in the coming years (yes, off a very small base). Less volatility in another income stream: As true ‘mark to market’ equity holdings shrink in size (as a percent of the total equity portfolio), we should see less volatility in the ‘unrealized investment gains (losses)’ income stream. In the coming years, the reported results of ‘new Fairfax’ will be much less volatile than what was experienced with ‘old Fairfax’. Will the shift to private/associate holdings create a Berkshire Hathaway type of problem for Fairfax… will book value become a poor tool to use to value Fairfax? Over the past 4 years, for Fairfax’s associates and consolidated equity holdings, the increase in economic value has been much greater than the increase in reported accounting value. One way to measure this through the ‘excess of fair value over carrying value.’ At December 31, 2024, the excess of FV over CV was $1.48 billion ($68/share pre-tax). This is value that has been created that is not captured in reported EPS and BV. This will be something for investors to monitor and factor into their assessment of the performance/valuation of the company in the coming years. 5.) Fairfax has largely fixed its ‘problem’ equity holdings from pre-2018 Back in 2018, Fairfax’s equity portfolio was littered with underperforming equity holdings. But around that time, it’s like the senior team at Fairfax decided enough was enough. It looks to me like they ‘tweaked’ their investment framework and put more of a premium on: Partnering with strong management teams. Profitability. Financial strength. This new framework helped with new equity purchases. But what to do with poorly performing ‘legacy’ holdings? Fairfax rolled up their sleeves and got to work: AGT Food and Ingredients was taken private (its business is far too volatile to be a publicly traded company). APR Energy was sold to Atlas (for shares). Fairfax Africa was placed into runoff / merged with Helios. Resolute Forest Products was sold (at the peak of the lumber market for a very good price). Farmers Edge went bankrupt. Blackberry debentures were exited (freeing up $500 million in capital). It took 7 years, but Fairfax has largely ‘fixed’ most of its poorly performing legacy equity holdings. These holdings were a significant and recurring drain of financial and management resources - they were a steady ‘use of cash’ of about $200 million per year (on average) for many years (cash infusions, write downs etc). It is like a $200 million annual expense has been eliminated. Fixing legacy holdings carries 3 benefits for Fairfax: It removes a large annual expense. It has shifted a significant amount of capital to better performing companies/opportunities that are now delivering solid results/earnings - which are beginning to compound in value. Assets that were a significant use of cash (of $200 million/year?) have now become a significant source of cash (more than $200 million/year?). The swing (the benefit to Fairfax financials) is actually the sum of the two (+$400 million in our example). It makes Fairfax's lean senior management team much more productive - it shifts their use of time from problems to opportunities. Every equity portfolio will always have a few poor performers. Fairfax’s problem back in 2018 was they had too many poorly performing holdings and they were large in size (many were top 10 holdings). Summary For the past 7 years, the overall quality of Fairfax’s collection of equity holdings has been slowly and steadily improving. The impact on earnings lagged initially. But after years of effort, the improvements made are now showing up in reported results and earnings. As a result, today, the quality of Fairfax’s collection of equity holdings has never been/looked better, in terms of: Management (Fairfax / Hamblin Watsa / Fairbridge) Fundamentals Profitability/earnings power Prospects That is a wonderful set-up for Fairfax shareholders. Now we get to watch compounding work its magic. The sequence of returns matters The size of Fairfax’s equity portfolio - at $23 billion - has never been bigger. Fairfax is delivering exceptional performance at the perfect time.

-
I agree. What is interesting is what they did during the last 2 bear markets in equities (2020 and 2022): Used it as a catalyst to fix some underperforming equities. Like Thomas Cook India (forced to restructure as part of the cash injection they gave the company). Bought much more of the companies they already owned - at very attractive prices. Fairfax just didn't 'ride it out.' They supplied some 'tough love.' And bought on the cheap. This improved both the quality of the company and its fundamentals. (Capital allocation 101.) Welcome to 'new Fairfax.'
-
It is interesting how uncorrelated Fairfax has been to the overall stock market in recent years. Why? Valuation - it is cheap (both P/BV and PE) Fundamentals continue to improve ($4b in earnings) P/C insurance - uncorrelated (mostly) to economic activity Tariffs - not impacted Buybacks - company is aggressively buying back stock Management - continues exceptional execution (best in class) That is a pretty good set-up.
-
CVS was disclosed as a new position in the Q4, 2024 13F report. https://13f.info/13f/000110465925013269-fairfax-financial-holdings-ltd-can-q4-2024
-
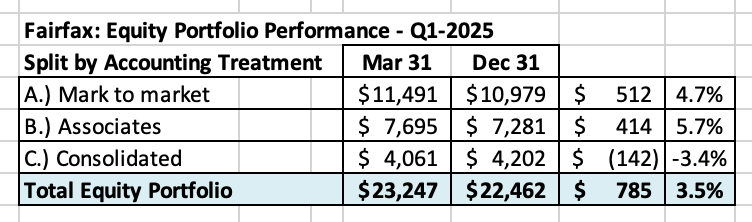
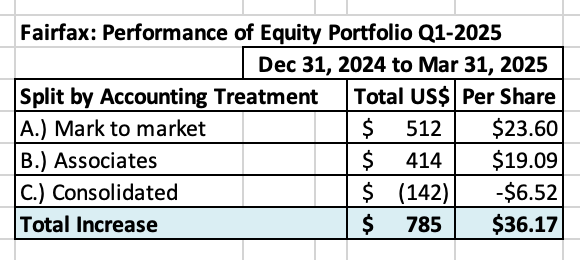
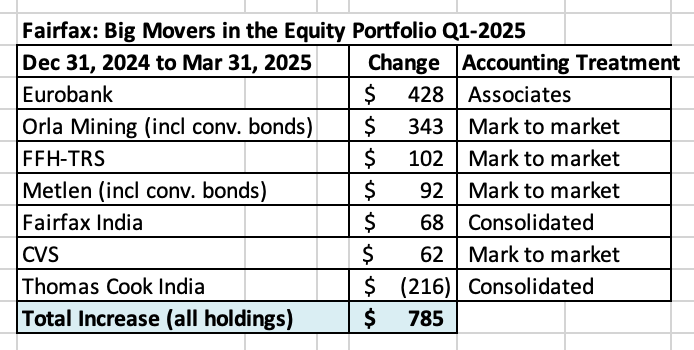
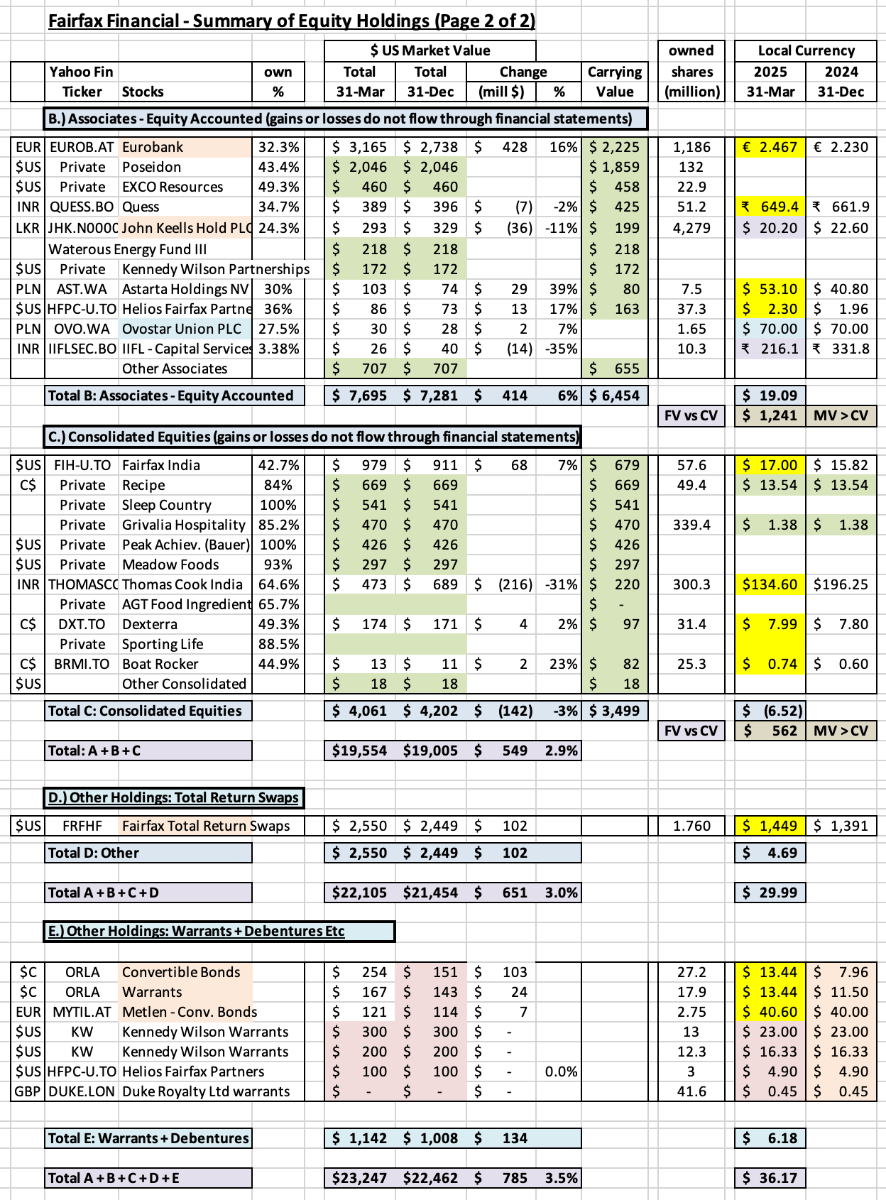
Estimate of change in MV of Fairfax’s equity portfolio in Q1, 2025 A warning. When looking at Fairfax’s equity holdings, what matters to investors is the underlying business performance achieved by the holdings over time. Not the quarterly change in market value. Short term (quarterly) changes in market value are driven by Mr. Market, who as we all know is a manic depressive. As a result, short term (quarterly) changes in market value should be viewed with an appropriate amount of scepticism by investors. So why track quarterly changes? Because it is interesting. And it can provide some insight into one of Fairfax’s large income streams - investment gains (losses) - prior to the release of quarterly earnings. Importantly, over time (like a couple of years), the change in the market value of Fairfax’s equity holdings should roughly match the change in intrinsic business value. ----------- In Q1, 2025, Fairfax’s equity portfolio (the holdings that I track) increased in market value by about $785 million (pre-tax), or 3.5%. This is a solid return given the global correction in stocks in Q1. The equity portfolio had a total value of about $23.2 billion at March 31, 2025. Included in our estimates are details from Fairfax’s Q4-2024-13F and 2024AR. Notes: The FFH-TRS position is included in the mark to market bucket and at its notional value (with a market value of $2.55 billion). Convertible bonds, warrants and debentures are also included in the mark to market bucket. The ‘tracker portfolio’ is not an exact match to Fairfax’s actual holdings. It is useful only as a tool to understand the rough change in value of Fairfax’s equity portfolio (and not the precise change). Split of holdings by accounting treatment About 49% of Fairfax’s equity holdings are mark to market - and will fluctuate each quarter with changes in equity markets. The other 51% are Associates and Consolidated holdings. Split of total gains by accounting treatment The total change is an increase of about $785 million = $36/share (pre-tax) The mark to market change is an increase of about $512 million = $23.60/share. What were the big movers in the equity portfolio in Q1, 2025? The usual suspects continue to perform very well - Eurobank and FFH-TRS. The big surprise was Orla, which increased in value by $343 million (including convertible bonds and warrants), driven by the spike in the price of gold. CVS, added in Q4, 2024, was up significantly. Stocks in India have been in a bear market to start 2025 – Thomas Cook India was down $216 million. Excess of fair value over carrying value For associate and consolidated holdings, the excess of fair value to carrying value is about $1.8 billion pre-tax ($83/share). The 'excess of FV to CV’ has been materially increasing in recent years. This is economic value that has been created by Fairfax that is not captured in book value – it is a good example of how book value is understated at Fairfax. (Note, the carrying value we use in our tracker for associate and consolidated holdings is from December 31, 2024). Excess of FV over CV = $1.8 billion = $83/share (pre-tax) Associates = $1,241million Consolidated = $562 million Equity Tracker Spreadsheet explained: We have separated holdings by accounting treatment: Mark to market Associates – equity accounted Consolidated Other Holdings – total return swaps and warrants/debentures The value of each holding is calculated by multiplying the share price by the number of shares. All holdings are tracked in US$, so non-US holdings have their values adjusted for currency. This spreadsheet contains errors. It also contains some information that is dated (like the carrying value for associate and consolidated holdings). Please keep this in mind. The spreadsheet is updated as new information becomes available.
-
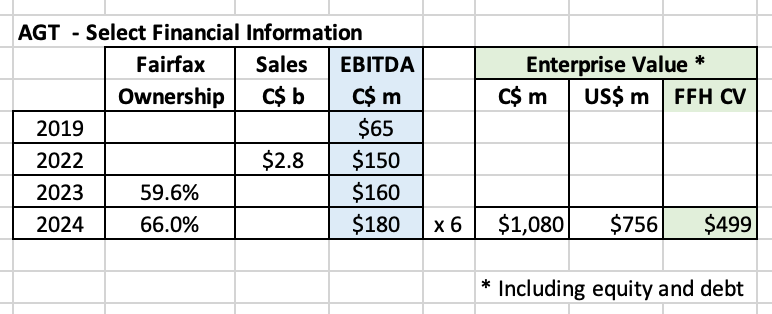
AGT is a sleep holding for Fairfax. For some reason it is not included in the table of equity holdings that Fairfax provides each year in Prem's letter (with a stated carrying value). Instead we get this: "Fairfax’s 66% stake in AGT is currently carried at an enterprise-to-EBITDA ratio of 6x." Prem Watsa - Fairfax 2024AR I have tried to come up with a carrying value for AGT at December 31, 2023. Does my math look roughly right? My $500 million estimate for Fairfax is for 'enterprise value' - this includes both equity and debt. And my guess is AGT has a bunch of debt (legacy + take private + growth of business). But it appears that debt came down significantly in Q1, 2025 with AGT's sale of their rail and infrastructure assets for C$192 million. Bottom line, EBITDA has been growing nicely at AGT over the past 5 years. And now total debt has come down significantly in Q1, 2025. Both are positive developments. Comments from Prem about AGT from Fairfax’s 2024AR. AGT, run by CEO Murad Al-Katib with his Executive Chairman Huseyin Arslan, had another strong year in 2024, with EBITDA of approximately Cdn$180 million (up from Cdn$65 million at the time of the take private transaction in 2019). The company has successfully transformed the business over the past several years. It has a vertically integrated supply chain with a growing higher-margin Packaged Foods business and customer base. In early 2025, AGT completed another important step in their transformation by selling its Canadian rail and infrastructure assets for proceeds of Cdn$192 million. The deal provides AGT with the use of the rail assets under a long-term supply agreement. The sale proceeds will be used primarily for debt reduction and optimization of the company’s capital structure. These developments have led to stronger free cash flow and value creation. AGT’s global pulse sourcing and processing capability is also expected to become increasingly valuable as the total addressable market for plant-based protein expands. Fairfax’s 66% stake in AGT is currently carried at an enterprise-to-EBITDA ratio of 6x. Prem Watsa – Fairfax 2024AR
-
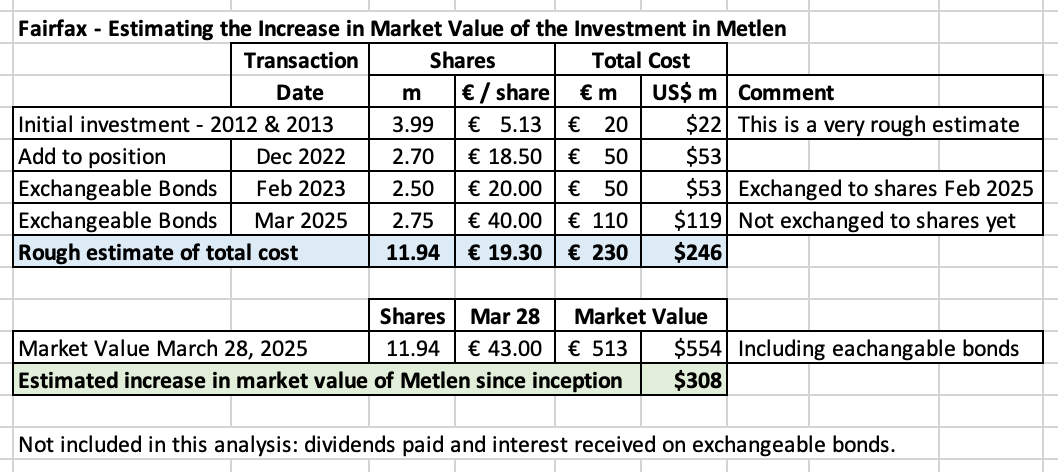
Here is an updated summary for Fairfax’s investment in Metlen: With a market value of about $550 million, this is close to a top-10 holding for Fairfax. The return on this investment over the past 2.5 years has been exceptional (more than a double).
-
@nwoodman , thank you... my initial numbers were off (I edited my initial post). Will the gains on the convertible bonds and warrants be mark to market each quarter? Assuming they are in the money, like they are now? (I think so...) Pretty crazy that Orla is Fairfax's 5th largest equity holding with a market value today of +US$900 million. (After Eurobank, FFH-TRS, Poseidon and Fairfax India). The torque that resource/commodity holdings get when the price of the underlying commodity spikes is pretty nuts (the price of gold in this case).
-
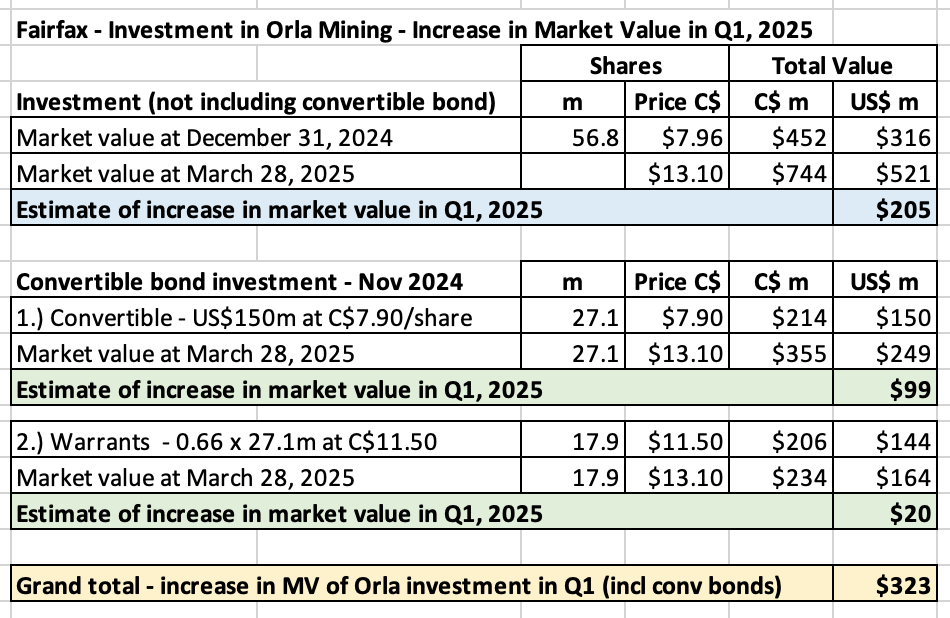
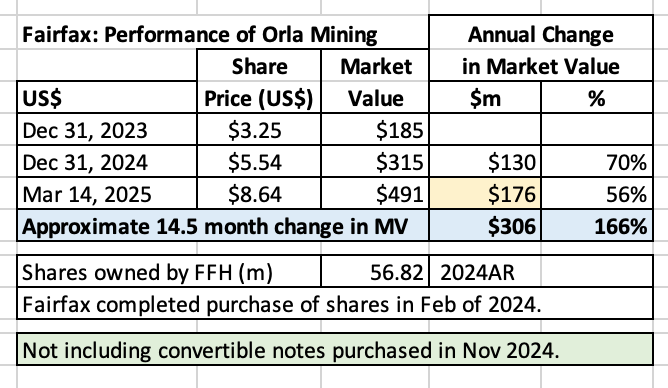
Ok... A question for board members... how many shares of Orla does Fairfax own (or have exposure to) today? We got confirmation that as of Dec 31, 2024, Fairfax owned 56.8 million shares. This is the same number ofshares that Fairfax owned at Sept 30, 2024 (as per Fairfax’s 13F). In November 2024, Fairfax committed to purchase some of the US$200 million in convertible bonds that were part of the Mussellwhite transaction. At the time, we didn’t know how much of the convertible bonds Fairfax committed to. It looks to me like we got confirmation in Prem's letter that Fairfax purchased US$150 million (of the US$200 million). This acquisition was announced in November but just closed in March. It looks to me like Fairfax now has exposure to another 27.1 million Orla shares with a cost basis of C$7.90/share (the conversion price). And another 17.9 million warrants exercisable at C$11.50. With shares closing on Friday at C$13.10/share, it looks to me like the MV of Fairfax's total investment in Orla is up about $323 million:. Legacy position = $205 million Convertible bond = $99 million Convertible bond warrants = $20 million Am I interpreting things correctly? ---------- ---------- Comments from Prem about Orla Mining from Fairfax’s 2024AR. Orla Mining, run by Jason Simpson and his exceptional team, had a transformative 2024. In November, Orla announced the acquisition of the Musselwhite gold mine in Ontario from Newmont. Fairfax participated via a $150 million investment in convertible bonds (4.5% coupon, Cdn$7.90 conversion price and 0.66 of a warrant with a Cdn$11.50 per share exercise price). Musselwhite is a low-cost, long-life asset in one of the best mining jurisdictions in the world. The addition of Musselwhite will more than double Orla’s annual gold production to approximately 300,000 ounces a year. Orla’s Camino Rojo open pit mine in Mexico continues to perform extremely well, producing approximately 137,000 ounces of gold in 2024. Exploration activity at Camino is indicating the viability of an underground mine at the site with attractive economics. Lastly, progress continues to be made in permitting their South Railroad mine in Nevada.South Railroad is likely to be a low-cost mine with high free-cash flow. Orla generates attractive levels of free cash flow and has ample liquidity to fund its development and exploration activity. Orla is carried at its listed price of $5.47 per share (Cdn$7.87) or $311 million. Prem Watsa – Fairfax 2024AR
-
@adventurer , I am happy to hear that you are getting value from my long-form posts. Writing/editing them improves my understanding of the company. And the contributions (ideas/perspectives, links, questions, comments etc) from everyone on this wonderful forum provides me with lots of new material. It has become a virtuous circle
-
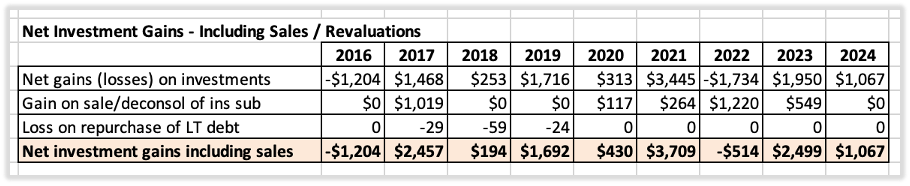
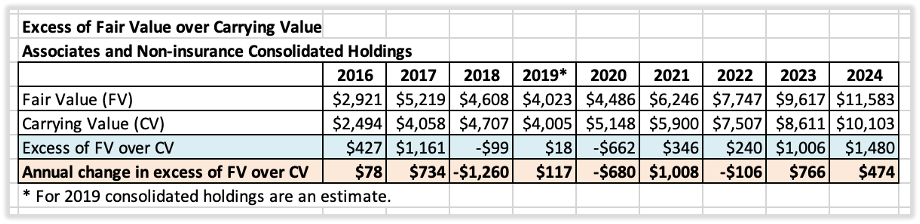
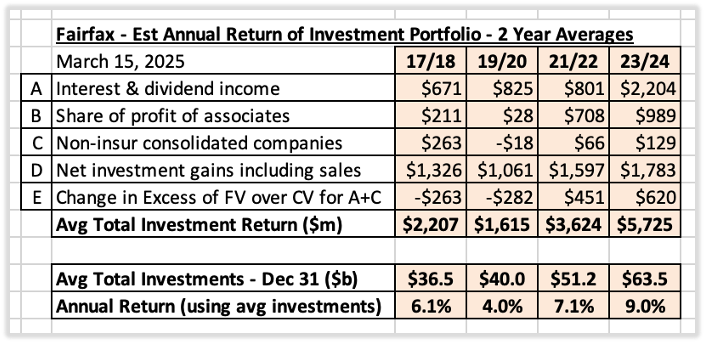
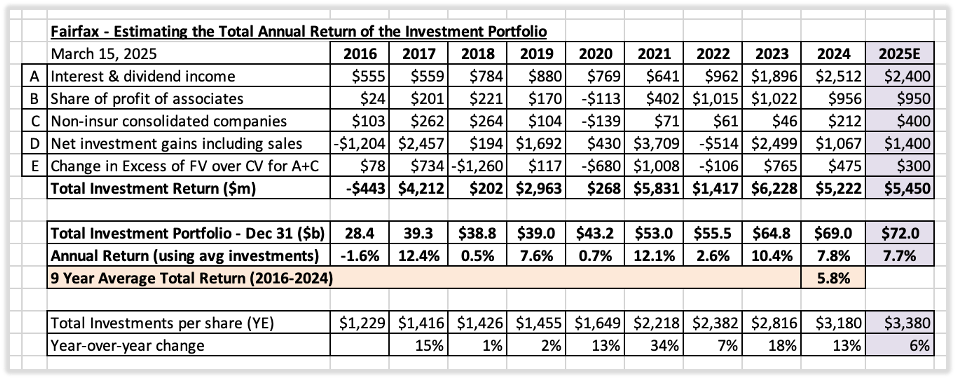
Fairfax's Investment Portfolio: A Review of Returns From 2016-2024 and Estimate for 2025 Two things drive earnings at Fairfax: The underwriting profit it earns on its insurance operations. The return it earns on its investment portfolio. In this post we will review the return that Fairfax earns on its investment portfolio – in total dollars and as a percent. We will start by looking at the past (2016-2024). We will then use what we learn as inputs to help us build a forecast for 2025. What is the value and composition of Fairfax’s investment portfolio? At December 31, 2024, Fairfax had an investment portfolio with a value of about $69 billion: Fixed income = $47 billion Equities = $22 billion Methodology The total investment return for Fairfax can be calculated using the following inputs: Income streams: A. Interest and dividend income Interest income earned from the fixed income portfolio. Dividend income earned from the mark to market equity holdings. B. Share of profit of associates Fairfax’s share of pre-tax earnings from its associate holdings: Eurobank, Poseidon, EXCO Resources and Fairfax India (their associate holdings). C. Non-insurance consolidated companies Pre-tax earnings from Recipe, Sleep Country, Peak Achievement, Grivalia Hospitality, Thomas Cook India, Meadow Foods, AGT Food Ingredients, Dexterra, Sporting Life and Boat Rocker. D. Net gains (losses) on investments Unrealized gains from the investment portfolio (stocks fixed income). Large realized gains from asset sales and revaluations (including insurance). We also include one more item: E. The change in ‘excess of fair value over carrying value’ for non-insurance associate and consolidated holdings This is not captured in Fairfax’s reported results (earnings or book value). We include it because this is real economic value that is being created by Fairfax each year. And therefore, it should be included when calculating the total return that Fairfax’s investment portfolio is actually delivering each year. Historical returns: 2016-2024 For the 9-year period from 2016 to 2024, Fairfax earned an average total return on its investment portfolio of about 5.9% per year. That is a much higher return than I would have expected, given the significant headwinds Fairfax experienced from 2016 to 2024: Abnormally low interest income: Interest rates were extremely low from 2016 to 2022. Large ‘one time’ losses: Disastrous equity hedge (removed late 2016)/short positions (last position was removed late 2020). Poor performance from equity holdings: In 2016/2017, Fairfax’s equity portfolio was littered with low quality/poorly performing holdings (significant users of Fairfax’s cash). Note: D.) Net investment gains including sales We have grouped three items into this bucket. All realized and unrealized gains, from both investments and insurance. And the losses from pushing out the maturities on long term debt. Note: E.) Change in excess of fair value over carrying value for associate and consolidated holdings Equity holdings classified as ‘associates’ and ‘consolidated’ are valued on Fairfax’s balance sheet at their carrying value and not their fair value (market value). In recent years, the fair value of this group of holdings has increased at a much faster pace than it’s carrying value. This is not surprising – for the past 6 years Fairfax has been slowly and methodically improving the quality of its equity holdings. Past years efforts are now showing up in improved results (and valuations). At December 31, 2024, the excess of fair value over carrying value for this group of investments was $1.48 billion or $64.52/share (pre-tax). Over the past 3 years, the value creation has averaged about $380 million per year. This is economic value that is being created each year. At some point, Fairfax will harvest/monetize this value and it will show up in reported results (EPS and book value) via the net investment gains income stream. Historical returns: 2017-2024 – Calculated in 2-Year Averages If we look at Fairfax’s returns from this time period using 2-year averages we can smooth out much of the annual volatility and get a much clearer picture as to what has been going on under the hood. 2017 – 2018 Average annual return on the investment portfolio was 6.1%. In 2017, First Capital and ICICI Lombard were sold; investment gains were $1.5 billion. In 2018, there was a bear market in stocks. 2019-2020 Average annual return declined to 4.0%. In 2020, there was a bear market in stocks which hit Fairfax’s holdings especially hard (low quality and skewed to cyclicals). 2021-2022 Average annual return improved to 7.1%. This was an amazing return when we factor in what happened in 2022. Historic bear market in bonds. Viscous bear market in stocks. 2023-2024 Average annual return improved to 9.0%. The higher return is being driven by: Spike in interest and dividend income and share of profit of associated. Increase in quality of the total equity portfolio. Summary: When viewed through 2-year averages, it is clear that Fairfax’s total return on its investment portfolio has been moving steadily higher over the past 6 years. Looking forward: Estimates for 2025 The significant headwinds that were holding down Fairfax’s returns from 2016-2022 are now gone. And significant new tailwinds have emerged. Fixed income: The average yield was about 5.1% in 2024 and average duration finished the year at about 3.3 years. Equities: The quality/earnings power of the equity portfolio is now shining through. My estimate is for Fairfax to earn a total return of: 2025 = $5.45 billion, or 7.7% on its average investment portfolio of $70.5 billion. Fairfax is experiencing three big benefits at the same time: The total investment portfolio continues to increase in size (2025E = $3,380/share). The average yield being earned on the investment portfolio continues at a very high level. The increase in the total investment return is being driven by high quality income streams – meaning the high average yield being earned is sustainable in the coming years. As a result, the investment portfolio is poised to continue delivering a near-record amount to Fairfax’s earnings in the coming years.
-
Great point on currency. Strong GPB/Euro will likely be a strong tailwind when Q1 earnings are reported.
-
@nwoodman , like I said in my post, I think I constructed my forecast using mildly conservative assumptions. We will see. Regarding investment gains: Yes, my forecast for total investment gains will be low if bond yields continue to come down. However, the IFRS bucket will also move in the other way (just not as much). So the net amount - from a total earnings perspective should be a modest gain. The FFH-TRS has done a lot of the heavy lifting for total investment gains over the past couple of years (especially 2024). We need to see the rest of the equity portfolio step up more moving forward. It will be interesting to see where Q1 comes in for the equity portfolio. Regardless, I think a fair bit of value is building in the equity portfolio that is not being captured in reported results (in addition to excess of FV over CV for associate and consolidated holdings). Yes, heightened volatility in financial markets, while likely causing some short term headwinds to reported results, would provide Fairfax with some great opportunities. So I am kind of indifferent to how things play out from here (resumption of the bull market or a shitstorm). Which is kind of an interesting place to be with Fairfax - in a very good way.
-
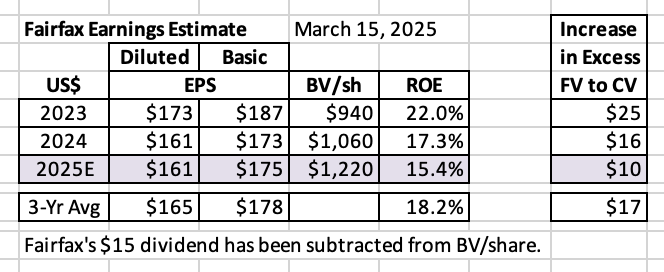
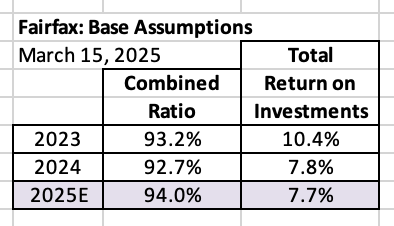
Updated Earnings Estimate for Fairfax for 2025 Below is my earnings estimate for Fairfax for 2025. This forecast includes learnings from Fairfax’s 2024 annual report and ‘new news’ from the past couple of months (since the last update). What did I get wrong? I look forward to hearing from board members. Summary My current estimate is diluted EPS at Fairfax will be about $160/share in 2025. I think this estimate has been constructed using mildly conservative assumptions. This does not include the increase in excess of fair value over carrying value for Fairfax’s associate and consolidated holdings. I expect ‘excess of FV over CV’ to deliver another $10/share (after tax) in value in 2025. So, my forecast for the increase in intrinsic value at Fairfax in 2025 is about $170/diluted share. Based on my forecast for 2025, over the 3-year period from 2023 to 2025, diluted EPS at Fairfax will average about $165/share and the increase in ‘excess of FV over CV’ will average about $17/share (after tax). This would put the average increase in intrinsic value at Fairfax from 2023 to 2025 at a little more than $180/diluted share. This amount is likely a good number to use as a baseline (starting point) when trying to estimate the increase in intrinsic value for Fairfax for 2026 and 2027. Will retained earnings be re-invested in a way that builds value for shareholders? Perhaps the hardest piece to forecast with Fairfax today is what they will be doing with the substantial amount of earnings that they are currently generating (about $4 billion per year). And the impact the re-investment of current earnings will have on future earnings. Both the size - how much. And the speed - how fast. When it comes to re-investing earnings, Fairfax has lots of very good options: Grow insurance - Continuation of the hard market? Bolt-on acquisitions? Buy out minority partners in insurance? Buy fixed income securities? Buy equities? Buy back a meaningful amount of Fairfax’s stock? What Fairfax does will determine which of Fairfax’s 5 income streams will grow the most. Because we don’t know what Fairfax will actually do when we build our 2025 forecast, we have to guess which income streams will benefit and by how much. Please keep this in mind when you review our forecast – it is a guess at a point in time. As results come in each quarter, we will update our forecast to reflect the new news. Looking at the last 5 years, the management team at Fairfax has done an outstanding job with capital allocation. My guess is they will continue to make good decisions (on balance) and this will benefit shareholders in the coming years – likely providing a tailwind to my forecasts for 2025 and beyond. What are the key assumptions we have used to build our forecast? To estimate future EPS, BVPS and ROE for Fairfax, an investor needs to think about three things: Combined ratio – How good is the P/C insurance business? Total return on the investment portfolio – How good is the team at Hamblin Watsa? Capital allocation – How good is the senior management team? Note, when calculating the total return for the investment portfolio, I am including the change each year for ‘excess of FV over CV’ for associate and consolidated holdings. As stated earlier, this is value that is being created by Fairfax and it needs to be incorporated into models. Interest rates: I am assuming interest rates remain roughly at current levels (at March 15, 2025). Of course, this will likely not be the case. Given the duration of the fixed income portfolio (about 3.2 years) is now closer to the duration of the insurance liabilities (a little under 4 years?), changes in interest rates will likely roughly balance out (in ‘net gains/losses on investments’ and ‘effects of discounting and risk adjustment- IFRS 17’). Bottom line, changes in interest rates should result in much less volatility in Fairfax’s reported final results moving forward - although they will impact ‘net gains (losses) on investments’ and ‘effects of discounting and risk adjustment (IFRS 17)’. The investment community should like that. Below is a 6-year snapshot of earnings for Fairfax. It communicates in a concise manner the dramatic transformation that has happened at the company, beginning in 2021. There has been a spike in operating income per share – from an average of $39/share from 2016-2020, to $235/share in 2024. This much higher amount has become the new baseline for the company. For 2025, my estimate has operating income coming in at $227/share, which is a 480% increase from the average from 2016-2020. ‘Normalized earnings’ at Fairfax have moved to a much higher level – and, importantly, this higher level looks durable/sustainable. What are current analyst’s earnings estimates for Fairfax? Analysts estimate that Fairfax will earn: US$156/share in 2025 US$174/share in 2026 These estimates do not include changes in the value of ‘excess of FV over CV’ for associate and consolidated holdings. Here are the most important assumptions that went into each line item in our forecast: 1.) Underwriting profit: Estimate = $1.5 billion in 2025. Net premiums written growth of 3% in 2024. This is being driven by continuation of the hard market. Odyssey and Brit could provide upside surprise, if they return to growth in 2025. Combined ratio (CR) of 94% in 2025. Catastrophe losses: 2025 will finish the year slightly higher than 2024. Reserve releases: continuation of the positive trend observed in 2024. 2.) Interest and dividend income: Estimate = $2.4 billion in 2025. Tailwinds: The size of the fixed income portfolio should increase from $47 to $49 billion. Interest income from $835 million investment in Blizzard Vacatia Equity Partners. Headwinds: Lower short-term interest rates. The average yield of the fixed income portfolio was about 5.1% in 2024 and the average duration finished the year at 3.3 years. For 2025 we estimate the average yield will be 4.9% 3.) Share of profit of associates: Estimate = $950 million in 2025. Earnings at Eurobank and Poseidon/Atlas should continue to chug along. Tailwind: EXCO – should benefit from the rise in the price of natural gas. Headwinds: Shift of Peak Achievement to a consolidated holding ($57m). Sale of Stelco ($18m). 4.) Effects of discounting and risk adjustment (IFRS 17): The two key drivers for this bucket are the trend in net written premiums of the insurance business and changes in interest rates. Net written premiums growth of 3% in 2024 should be a small tailwind. Now that the average duration of the fixed income portfolio (3.2 years) is similar to the average duration of the insurance liabilities (a little under 4 years?), changes in interest rates should roughly balance out. This bucket is difficult to model – therefore, my confidence level in my estimates is low. 5.) Life insurance and runoff: Estimate = a loss of $150 million in 2025. Adverse reserve development at runoff should be offset by earnings from the life insurance business in Greece. This estimate is a ‘plug’ number for me. 6.) Non-insurance consolidated operations (Other revenue – expenses): Estimate = $400 million in 2025. This income stream has a number of significant tailwinds for 2025: Acquisitions: Sleep Country (closed Oct 1, 2024). Peak Achievements and Meadow Foods – shift from associate (Q4, 2024). This bucket is poised to grow nicely in the coming years. 7.) Interest expense: Estimate = $700 million in 2025. Q4 2024 interest expense of $172.9 million x 4 (annualized). 8.) Corporate overhead and other: Estimate = $470 million in 2025. An increase from 2024, which was $450 million (and $430 million in 2023). 9.) Net gains on investments: Estimate = $1.1 billion in 2025 FFH-TRS = $250 million ($150/share x 1.76 million shares) Benefit from YTD decline in bond yields (March 15, 2025) = $300 million Remaining mark to market holdings = $550 million ($8 billion x 7%) 10.) Gain on sale/deconsol of insurance sub: Estimate = $300 million in 2025 This is where I put the large asset sales/revaluations. These items are very lumpy and therefore difficult to forecast precisely for any one year. Sometimes these gains show up as a separate line item and other times they show up in investment gains. I like to break them out at the start of the year as a separate line item. Over the past 5 years, large one-time gains from asset sales/revaluations have averaged about $500 million per year – so using an estimate of $300 million for 2024 seems like a reasonable and conservative estimate. Bottom line, this bucket is a wild card. But Fairfax has a long history of surfacing the significant value that is residing/hidden on its balance sheet. When they do, we see significant realized gains (from both insurance and non-insurance holdings). 11.) Income taxes: Estimate = 23.5% for 2025 Fairfax’s tax rate was averaging around 20%. Due to a couple of different factors it increased to 24.4% in 2024. Fairfax guided to a rate between 22% and 25%, so we are using 23.5% for 2024. 12.) Non-controlling interests: Estimate = 8% for 2025 As Fairfax continues to take out its minority P/C insurance partners this number should shrink. In 2024, Fairfax took out its minority partner in Brit. In 2025 it is likely they will increase their ownership in Allied World and/or Odyssey. As minority P/C insurance partners are taken out, the result is a greater share of total earnings at Fairfax will accrue to shareholders. 13.) Effective Shares Outstanding (year-end): Estimate = 21.3 million for 2025 We focus on effective shares outstanding as this is what Fairfax highlights in its reporting. Fairfax finished 2024 with effective shares outstanding = 21.7 million. This was down 1.3 million in 2024 (from 23.0 million at 2023YE). In 2025, we estimate Fairfax will reduce effective shares outstanding by 400,000 which is a slower pace compared to 2024. Additional notes: ‘Underwriting profit’: Includes insurance and reinsurance; does not include runoff or Eurolife’s life insurance business. ‘Interest and dividends’ and ‘share of profit of associates’: Includes insurance, reinsurance and runoff/life insurance.
-
We have completed an update to our 2025 earnings estimate for Fairfax. To set the table, below is summary of some important points. The updated earnings estimate follows in the next post. Fairfax 2025 Earnings Estimate – An Introduction “What possible assurance do you have that (a stock you own) will go up in price? And if you are buying, how much should you pay? What you’re asking here is what makes a company valuable, and why it will be more valuable tomorrow than it is today. There are many theories, but to me, it always comes down to earnings and assets. Especially earnings.” Peter Lynch - One Up On Wall Street Estimating earnings for a company like Fairfax is difficult: It is a non-traditional P/C insurance company – with significant equity holdings. It has been under-earning for much of the past decade. A great deal of (good) change has been going on ‘under the hood’ for the past 5 years. As a result, the historical numbers for Fairfax are pretty messed up. But this has been changing the past couple of years. The turnaround in operating earnings that started in 2021 gathered steam in 2022 and 2023. And with 2024 results out, we now have 4 years of ‘good/clean’ data/information - results that better reflect the current fundamentals and future earnings power of the company. Bottom line, historical results are becoming a more useful input for investors to use to estimate future results. However, given Fairfax is a non-traditional P/C insurance company, estimating future results still has its challenges. There is no ‘over the counter’ model out there that can be used to estimate earnings for Fairfax. But that difficulty also creates opportunity for those who are prepared to put in the time and do the work. As a result, we have built our own model to estimate the future earnings for Fairfax. And that is what is contained in this chapter. ————— Before we get into the details, we need to first discuss two obvious but important points. Annual volatility “Because our year-to-year results are inherently volatile, we believe a five-year rolling average to be appropriate for judging the historical record.” Warren Buffett – Berkshire Hathaway 1984AR Annual results are important. However, because of their business models, annual results for companies like Fairfax, Berkshire Hathaway and Markel will be volatile. This is the case for two very different reasons: P/C insurance results are volatile, due to catastrophes. Investment results are volatile, due to fluctuations in financial markets. Some years the fluctuations in reported results will be large. As a result, it makes sense for investors to use a 3-year rolling average when evaluating the performance of a company like Fairfax. Accounting results versus economic results Our earnings model for Fairfax is an accounting model. Accounting models calculate earnings per share and book value. However, what really matters to shareholders is what is happening with intrinsic business value over time and the earnings potential of the company. Importantly, accounting results do not capture all of the value creation that is happening at Fairfax each year. As a result, EPS and BV are under-reporting the increase in business value that is happening at Fairfax. In recent years, the gap has been growing. A good example of this is ‘excess of fair value over carrying value’ for Fairfax’s non-insurance associate and consolidated equity holdings. At December 31, 2024 this totaled $1.5 billion, or $68/share (pre-tax). This is value that has been created by Fairfax in recent years that is not showing up in reported results like EPS or BV. This is only one example. Investors need to be aware that Fairfax’s economic results have been coming in ahead of its accounting results and incorporate this fact into how they are assessing the performance of the management team and valuing the company. ————— Overview of our earnings model Fairfax has 5 income streams that drive its reported earnings: Underwriting profit Interest and dividend income Share of profit of associates Non-insurance subsidiaries (consolidated companies) Net gains (losses) on investments If we can get our forecast right for each of these income streams there is a good chance that our earnings estimate for Fairfax as a company will be reasonably accurate. The posts in this chapter will dive into each of the income streams listed above. What is the logic we use to build our forecast? We start with historical numbers. We have them going back to 2016. We then adjust historical numbers to reflect both ‘old news’ and ‘new news’: Internal - company specific announcements/news: reported results, purchases, sales, management commentary; news from the larger equity holdings. External - competition, P/C industry: status of hard market, impact of large catastrophes; economic developments (path of interest rates, state of the economy). We then incorporate any other needed/relevant information/assumptions. Each post in this chapter provides a fair amount of detail which allows the reader to get a basic understanding of the logic used to arrive at the forecasted numbers. This will allow the reader to make adjustments to the forecasted numbers as they see fit. How far out does my crystal ball go? I try and be as fact based as possible. As a result, I generally only go out two years with my forecasts. My focus with this update is to capture 2024 actuals and update our 2025 earnings estimate. We will likely add 2026 to our forecast model in May (spoiler alert – it will likely come in similar to what you see for 2025). What about 2027 and 2028? There are simply too many moving parts to try and do a detailed forecast three years or more into the future. The future path of the hard market in insurance? The level of catastrophes in a given year? The future path of interest rates, the economy and financial markets? Most importantly, how will Fairfax allocate capital? For estimating earnings further out (3 years or more), the quality of the management team is likely the most important factor - especially for P/C insurance companies. Are they good? How good? If they are very good you can have a fairly high confidence level that they will continue to deliver solid results in year 3 and after. You just don’t know the details - yet. For the record, the execution from Fairfax’s management team over the past 5 years has been best-in-class when compared to peers. Forecasting is a very dynamic process The information in this chapter is outdated as soon as it is published. This is because as time passes, we constantly get new information. This newer, more accurate (better) information will cause earnings estimates to change – sometimes materially. As a result, I am constantly updating my forecasts (usually monthly). Sometimes the changes will be small; other times they will be big. Reminder: When I write new posts, I use my current earnings estimate. Old posts contain old earnings estimates. Therefore, when you read a post, it is important to pay attention to the date it was written. It provides you with important context - what I was thinking on that date. Is forecasting a good use of time? Forecasting is a good use of time for me. But the real value is not the actual forecast. It is the thinking and analysis that goes into the building of the forecast that really matters. And when I am wrong, which happens frequently… why? Does my thesis (for that item) need to be updated? Forecasting is simply another tool I use to increase the chances that my investment in Fairfax will work out well.
-
@cubsfan , if you do not know the answer to this question you might want to spend some time on that important topic called history. I’ll give you a hint… when it mattered - WW1 and WW2 - Canada could be counted on to support its allies. Actually, Canada did much more than its fair share. https://www.veterans.gc.ca/en/remembrance/wars-and-conflicts/first-world-war https://www.veterans.gc.ca/en/remembrance/wars-and-conflicts/second-world-war More than one million Canadians and Newfoundlanders served in uniform, both here at home and around the world. Over 45,000 of our brave men and women in uniform gave their lives and another 55,000 were wounded.
-
Two other tailwinds to earnings are the drop in interest rates and currency (US$ weakness vs Euro). The drop in interest rates will spike investment gains from the fixed income portfolio (with an offset from IFRS 17). Netting the two, we should see a gain (+$100 million?). Euro strength will be good for a holding like Eurobank. Weak US$ will also be a tailwind to growth in book value (comprehensive income). With the California wildfires, underwriting will likely be a headwind.
-
+1. If your big positions are performing you are probably going to do pretty well.
-
My guess is Fairfax has been selling off over the past 2 weeks because some investors are concerned about the impact of the current stock market correction on the value of their equity portfolio. Pre 2020 this would have been a legitimate concern. Back then investment gains (losses) represented about 50% of Fairfax's income streams. So Fairfax's short term results were impacted in a pretty significant way when equities markets sold off aggressively. That is no longer the case. For three reasons: 1.) Today, investment gains (losses) represent only about 20% of Fairfax's income streams. 2.) Fairfax has been aggressively increasing its associate and consolidated equity holdings (as a share of the total equity bucket) - the value of these holdings are not impacted by Mr. Market (Fairfax's income statement and balance sheet). 3.) Fairfax has been improving the quality of its collection of equity holdings over the past 6 years. This should result in less volatility in their market value (than when they were of much lower quality). As a result, stock market sell offs will impact Fairfax's reported results much less than in the past. Investors probably just don't understand that yet. So the current sell off in Fairfax's shares is a gift. For Fairfax - a lower share price will simply allow them to buy back more shares. And for long term investors. ----------- Volatility is Fairfax's friend. I have been saying for quite some time that Fairfax investors should be praying for a shit-storm in financial markets. I am talking about investors in Fairfax (those with a long term time horizon) not traders in Fairfax (those with a short term time horizon). Times of extreme volatility are when value investors get their best opportunities (the needle movers). The 20 'punch card' moments that Buffett talks about. And the senior management team at Fairfax is on a hot streak (their execution over the past 5 years has been outstanding) and the company is all cashed up - that is a great set-up for long term shareholders of Fairfax.
-
With the correction in stocks, how is Fairfax’s largest mark-to-market equity holding performing? YTD 2025 Orla Mining (gold producer) is up $176m. Over the past 14.5 months the holding is up $306m or 166%. This does not include the convertible notes. Outstanding.
-
With the correction in stocks, how is Fairfax’s largest equity holding performing? YTD, Eurobank is up $467m. Fairfax also received $194m in Jan (sold 80m shares as required by Grk regulators). Total = $661m. Excess of FV over CV = $1.15b ($53 er Fairfax share).
-
@73 Reds , the short answer is: it is complex. What is the problem that needs to be solved? Immigration? Drugs? USMCA? Free trade? Nato? Other? Or is it Trump needs to find some new revenue sources to pay for his $1.4 trillion dollar tax cut? To state the obvious, the US’ relationship with the rest of the world has been evolving since world war 2. Many presidents - both Democrat and Republican - have been part of that process. Ok. So how does the US get to a getter place? I don’t know. That is well over my pay grade. To answer your question properly would require a deep dive into the many different issues - and that is not something I have the time / inclination / skill set to actually do. Perhaps Trump’s way is the only/best/optimal way. We will see.