Viking
-
Posts
6,052 -
Joined
-
Last visited
-
Days Won
78
Content Type
Profiles
Forums
Events
Everything posted by Viking
-
@Marco Van Basten, sorry, I know nothing about UA. Is it a material position for Fairfax? As a reminder, Fairfax has an investment portfolio of $75 billion, and an equity portfolio of about $26 billion. My focus is on the big holdings… Eurobank, Poseidon, BIAL etc. If you compare Fairfax today to Fairfax of 10 years ago I think my point holds. The direction of travel is what is important to me. Fairfax owns lots of different holdings. They have lots of equity analysts. They are going to make mistakes.
-
@SafetyinNumbers , I have listened to all your podcasts… I think this one was your best. You explain complicated things in a way that is understandable for the listener. And in a concise way. Please keep them coming… I learn lots every time I listen to a new one.
-
@Phoenix01 , multiple will be something to watch. If we do see further multiple expansion this will open up interesting opportunities for Fairfax moving forward. For Fairfax, risks and opportunities are often two sides of the same coin - because they have built such a flexible business model/set of capabilities.
-
From my perspective, Blackberry stopped mattering as an investment when Fairfax exited the debentures and Prem stepped down from the board. In terms of size, it is immaterial to Fairfax. But Blackberry delivered significant value to current shareholders - it, along with a couple of other terrible investments, forced Fairfax to improve its investment framework. Which it did. This also tells us that Fairfax is a learning organization - able to learn from its mistakes. And that might be the best way to describe the kind of company Fairfax is/has been over the past 40 years. What they do well, they get better at. When they stumble, they learn and improve. ‘A little better everyday.’ That approach (culture) is going to serve them and shareholders very well over the next 40 years.
-
Index investors, the S&P/TSX 60 and Fairfax Hat tip: This post was inspired by @SafetyinNumbers many thoughtful posts on this topic over the past two years. Index investing: a structural shift in markets Financial markets are constantly evolving. One of the most important changes over the past 30 years has been the rapid adoption of index investing. How exactly is index investing changing how the stock market works? That is where things get interesting. The short answer is that we do not really know—at least not yet. In many ways, we are in the middle of a large, real-time science experiment. Index investing has grown so large that it is almost certainly influencing stock prices and valuations, but the full effects will only become clear with the benefit of hindsight. We will likely have much better answers in another decade or two. Unfortunately, that does not help us much today. So what does all of this have to do with Fairfax Financial? Fairfax and the S&P/TSX 60 On December 5, 2025, it was announced that Fairfax Financial would be added to the S&P/TSX 60 Index, Canada’s flagship large-cap index, effective December 22, 2025. This raises a natural and important question for investors: Does index inclusion impact a company’s stock price and valuation? That is the question explored in this post. A different lens: supply and demand To understand the potential impact of index investing, it helps to step outside our usual analytical comfort zone. Instead of focusing on fundamentals, earnings, and valuation, we will look at stock prices through the lens of supply and demand. From Econ 101, we know: Supply is the amount of something available for sale Demand is the amount people want to buy Price is the clearing mechanism between buyers and sellers If demand exceeds supply, prices should rise. If supply exceeds demand, prices should fall—assuming markets function reasonably well. This relationship is often illustrated with a simple supply-and-demand graph. The same logic applies to stocks. At any moment, a stock’s price represents an equilibrium point where buyers and sellers agree. Shares outstanding, float, and equilibrium If demand for a company’s shares rises faster than supply, the stock price should increase. If supply rises faster than demand, the price should fall. Index investing affects this balance in two distinct ways: The ongoing impact of being in an index The one-time impact of being added to an index Let’s examine each. 1. What happens when a stock is in a major index? Growing demand for shares ETF and index investing has grown steadily for three decades and is now fully mainstream—particularly in North America. This growth appears structural rather than cyclical. As assets flow into index funds, those funds must continuously buy shares of companies in major indexes such as the S&P 500 or the S&P/TSX 60. This creates a steady, ongoing source of demand. Declining effective supply (float) Index funds are not market timers. And they are largely buy-and-hold investors. As long as a company remains in the index and maintains its weighting, index funds tend to hold the shares indefinitely. In practical terms, this removes shares from the trading float, reducing the supply available to other investors. Price-insensitive buyers Perhaps most importantly, index funds are largely price agnostic. Valuation does not matter; weighting does. This matters because price is supposed to be the market’s clearing mechanism. But for this growing pool of capital, price plays a limited role. 2. What happens when a stock is added to an index? Major indexes typically rebalance quarterly. Winners are added; laggards are removed. When a stock is added, index funds must buy shares to reach the appropriate weighting. This creates a one-time surge in demand, again from largely price-insensitive buyers. Summary: index effects on supply and demand Short term (index inclusion): One-time spike in demand – price insensitive Reduction in effective float (supply) Long term (index membership): Ongoing, steady demand – price insensitive Continued reduction in float (supply) Index investing is growing rapidly, and its influence on markets continues to increase. All else equal, this setup should act as a tailwind for stock prices over time. How large is the effect? That is the million-dollar question. We do not know. But it is likely larger than many investors appreciate today. Additional accelerants Let’s expand the analysis slightly. Share buybacks What happens when a company is aggressively buying back its own shares at the same time index demand is increasing? Supply shrinks further. All else equal, this should push prices higher. Quantitative and momentum investing Another major market shift over the past 30 years has been the rise of quantitative and momentum strategies. This crowd loves stocks that are already going up—and that keep going up. Not coincidentally, stocks added to major indexes are typically those that have already performed well and grown in market capitalization. Despite being labeled “passive,” index investing has strong momentum-like characteristics: Winners are added Losers are removed New flows disproportionately favor the largest, best-performing stocks When index investors and momentum investors are buying simultaneously—and the company itself is buying back stock—the law of supply and demand suggests upward pressure on price. Especially if the company is performing well (improving fundamentals and growing earnings). This is how multiple expansion can occur, sometimes over many years. From value to quality Another powerful shift occurs when a stock transitions from being perceived as a value play to a quality compounder. As new investor cohorts become interested, demand broadens further. The “perfect” setup The ideal conditions for sustained stock price appreciation look something like this: High and growing demand from: Value investors Index investors Momentum investors Quality-focused investors Shrinking supply due to: Index fund ownership Company share buybacks This can create a virtuous circle: Higher prices → higher market cap → increased index and momentum demand → higher prices. These cycles can take years to fully play out. Bringing it back to Fairfax On December 5, 2025, it was announced that Fairfax Financial would be added to the S&P/TSX 60 Index, effective December 22, 2025. Fairfax was previously the largest Canadian public company not included in the index, despite ranking among the top companies by market capitalization. Are we seeing any impact on Fairfax’s share price? Since December 5, 2025, Fairfax’s share price has increased by 9%. While many factors influence short-term price movements, it appears index inclusion is having a positive impact. Final thought Index investing has quietly become one of the most powerful forces in financial markets. Its effects are subtle, cumulative, and often underestimated. Index inclusion: Increases demand for shares Reduces effective float (supply) Introduces a new, long-term class of price-insensitive buyers For Fairfax shareholders, inclusion in the S&P/TSX 60 is another structural tailwind for the stock - and one that could persist for years.

-
Blackberry is a great example of an investment that sucked for shareholders who owned Fairfax pre-2017. But Blackberry is benefitting shareholders who have owned Fairfax since about 2018. One of Fairfax’s demonstrated strengths is its ability to learn from its mistakes. Blackberry is a great example of this. Blackberry taught Fairfax the importance of partnering with strong management/entrepreneurs. Lazaridis and Balsillie were great at startup/early years and terrible at operating a mature business being disrupted by Apple, Android/Samsung. Fairfax slowly learned the hard lesson over the subsequent years that they are not resourced at head office to be a turn-around shop. That is even more true today - given their much larger size. Since 2018, look at the major purchases they have made. Almost every one had a strong/exceptional leader. Look at the legacy equity holdings they added to (the keepers) since 2018 - most are run by strong/exceptional leaders. Look at all the legacy businesses they exited/restructured/shrunk (poor leadership). Capital is leaving under performers and it and new capital is going to the best opportunities. Music to an investors ears. Is their record perfect since 2018? No, of course not. Is it very good? Yes, I think it is. What is important for an investor today is the proven fact that Fairfax is a learning organization. And I think it is addressing issues quicker today than in the past - it appears to be course correcting more quickly. And not just with investments - also with insurance (with Brit and their cat exposure being a good recent example). The trend is super important. As an organization, Fairfax is moving in the right direction (partnering with strong people). And addressing issues more quickly. Just another couple - in the long list - of reasons why an investor would want to own Fairfax today. When people discuss Blackberry today, it should be in this context: Learn. And flush. And move on.
-
@SafetyinNumbers, you call on the bump due to index inclusion is looking pretty good. Well done! And thanks (my Fairfax swing trade has done very well - with index inclusion being the cherry on top). And yes, it will be super interesting to see if index inclusion pushes the multiple up. A tailwind for sure... we just don't know how powerful it will be. Your analysis of flows is a helpful way to think about it.
-
The article certainly summarizes the situation at Fairfax India perfectly (I am being sarcastic). From the article: “The Korea discount stemmed from investors’ fears of abusive transactions, especially value-destructive mergers and acquisitions and related-party deals to support family empire-building and estate planning. The routine rubber-stamping of such transactions by compliant boards and a largely toothless shareholder base reinforced the notion that Korea was run by and for its largest shareholders.”
-
@sholland , from the book below “Hiring Andy was the single best decision I’ve made.” Prem Watsa Prem has hired many, many outstanding individuals - this says something. (Back in 2021, before investments turned around, Prem was probably VERY happy that insurance had been performing well). Link to book on Odyssey web site: https://online.fliphtml5.com/bxxq/xlyw/#p=1 The file below is a pig to download (took me about 5 minutes when I tested the link). And it is full of my highlights... Odyssey Group Enduring Momentum - May 18 2021.pdf
-
@Marco Van Basten When I reference Fairfax management as being best in class it is looking at the total picture. Of course, that does not mean they are best in class at every aspect of it. In terms of where I got 20% for 40 years, my source was Fairfax AGM presentation (19.2% over 39 years, US$ and including dividends reinvested). This year the total return is tracking +20%. FYI, Fairfax was founded in 1985.
-
@Marco Van Basten, Fairfax has compounded at 19% for 40 years. Is that not getting close to a ‘walk on water’ track record? I think I was pretty hard on Prem and Fairfax at times back in 2019, 2020 and 2021. But I applaud people who acknowledge their mistakes and make the necessary changes. We see the changes Fairfax made in their much improved results. Their mistakes appear to have made them a much stronger organization. In terms of insurance, there are lots of fine insurance companies out there, and Chubb appears to be one of them. I do think Fairfax is getting better at insurance. Are they in the top tier? I will let the insurance guys on the board opine on that.
-
As an example, Chubb got caught with its pants down when the bubble in bonds popped - they lost billions and book value got crushed. That time period was a great example of where accounting results grossly overstated economic results. It wasn’t a solvency issue (it could have been for some if catastrophe losses had also been historically high) but it was a real loss. Remember, most P/C insurance companies were buying corporate bonds in 2020 and 2021 at 1% yields - matching duration with their insurance liabilities. Stupid. They forgot about something called interest rate/duration risk. And their mistake cost shareholders billions. They failed management 101 - risk management. But because all the P/C insurers were doing it - they got a free pass. “Who could have known?” They said.
-
@Marco Van Basten, what criteria are you using to judge management? I think change in BVPS and total shareholder return are pretty standard metrics. And from my perspective, 5 years is a good timeframe to use - it is long enough. I used 6 years to remove the noise from Covid (the lower starting point - Dec 31, 2025 - would have helped Fairfax even more and I didn’t want that). Fairfax has smoked Chubb. Chubb is a fine company. But the execution from the management at Fairfax has simply been much, much better over the past 5 years - and it is backed up by the numbers. Fairfax has a much better business model than Chubb. Fairfax optimizes for both insurance and investments. Chubb only optimizes for insurance (essentially only invests in fixed income). When Fairfax executes well - like it has been for the past 5 years - its results (and returns) are much better.
-
Eurobank? Yahoo Finance says stock (EUROB.AT) is €3.48, down a little on the day??? (I hope you are right!)
-
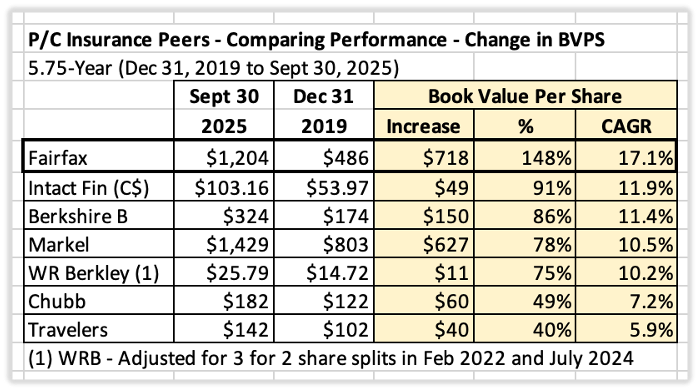
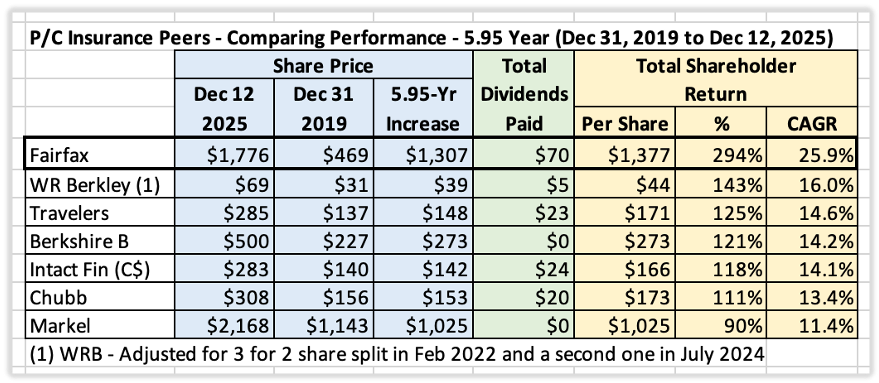
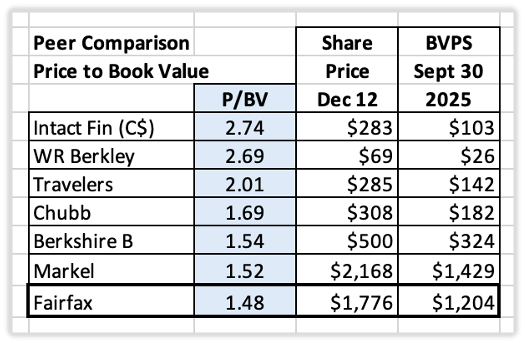
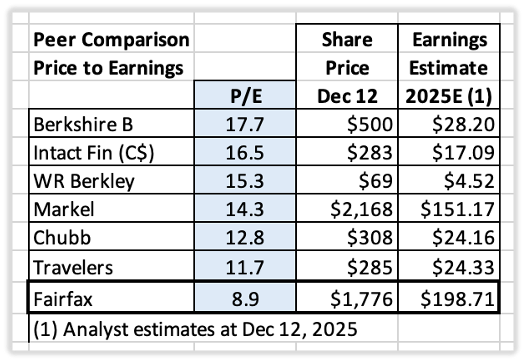
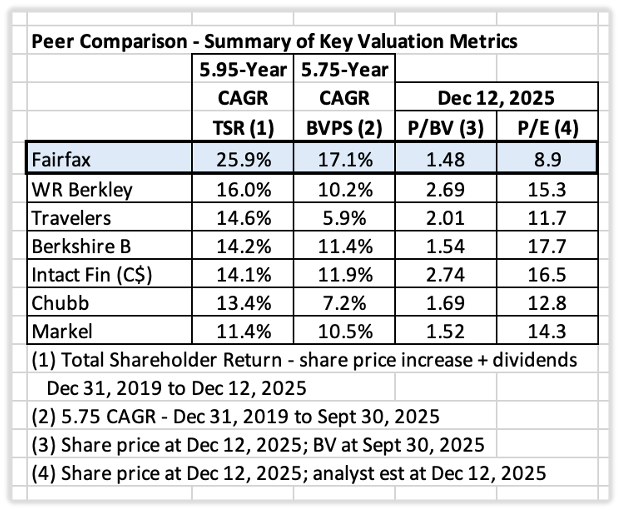
Valuation – Fairfax, PC Insurance Peers and Margin of Safety "The three most important words in investing are margin of safety.” Warren Buffett Introduction: Margin of Safety in Practice Ben Graham introduced margin of safety as the central concept of investing in The Intelligent Investor. The idea is simple but powerful: buy stocks at a meaningful discount to intrinsic value – buy something for $0.50 that is worth $1.00. Doing so limits downside risk if you are wrong and provides substantial upside if you are right. A great deal has happened at Fairfax Financial over the past five years. The stock has performed exceptionally well, raising an obvious question for investors: After such a strong run, is Fairfax now expensive? Or is the market still undervaluing the company? To answer this, we step back and apply traditional P/C insurance valuation tools using a relative valuation framework, comparing Fairfax to a group of high-quality peers. Methodology and Peer Group Valuation Approach: Relative Valuation There are many ways to value a company. In this analysis, we use relative valuation – comparing Fairfax to comparable P/C insurance companies – to address three core questions: How have these companies performed? How are they being valued today? Does valuation align with performance? Peer Group We compare Fairfax against the following P/C insurers (alphabetical order): Berkshire Hathaway (BRK) – Historical gold standard; now a diversified conglomerate Chubb (CB) – Large, global, traditional insurer Intact Financial (IFC.TO) – Largest P/C insurer in Canada; expanding globally Markel (MKL) – “Baby Berkshire”; U.S.-focused Travelers (TRV) – Large U.S. insurer; DJIA component W.R. Berkley (WRB) – High-quality U.S. insurer Each company has a distinct business model. Accordingly, this analysis remains high-level and focuses on metrics most relevant to P/C insurers. Measuring Performance: A Six-Year View Buffett has often suggested that five years is a reasonable timeframe for evaluating management performance. We extend the window slightly to six years – starting December 31, 2019 – to avoid distortions caused by Covid-related volatility. Performance Metrics Used Change in Book Value Per Share (BVPS) Total Shareholder Return (share price appreciation + dividends) Performance Analysis 1. Change in Book Value: 5.75-Year View (Dec 31, 2019–Sept 30, 2025) Book value growth has long been a core metric for evaluating P/C insurers. Results: Fairfax ranks #1 among peers BVPS growth: +148% CAGR: 17.1% Fairfax’s outperformance is material. There is a wide divergence of results across the peer group, with Chubb (7.2% CAGR) and Travelers (5.9% CAGR) at the bottom of the range. An Important Adjustment: Economic vs Accounting Performance BVPS captures accounting results. What ultimately matters, however, are economic results. Over the past 6 years, Fairfax’s economic results have exceeded even its strong accounting results. The most obvious the example is excess of fair value over carrying value for non-insurance associate and consolidated companies, which stood at $2.5 billion ($108 per diluted share, pre-tax) at September 30, 2025. There are numerous examples, including BIAL. The key point is straightforward: Fairfax’s book value is understated. As a result, its true economic outperformance relative to peers is even greater than what reported BVPS suggests. 2. Total Shareholder Return - 5.95-Year View (Dec 31, 2019–Dec 12, 2025) Over the long term, total shareholder return is likely the best single metric for evaluating company performance. Total shareholder return includes share price appreciation plus all dividends paid (including special dividends). Results: Fairfax ranks #1 again Total return: +294% CAGR: 25.9% Most peers delivered respectable returns in the low-to-mid teens. Fairfax’s performance, by contrast, has been exceptional – dramatically outpacing the group. Valuation Analysis Having established performance leadership, we now turn to valuation. 1. Price-to-Book Value (P/BV) Fairfax P/BV: 1.48x Fairfax trades at the lowest P/BV in the peer group. Compared to the most expensive names—such as Intact Financial and W. R. Berkley—Fairfax is meaningfully cheaper. Moreover, as discussed earlier, Fairfax’s book value understates its economic value. Adjusting for this implies that Fairfax’s true P/BV is even lower. In other words, the stock is cheaper than it appears on reported numbers. 2. Price-to-Earnings (P/E) While P/E is not ideal for insurers, it remains useful for peer comparison. Fairfax trailing P/E: 8.9x Once again, Fairfax screens as the cheapest stock in the group. By a wide margin. Summary of Findings Performance Over the past six years, Fairfax has delivered: Best-in-class BVPS growth Best-in-class total shareholder return Valuation Despite this performance, Fairfax currently trades at: P/BV: 1.48x P/E: 8.9x Both are the lowest among peers. Interpreting the Disconnect What explains this valuation gap? Management quality? Best-in-class Earnings quality? Highest in company history; durable and repeatable Future prospects? Stronger than ever, with both insurance and investment engines performing at a high level Ratings agencies agree: AM Best upgrades (2023 and 2025) S&P Global upgrades (2024 and 2025) Sell-side analysts have steadily raised estimates and price targets, with most rating Fairfax Outperform or Top Pick. The simplest explanation is often the most accurate. Fairfax remains under-followed. As a result, it continues to be misunderstood and mis-valued. Conclusion: Margin of Safety Remains An investor today is able to buy the top performing P/C insurance company - with among the strongest future prospects - at the cheapest valuation in its peer group. In Ben Graham’s terms, the stock still appears to offer a meaningful margin of safety. Does that make any sense? No – of course not. “The way of the successful investor is normally to do nothing — not until you see money lying there, somewhere over in the corner, and all that is left for you to do is go over and pick it up.” Jim Rogers
-
I think lots of investors have not been grasping the magnitude of the change that has been happening each and every year for 5 years straight. If you don’t follow the company in a very detailed way it will be impossible to see. What has been happening at Fairfax is not normal - so it is not surprising that most do not see it / value it. It really is a crazy set up (in the best of ways). The part that I find most interesting today is the size of earnings, the good reinvestment opportunities and the effect of compounding and time on future earnings. A close second is hidden value - how big it is today, how much it is growing each year and when it gets surfaced. Fairfax continues to be such an interesting story…
-
@djokovic1 , that is a great summary. Fairfax’s performance has smoked peers over the past 6 years - it hasn’t been a little better, it has been much better. At the same time is it the cheapest - based on P/BV or PE (which is ok to use to compare). What this means is despite its epic run the past 5 years, the stock is still dirt cheap. What explains this apparent contradiction? Fairfax continues to be under-followed and, as a result, misunderstood. Not complicated. And many who follow the company are having a hard time keeping up with improving fundamentals. Which causes more misunderstanding. I am in this camp. My earnings estimates have usually been way too conservative (my initial forecast for 2025 was $152/share). And I was equally terrible in 2024. And 2023. And 2022… Over the past 5 years, it is like Fairfax’s version of the movie Groundhog Day continuously playing out for investors. Under followed. Misunderstood. Undervalued. Rinse and repeat each year for 5 years straight. The same movie is still playing today…
-
@Crip1 , as per usual, I appreciate the comments and the opportunity to debate/discuss. With any investment, starting point matters. With Fairfax India, mine is $16/share, bought a couple of weeks ago. That frames my thoughts on the investment. I have said this before - Fairfax India is an enigma for me. I like management. I really like BIAL. The fee structure is what it is. Achorage IPO has been in the works for what seems like forever. So far, it has been a poor investment for many long term shareholders. It looked wicked cheap at $16. My strategy has been to hold Fairfax (the parent). And to trade Fairfax India. (With the shares help in my RRSP/LIF accounts so there are no tax implications.) The IPO of the airport is likely getting close enough that I might hold a small position in Fairfax India. From my perspective, long term shareholders have had many good opportunities to keep averaging down on weakness, with $16 being the latest. (Sell the shares added when it pops.) If I hold it as a permanent position that is what I will be doing. Best of luck.
-
@SafetyinNumbers , that is an interesting comparison/analysis. One kicker is the significant hidden value that is residing on the balance sheet - economic value that has already been created that has not yet been captured in the accounting results. Excess of FV over CV is $2.5 billion, and growing. Fairfax India/BIAL is another. Ki is another. And then there are the non-insurance consolidated companies. And a couple billion in equities that we don’t have any visibility on (captured in ‘other’ in Fairfax’s summary). But an even bigger kicker is the fact that Fairfax has been aggressively optimizing its equity/non-insurance holdings since about 2018. We are now getting the additional benefit of compounding on a high quality group of holdings. This is a new development for Fairfax - with two benefits: Higher earnings Higher ‘hidden value’ creation Much larger investment gains When you weave it all together (the hidden value that is hidden + what is coming) that 15% hurdle rate looks low. And likely explains why Fairfax continues to be piggish with their share buybacks. I know you get this. I don’t think most investors do.
-
Fairfax India has become a play on BIAL. I outlined the reasons in my previous post. When the Anchorage IPO happens, shareholders will get paid - and probably very well (especially from where the stock is trading today). The question is timing and this requires patience. (Importantly, the airport is increasing in value every year - you are getting paid handsomely while you wait.) What not to like about the current set up?
-
Yes. Effective shares outstanding was 21.33 million at Sept 30. Oct 107,000 Nov 275,000 Assuming they were all cancelled, new total = 20.95 million. Do they keep buying back in December? This puts effective shares outstanding below where they were Dec 31, 2013. All the shares issued to fund the international insurance expansion (2015 to 2017) have been repurchased.
-
Fairfax announced today they sold 25% of their stake in Orla Mining, a gold company, for total proceeds of $316 million. How did the investment perform? Very well. My estimate is with the sale Fairfax locked in a gain of about $223 million or 240% over the past 2 years (average holding period). The management team at Fairfax continues their exceptional performance - they have been putting on a master-class when it comes to capital allocation over the past 5 years - Orla is just the latest example (the list of very successful investments is getting long). Orla is a market-to-market holding - my estimate is the sale will generate a realized investment gain of about $46 million in Q4.
-
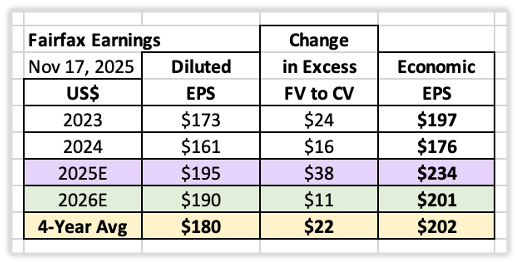
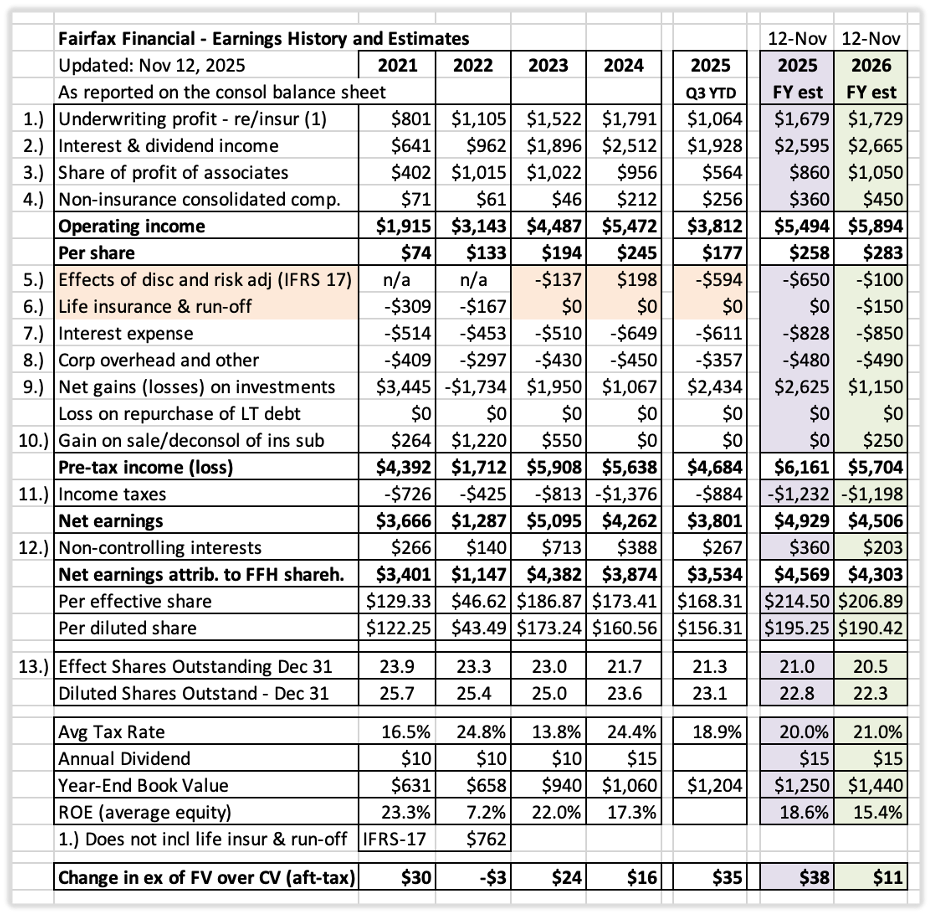
Earnings Estimate Summary for 2025 and 2026 - Update This post provides a little more detail on my 2025 and 2026 earnings forecast for Fairfax. These projections incorporate insights from the April AGM, Q1–Q3 2025 interim results, and broader developments since the prior update in August. At the beginning of 2025, my EPS estimate for Fairfax stood at $152 per share. That increased to $161 in March. As has been the case for several years, I have consistently underestimated Fairfax’s earnings power—and, as the updated forecasts show, this trend continues in 2025. Yes, I need to stop being such a pessimist when it comes to Fairfax! Executive Summary Looked at through the lens of earnings, Fairfax is quietly having the best year in the company’s history. 2025 Outlook · Diluted EPS: ~$195 per share · Excess of Fair Value over Carrying Value (FV–CV): +$38/share (after tax) · Economic EPS: ~$233/share 2026 Outlook · Diluted EPS: ~$190 per share · Excess of FV–CV: +$10/share (after tax) · Economic EPS: ~$200/share Context and Valuation From 2023 through 2026E, diluted EPS are tracking to average about $180/share, with excess of fair value over carrying value for non-insurance associate and consolidated holdings (FV–CV) gains averaging $22/share. That places normalized economic EPS at ~$200/share annually—a conservative baseline to use today when forecasting future results. With Fairfax shares trading currently around $1,700, the valuation works out to ~8.5x normalized economic EPS. For a business of Fairfax’s quality, earnings durability, and capital allocation capability, this is very inexpensive. Framework for the Forecast Estimating Fairfax’s future EPS, BVPS, and ROE requires assessing three fundamental drivers: · Underwriting profit – How good is the P/C insurance business? · Total return on the investment portfolio – How good is the team at Hamblin Watsa? · Capital allocation – How good is senior management? Key Top-Level Assumptions 2025 Combined ratio: 93.5% Total return on investments: 10.5% 2026 Combined ratio: 93.5% Total return on investments: 7.6% (This is conservative) Note: Total return on investments includes annual changes in FV–CV. Six-Year Snapshot: The Transformation Since 2021 The chart below clearly communicates the dramatic transformation that has happened with earnings, beginning in 2021. Importantly, the increase has been driven by operating income. Operating income/share (2016–2020 average): ~$39 Operating income/share (2024): ~$235 Estimated operating income/share (2025): ~$258 That is a 562% increase relative to the pre-turnaround average. Normalized earnings have clearly reset to a much higher, more durable level—and the trajectory remains positive. Street Estimates (as of Nov 17, 2025) Sell-side forecasts for diluted EPS: 2025: $195 2026: $188 These numbers exclude FV–CV value creation. Analysts now understand Fairfax’s fundamentals far better than even a year ago, and their estimates reflect that progress. ————— Detailed Assumptions for Each Line-Item in Forecast for 2025 1. Underwriting Profit Estimate: $1.68 billion (2025) Assumptions: Net premiums written growth of 5% (moderating hard market) Combined ratio of 93.5% Catastrophes: significant in Q1, light in Q3 Continued reserve releases (following strong 2024 trends) 2. Interest and Dividend Income Estimate: $2.68 billion (2025) Tailwinds: Growth in fixed-income portfolio from $47B to $50B Investment in Blizzard Vacatia ($810 million) Ongoing expansion of the mortgage loan portfolio via Kennedy Wilson Headwind: Moderation in short-term rates Yield Assumption: 2025 fixed-income yield: ~5.1% (same as 2024) 3. Share of Profit of Associates Estimate: $860 million (2025) Drivers: Eurobank, Poseidon/Atlas delivering steady performance EXCO Resources benefiting from higher natural gas prices Headwinds: Unrealized 1H loss on Waterous III (Greenfire) Peak Achievement moving to consolidated category in Q4 2024 ($57 million) Sale of Stelco in Q4 2024 ($18 million) 4. Non-Insurance Consolidated Operations Estimate: $360 million (2025) Tailwinds: Additions of Sleep Country (closed Oct 2024) Peak Achievement and Meadow Foods shifting from associate to consolidated This revenue/earnings stream is breaking out and positioned for meaningful growth. 5. IFRS 17: Discounting and Risk Adjustment Two main variables drive this bucket: Net written premium growth (~5%) Trend in interest rates (we assume Treasury yields remain at September 30 levels) This category remains difficult to model; confidence in the estimate is low. 6. Life Insurance and Run-Off Expect adverse reserve development in run-off to be partially offset by earnings from the Greek life insurance operations. Note: For actuals, Buckets 5 and 6 are combined. Fairfax does not provide these separately, but we can back into them based on other disclosed data. 7. Interest Expense Estimate: $828 million (2025) Q3 2025 run rate: $213M 8. Corporate Overhead and Other Estimate: $480 million (2025) Up from $450M in 2024 9. Net Gains on Investments Estimate: $2.625 billion (2025) Drivers in 1H 2025: Mark-to-market increases in FFH-TRS, Orla Mining, and other holdings Benefits from declining bond yields Realized gain of $178.7M from Sigma sale in Q1 10. Gain on Sale / Deconsolidation of Insurance Subsidiaries Estimate: $0 (2025) This this bucket captures large asset sales, usually insurance. Over the past five years, large one-time gains from asset sales/revaluations have averaged about $400 million per year. This bucket remains a wild card. Fairfax has increasing amounts of latent value on its balance sheet, and historically has surfaced it through sales or revaluations—typically resulting in large realized gains. resulting in large realized gains. 11. Income Taxes Estimate: ~20% (2025) Down from 24.4% in 2024 Investment gains, taxed at lower rates, are a larger share of earnings in 2025 12. Non-Controlling Interests Estimate: 7% (2025) As Fairfax buys out minority partners in its insurance subsidiaries (e.g., Brit in 2024; potentially Allied World next), NCI should continue declining—meaning more earnings accrue to common shareholders. 13. Effective Shares Outstanding Estimate: 21.0 million (YE 2025) Fairfax ended 2024 at 21.7M effective shares outstanding, down 1.3M from 2023. We project a further 700,000 share reduction (-3.2%) in 2025. Notes: “Underwriting profit” includes insurance and reinsurance (ex-life/run-off) “Interest and dividend income” and “share of profit of associates” include insurance, reinsurance, and life/run-off
-
How is Fairfax’s equity portfolio performing QTD (to Nov 26)? The holdings that I track are up about $413 million, or $18/Fairfax share. That is a solid result. Currency is a mild headwind (strong US$). Big gainers? Orla Mining (gold) and Eurobank. 2025 is shaping up to be an exceptional year for Fairfax's equity portfolio.
-
+1