Cigarbutt
-
Posts
3,372 -
Joined
-
Last visited
Content Type
Profiles
Forums
Events
Everything posted by Cigarbutt
-
Macro - Corporate Profits as a % of GDP
Cigarbutt replied to Blake Hampton's topic in General Discussion
In 1999, someone who knew a thing or two about investing ventured the following: "In my opinion, you have to be wildly optimistic to believe that corporate profits as a percent of GDP can, for any sustained period, hold much above 6%. One thing keeping the percentage down will be competition, which is alive and well. In addition, there's a public-policy point: If corporate investors, in aggregate, are going to eat an ever-growing portion of the American economic pie, some other group will have to settle for a smaller portion. That would justifiably raise political problems—and in my view a major reslicing of the pie just isn't going to happen." So, potential conclusions: -A macro 'opinion' does not prevent very reasonable outcomes otherwise? -It's hard (impossible?) to reliably profit from a macro 'opinion'? ---- Irrelevant personal addition: i'm reading a book titled Chasing Daylight about a KPMG CEO whose lifespan shortened all of a sudden. The author discusses when he met Warren Buffett and how baffled he was to hear (in informal and impromptu discussions) Mr. Buffett's informed and substantiated opinions about very specific accounting standards. So if you're into that type of rabbit hole, you may be interested by the Kalecki equation which ties corporate profits and the rest of the world (a concept which is also the driver behind recent legislative noise concerning the taxation of buybacks etc). Of course, if that concepts holds any water, fiscal deficits have helped in sustaining corporate profits, a situation quite obvious for some time and especially since 2020 when corporations were able to pass-through increasing and printed costs while corporations and consumers were both subsidized to record levels. The Kalecki Profit Equation: Why Government Deficit Spending (Typically) MUST Boost Corporate Earnings – Economist Writing Every Day -
Note: USB has a diverse deposit base, serves a variety of consumers, businesses, in different industries and states so their deposit base is much less at risk of an isolated run although the possibility cannot be completely ruled out.

-
Is Concentration a better strategy than Buy and Hold?
Cigarbutt replied to Viking's topic in General Discussion
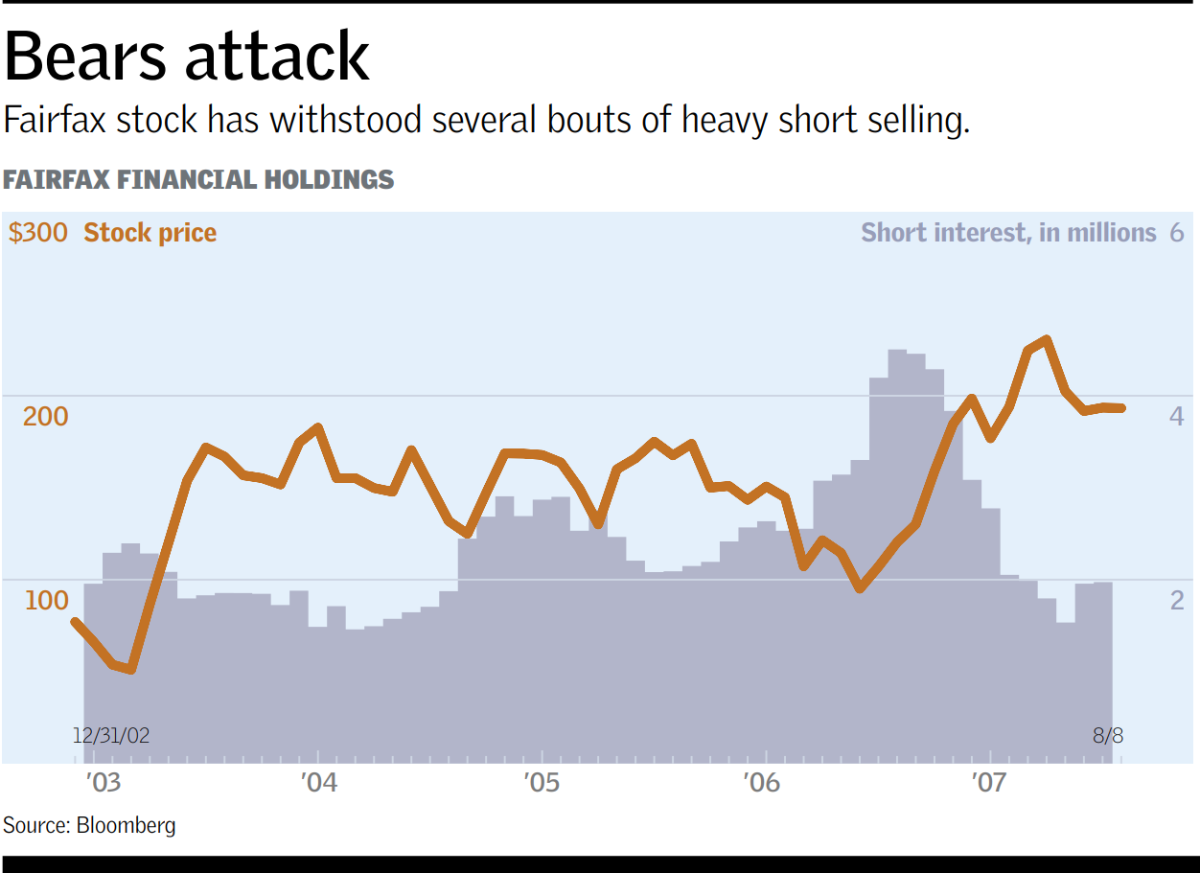
Thanks for this post. If one aims to do better than the average, one has to be different (and better). The challenge is to find some kind of an edge, whether concentrated or not. It is often said that humans tend to forget the actual content of conversations around a situation but tend to strongly recall how they felt during those conversations. In 2006, holding Fairfax was quite uncomfortable (i was often having discussions with fellow expatriates who marveled at real estate and somehow felt at odds investing wise (they're still 'working')). Anyways, that was then, now is now and the future is something else. A fascinating aspect is that self-directed investing requires a balance between opposing arrogance and humility and public sharing on the topic tends to favor (or favour?) the former. i do appreciate the balance that you achieve. Good luck to you and your family. edit: link added from memory lane: Fairfax Attacks Shorts, Then Restates - CFO -
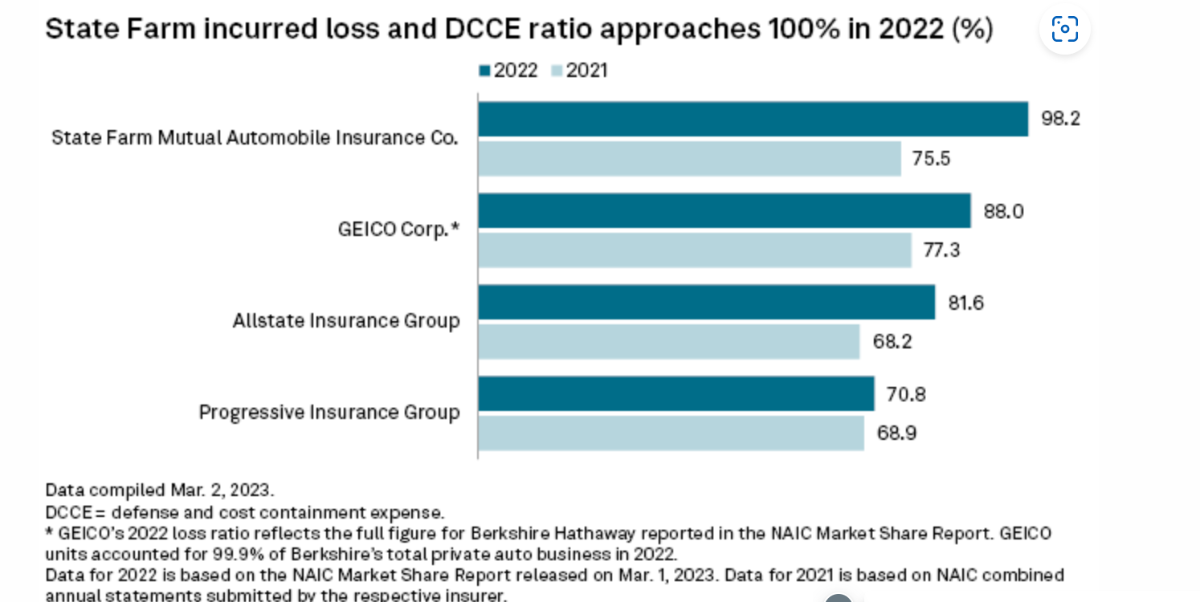
^My guess is that the answer was more qualitative than quantitative but numbers (loss ratios) help to guess how Progressive has been better at segmentation and retention leaving Geico with spontaneous relative adverse selection. Recently:
-
i guess it depends on what you mean by "tightening". If tightening means an attempt at reversal of easy money, from the banks' balance sheet perspective, it's become harder to sell Treasuries on a net basis. Mark-to-market losses will help to go back to an easing mode as banks are less likely to continue to sell securities. If tightening means less liquidity for 'risk-free' securities, it's unusual that a squeeze is already felt in this still ample reserves era. Somehow (similar to the UK situation not long ago), given the apparent liquidity still present, it feels like the 'market' is refusing to react the way expected and this is similar to the 2019 repo crisis. It's not clear if recent tremors have anything to do with a "bottom" concept but i wonder if the Fed is not about to try to become unusually creative with further innovative facilities?
-
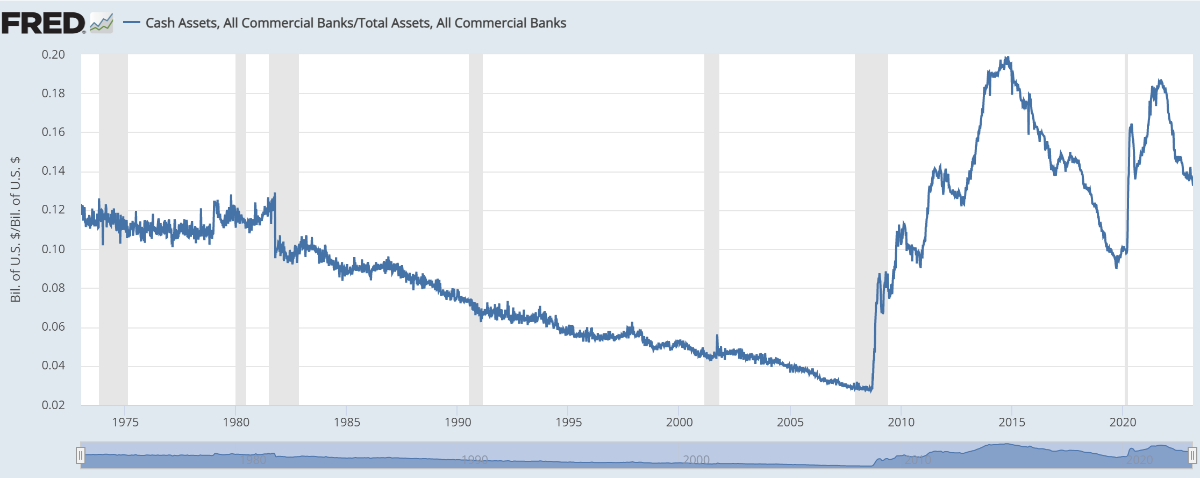
Fair enough but banks have been tightening lending for quite some time now, much before this recent liquidity noise. However, the revelation of some weakness in some banks (smaller, low loan to deposit ratio, less sticky deposit base) is unlikely, on its own, to cause a bank-induced liquidity crisis as deposits from weaker institutions will only tend move to larger institutions (with some leakage to money market funds, not showing up at this point in the reverse repo window). If you dissect the info below from the graphs, smaller banks show a slightly more pronounced recent move in liquidity but, overall, at least on the surface, liquidity appears to remain abundant. Cash assets have grown ++ with recurrent episodes of easing and the growth of cash assets has been larger than the growth of all assets which itself has been superior than GDP growth. The level of cash assets has always corresponded to total reserves (including excess reserves) so banks do not keep excess cash on top of excess reserves and always buy securities with the excess excessive cash. With the recent tightening, the deposit to cash ratio has gone up but remains very low from an historical perspective. This aspect is unlikely to change significantly for the whole banking system if deposits simply move around. All that to say though that it is interesting to see that cracks are starting to appear in the 'system', much earlier in this tightening phase than during the 2019 repo crisis. This looks like an addiction pattern and i wonder if it is debt addiction? ----- Also, a slightly semantic precision (but a conceptual one also): banks do not do loans with deposits, they do deposits with loans. And the largest sources of deposit growth during 2020 to 2022 (about 80 to 85%) were QE to non-banks (most of QE) and banks expanding their balance sheets with government debt.
-
For perspective, all over the news, it's being said that the entire banking sector is scrambling for cash? From a wider perspective, this is unusual and has a similar flavor than around the time of the 2019 repo crisis when banks seemed to be struggling when reserves were being decreased and when reserves were still widely ample from a wider historical perspective. "all of them collectively will increase the liquidity on their balance sheet somewhat. That means less security purchases" Can you elaborate on the previous sentences, especially the bolded parts?
-
^From a collision repair source which may be relevant to the recent Progressive edge: Market concentration in auto insurance increases; GEICO, Progressive projected to pass State Farm in 2023 | Repairer Driven News So, unusually, Progressive has been able to maintain a reasonable compromise between market share growth and profitability. Geico has not but likely will change course for the better? Right now, until they define and see more clearly their competitive position, Geico seems to focus more on the making profit aspect than on the market share aspect, using "macro" criteria? Is it not, in a (exaggerated) way, similar to holding cash when one is relatively clueless about what's going on?
-
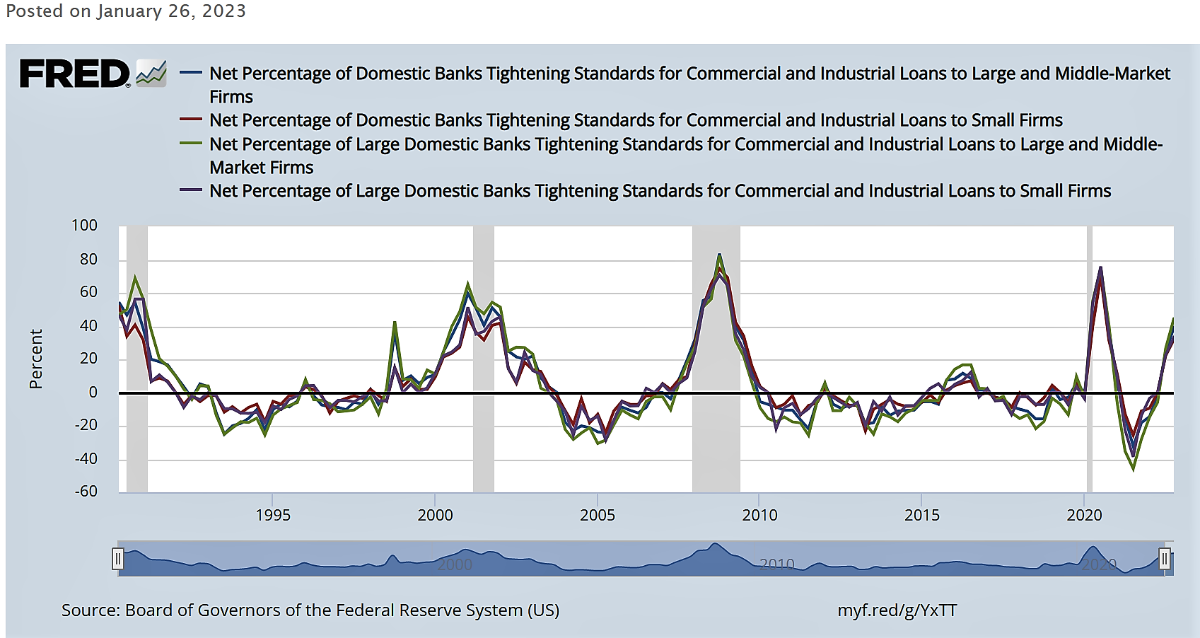
This is becoming widespread knowledge but banks have been tightening for a while now. Below is a picture for C+I loans as a precursor of capital investment to come but a similar picture has been emerging since last fall in most lending categories. There's been covid noise and it's always a cause/consequence/correlation issue just like with inverted yield curves but bank balance sheets as a % of GDP have been going up and it feels like banks are signaling a need to ease conditions even if balance sheets are stuffed with cash and risk-free securities? Many factors enter into the SLOOS process but risk perception is a big one so...and within the sub-sections of the survey, loan demand has been softening too so there's been some recalibration of the supply/demand curve here. The picture is from end of January 2023. From FFH's annual report released yesterday: "As rates go higher, they will have an impact on the economy – 4% across the curve does not seem to do it! Higher rates will destroy the speculation we continue to see in areas such as high tech, SPACs and cryptocurrency. Credit also may be very vulnerable to higher rates as the economy goes into recession. Credit has been very easy all over the world with very low interest rates. While it is difficult to predict, we will not be surprised at a black swan event that arises in the credit area, particularly in the U.S. and Europe, because of the “easy money” that has prevailed for the past decade. Higher interest rates may reveal some “Ponzi” financial structures that we cannot see today!"" Of course, FFH has often been wrong with macro predictions.
-
What's the meaning of lucky and happy and is there a correlation? Anyways back in the days when investing in Fairfax involved more than reading newspaper clips, there seemed to be a tension between some who wanted to get very rich very quickly and some who wanted to get rich relatively quickly. Sometimes, one has to sacrifice something when a change of pace is involved and despite some uncertainty, Fairfax withstood the attacks.
-
The following uses unverified data but likely helps to form a conclusion on the cost of float for BRK. Since end 2017 To Q3 2022, BRK has reported 2.942B in underwriting profit with an overall combined ratio slightly below 100% so on a purely arithmetic basis, the historical combined ratio since inception is possibly still slightly above 100%. However, on a money-weighted basis (float grew larger during more favorable underwriting results), the historical combined ratio is likely slightly below 100%. Conclusion and relevance for the FFH thread? Many roads lead to Rome and there are many ways to project the value of FFH in the future but the best (best in the sense of best entry point for subsequent 'alpha' return) for BRK was when BRK was an insurer with a relatively poor underwriting record (70s and early 80s) which was about to improve (and grow++) and when on the edge of the greatest bond bull market of all times.
-
Sometimes i agree a lot with what you suggest and sometimes less so and sometimes... For the bonds held at the typical insurer (especially FFH for this aspect) ie high tier bonds as defined by regulators, bonds are recorded (in their statutory accounting reports) at cost (minor technical detail: the value recorded will change to par value with straight line accounting depending on the premium/discount paid on purchase) and will not be exposed to interest rate risk from the statutory underwriting constraint point of view. The idea is that the typical insurer will be able to hold to maturity and should not be impacted by the embedded interest rate risk that comes with asset-liability matching. i follow now an insurer that recently had to record losses on longer term risk free bonds because of a run-off scenario but an interest rate risk statutory capital charge was recognized only because of the going concern aspect, which is not the case with FFH now. ----- Of course, the above is a technical irrelevance and the real questions are: After reaching market levels closer to intrinsic value, how is the downside protected if impairments (other than temporary type) had to be recognized in the foreseeable future? What is their thought process (individual? committee? which relevant inputs they are using?) concerning their macro outlook on the fixed income side?
-
Can you please provide evidence to back this up?
-
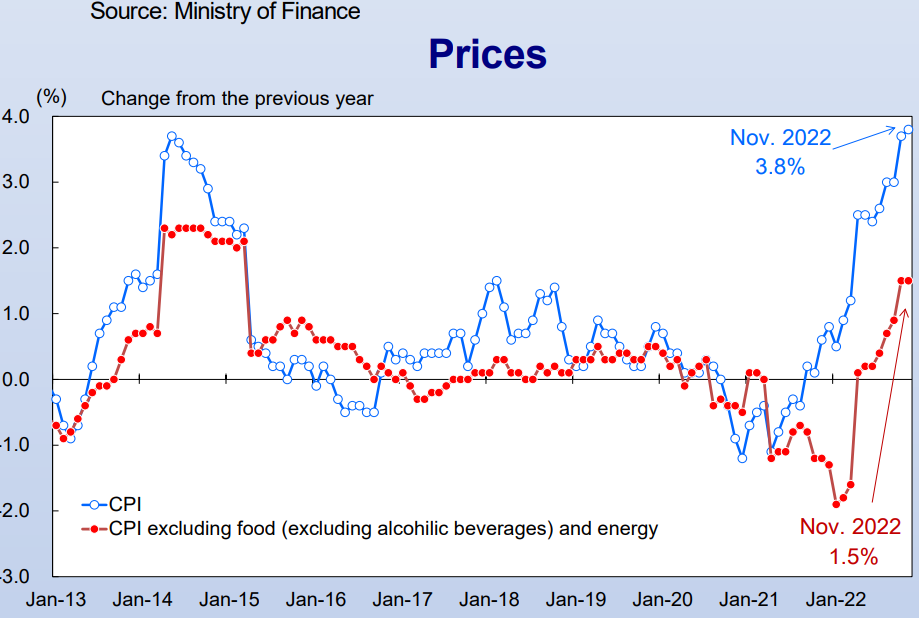
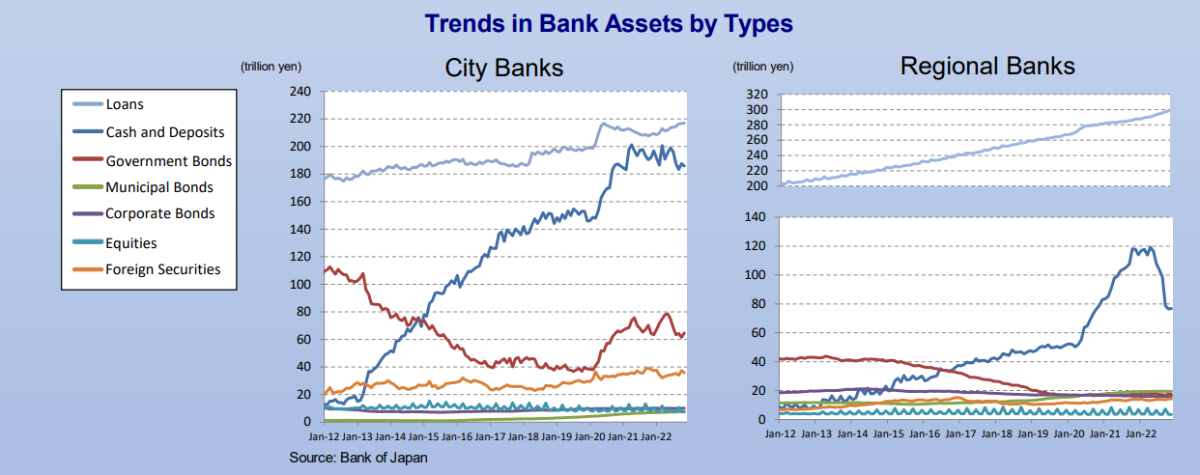
Maybe this all babbling babble but (FWIW) i do enjoy this thread. Inflation in Japan was just mentioned. There is a currency and and a balance of payments effect as Japan imports a lot of energy and food/commodities. Once this part is removed, there's not that much inflation despite huge efforts that pretend to wake inflation up. During 2020, there was a very similar MMT-type policy that Japan accomplished (similar to the US, about a third of all government debt ended up in commercial banks (on their asset side linked to a new money deposit)) which, with a lag, at least stirred some inflation spirits. Below, the blue lines are QE-type transactions, Japan-style and the red line shows the significant uptake of JGBs by city banks. It's likely mostly babble but there doesn't seem to be wide recognition that MMT was tried in a way and...now yield curves have become massively inverted. Why?
-
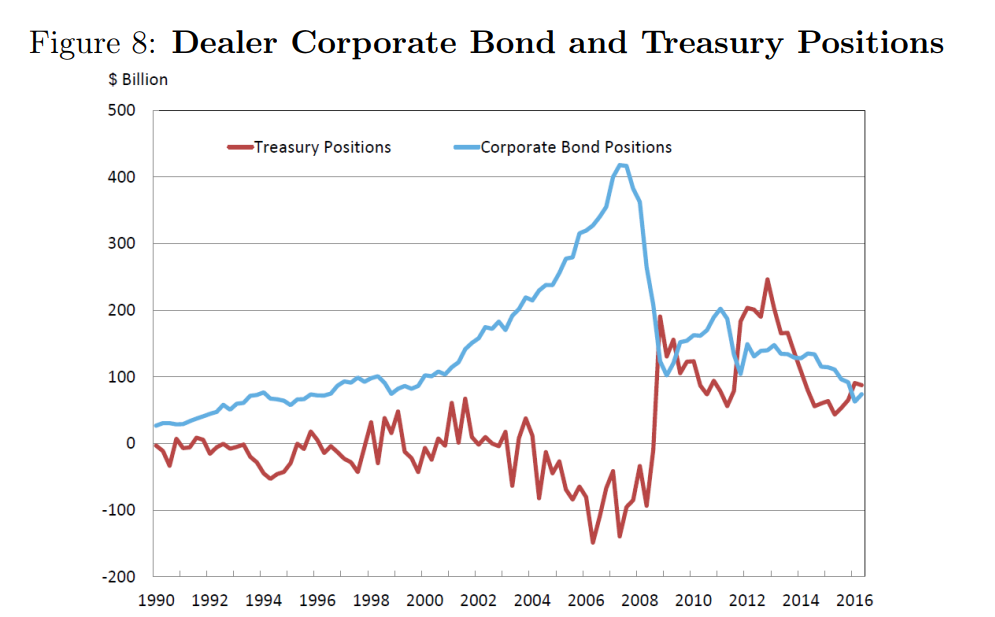
i would add that FFH's historical edge on the fixed income investing side has been very significant (although i don't really understand where they stand now apart from an incredibly high level of lightness of being versus at other times when they did not hesitate to be massively contrarian; and maybe now is not such a time). -Looking back at all the episodes since formation, here's a comment from another this-time-is-different era (when FFH was a levered anchor holding) Leading to the GFC, using dealer position as a proxy for the typical large institutional investor with a typical fixed income asset allocation and remembering that, on top of that, there was a huge pro-cyclical leverage going on in dealer positions also, one can 'feel' how contrarian FFH was around 2007-8. Another added feature not shown in the graph was that the huge move in credit spread included rates in 'risk-free' securities going down, allowing FFH to actually realize barbell investment gains before moving funds to higher yielding securities. For a while, then, it would have been possible to lock a 10% yield of at least intermediate duration on many investment-grade corporate bonds. Anyways, things have changed and history doesn't repeat and the Covid period was different with a much more limited window of opportunity. It seems like the fixed income story is still unfolding.
-
^Yes underwriting 'discipline' is a cultural thing and is developed over time when leaders have it in their DNAs. TransRe Press Release ---) Back to FFH 2023 and beyond
-
Who am i to say but this seems to be the consensus view: The term “managing general underwriter” is often used in the life and health context, while “managing general agent” is often used in the property and casualty context. In practice, the term “managing general underwriter” (“MGU”) is often used synonymously with MGA. MGAs and MGUs seem to be in fashion lately (higher growth than general premium markets) so maybe a good time to sell but (for those with long memories) MGAs can be tricky and the MGA idea was, in fact, a significant part of the existential threat that's part of FFH's history (late 90s and early 2000s). When TIG was bought, about 50% of written premiums came from a single entity based in Dallas (potential ouch!). Mr. Watsa had this to say in 2003 (after putting the MGA platform into a to-be lengthy (and eventually very expensive) run-off): "Of course, our big mistake at TIG was not recognizing that its MGA model would not work, particularly with one broker controlling 40-50% of the business. We should have shut or sold the MGA business years back and built on the much smaller individual risk underwriting operations. The losses at TIG resulted in a weakening of our financial position. You can rest assured on one thing, unless there are exceptional circumstances, we will not ‘‘give our pen’’ away." {my addition: or let anyone else write on our paper} ----- As far as the counter-party comment and potentially naked exposure, someone somewhere is taking the loss but it would be surprising if it's the direct counter-party that's taking the hit because the exposure is likely countered by another party or somehow hedged.
-
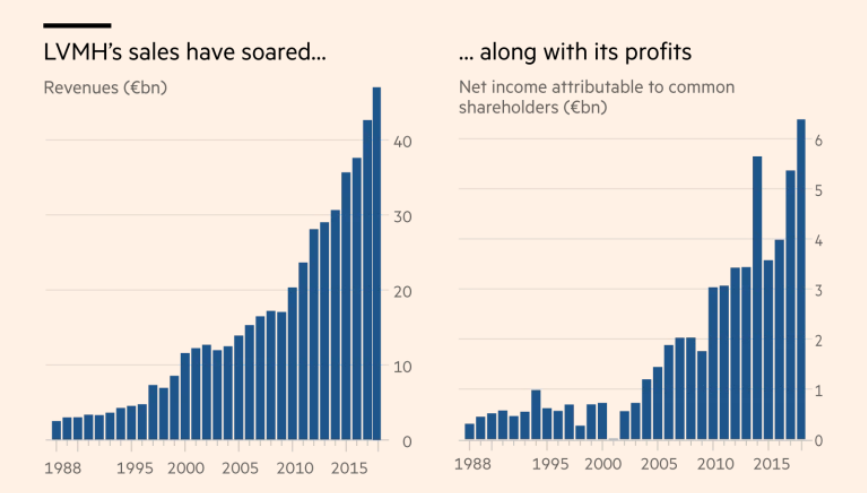
There is some info out there related to the initial capital accumulation phase and before the rest is history: There's Le Goût du Pouvoir (haven't read) which is partly available here: Bernard Arnault ou le Goût du pouvoir (numilog.com) There's L'Ange Exterminateur which (i cannot find my copy), from memory, has gossipy content and which was involved with a defamation possibility but which also contains a detailed account of the financial and tactical moves made by Mr. Arnault during the early years. There's also From Predators to Icons by Villette and Vuillermot (English version available). The book has a section on Bernard Arnault (p.146-158) which is a good summary of his early life and the strategy used to gain control of Boussac (1981-5) and to gain control of LVMH (1987-9). It's funny when you think about it. Mr. Arnault bought a declining textile business with no sustainable moat, eventually 'divested' it and used the platform (from Dior) to build a brand of brands. ----- Apparently, he regularly plays tennis with Roger Federer and asks him to play the best he can. i guess he wants to know what his real worth is?
-
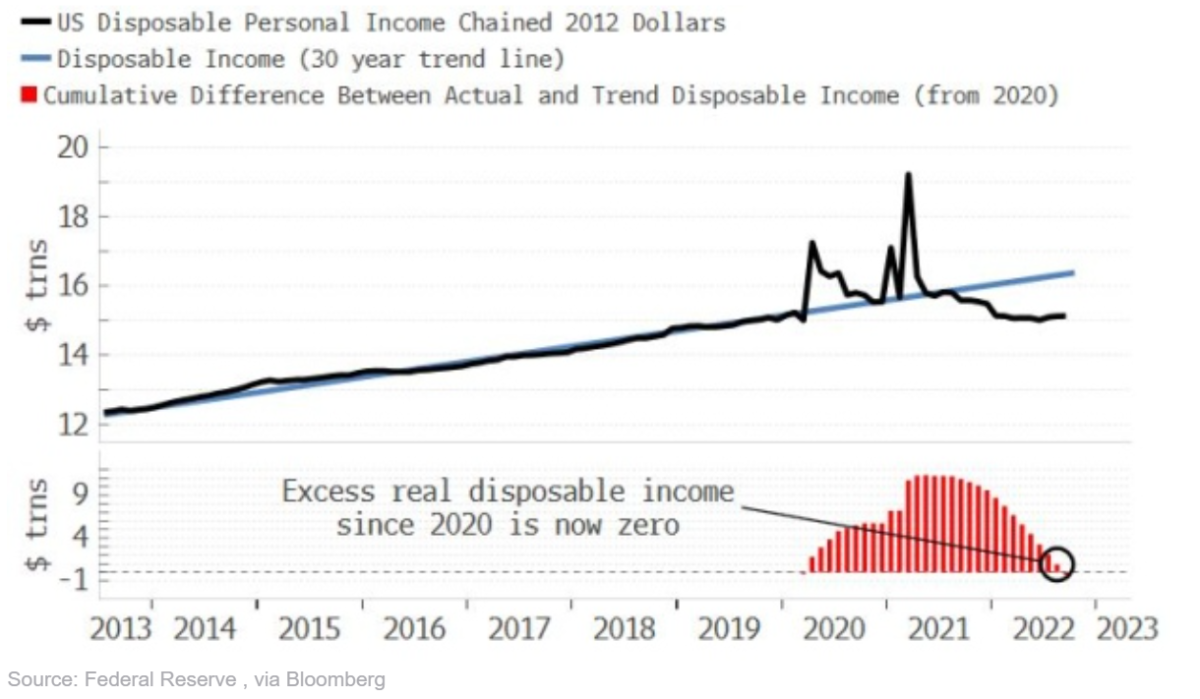
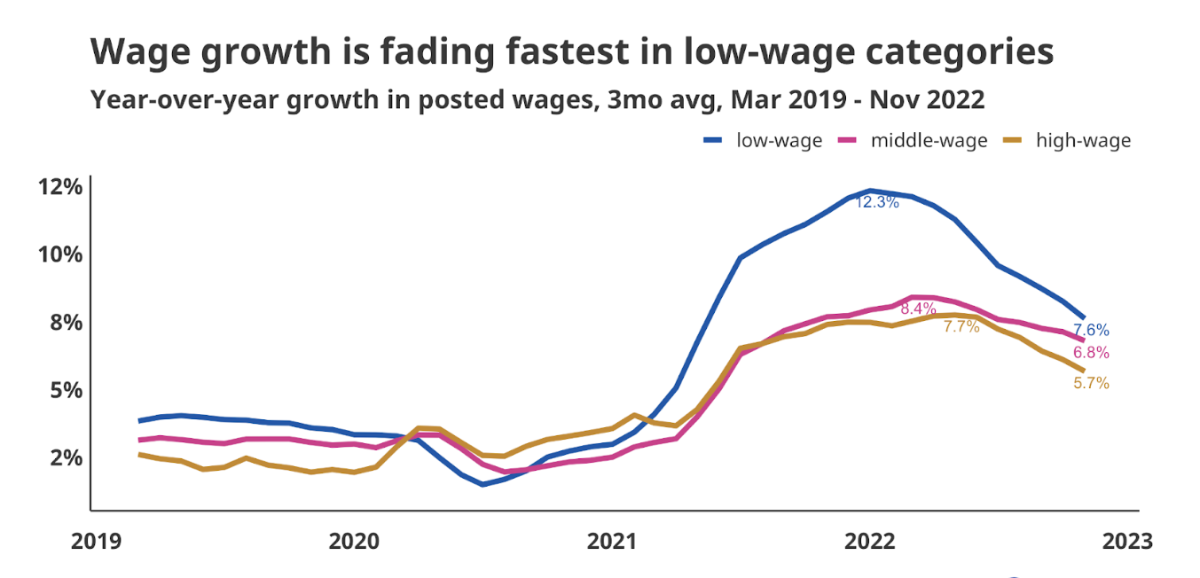
"The two unknowns are the actual level of pain required to quell inflation & the other unknown is the intestinal fortitude the Fed will show." The trouble is that there are more than two unknowns, many of which are unknowables so why bother? ----- -Potential food for thought "I think its clear that the US consumer is going to hit a wall sometime in H1 2023 - various money centre bank CEOs (Jamie Dimon et al) have alluded to what they can see in their proprietary data and I can see it in public data......consumers are running down cash balances, driving up credit card/loan balances..." What you describe here is well illustrated below: As a result of MMT-like policies, there has been excess real income which is still showing up as excess savings but real income growth has been moving to a lower trajectory and demand, going forward, should go back to 2019 trend except that debt levels have risen significantly since then. Wage growth across levels is interesting: Anyways, an interesting aspect is that the excess real income (as shown in red above in the first graph) growth that happened since 2020 is matched fairly well by the expansion of US commercial banks' balance sheet expansion to hold US government debt, similar to what happened during WW2; resulting in no net private wealth but resulting in increased money supply per GDP, increased deposits etc Comparing 1945 to 2022, -federal debt to GDP: similar post-war-type levels (+ or - 100%) although state and muni debt levels significantly higher now -corporate debt to GDP: 20% vs 50% -household debt to GDP: 10% vs 75% i know, an argument could be made that private debt levels were too low in 1945..
-
When asked:"ai personal trainer useful for motivation?", the following came: "An AI personal trainer could potentially be useful for motivation, but it's important to keep in mind that AI technology is not a substitute for human interaction and support. AI personal trainers can provide personalized workout plans and track progress, but they cannot provide the same level of motivation and accountability that a human personal trainer can. Additionally, an AI personal trainer cannot provide the same level of emotional support and encouragement that a human trainer can offer. While an AI personal trainer may be a helpful tool for some people, it's important to consider the limitations of this technology and to seek out other sources of motivation and support if needed." Fascinating but still early days.
-
Yes, for several reasons, the very unusual inflationary period in the 1970s was likely bound to peter out over time and the unusual supply-side effects of oil and commodities as well as the 1970s capex boom may have been instrumental but for the capex boom part, a larger historical perspective does not tend to strongly support that specific factor as a significant independent variable: Apologies for the space taken linked to this macro (and potentially irrelevant) topic.
-
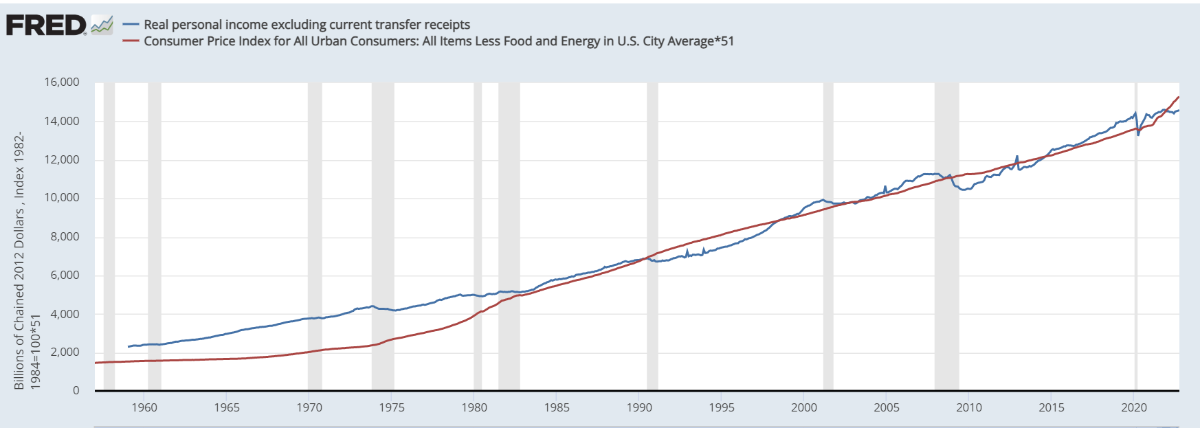
Somehow 'we' should strive for stable prices which could mean mild deflation or some inflation and what counts is the real income growth related to rising standards of living. In the above, i made an adjustment to align the two curves and the message is that 'people' will tend to do better when there is a growing gap (real income rising) between the two curves. After WW2 (not in this graph), there was some inflation and then low inflation and then significantly rising inflation in the 60s and early 70s and then 'we, the people' did quite well because 'we' kept getting ahead. An additional feature (comparatively) during those glorious years was that the real growth was more inclusive (From reading some of your posts, i realize you may not like the word inclusive but just replace with "associated with more widespread opportunities"). Anyways, a lot has been said about how Mr. Volcker slashed the inflation dragon but there were other factors including that rising inflation ahead of nominal income growth contained the seeds of its own destruction and maybe this means that the recent divergent trend between real income (basically flat) and inflation (rising ++) will tend to support what was really meant by transitory.
-
i'm not planning to get 'involved' here. It wasn't me; the closest possible post was about Gorbachev's biography by Taubman, in 2018. But it's been said that societies are potentially only (#) meals away from revolution/anarchy. For #, historically, people have used 3,4 or 9 using a similar figure of style (Hemingway, The Sun also Rises) as for bankruptcy, gradually then suddenly.
-
Ok but how does that change affordability (on a net basis) from the buyer's perspective?
-
Thank you for elaborating but this is not what i meant. "The lesson, in all of this, is that money needs to be based on something of real value" How do 'we' decide what is something of real value? ----- i meant, like a derivative product which 'value' is based on the underlying, what is the underlying for the 'value' of a dollar (choose the denomination) that explains the gap between the value of the paper, ink and printing process etc and the value 'printed' on the paper. The Spain reference is interesting on many levels (investing climate now, money printing and equivalent etc) but it's not the amount of new 'money' that was the problem, it's what 'they' did with it. You have to wonder why England shined in comparison as they took a different (alternative) path related to a different set of social conventions.