Cigarbutt
-
Posts
3,371 -
Joined
-
Last visited
Content Type
Profiles
Forums
Events
Everything posted by Cigarbutt
-
Judge offers Berkshire possible speedy trial over Pilot dispute | Reuters Way to go (opinion) and now is a time for a 'negotiated' settlement. From a noob's scan point of view, Honorable Judge Zurn is a balanced, rational and fair judge. So two opposing views: -BRK's use of pushdown accounting is questionable -Minority holders' behavior is perhaps less than honorable Conclusion (opinion): the negotiated settlement should be close to the 'fair' value determined by pushdown accounting. Unknown: the price Mr. Buffett is willing to pay to put this noise 'issue' behind him and away from public eyes.
-
"He also insisted on as much common space as possible, including a single cafeteria for all —- doctors, scientists and administrators — to encourage creative cross-pollination. He also opened the cafeteria to patients and their families, to give staff members a visual reminder of their collective mission." Creative cross-pollination, isn't that a mental model of sorts, à la Munger, with a human (human in the civilized sense) touch? A single cafeteria, isn't this what this Board is about (apart from making money?)?
-
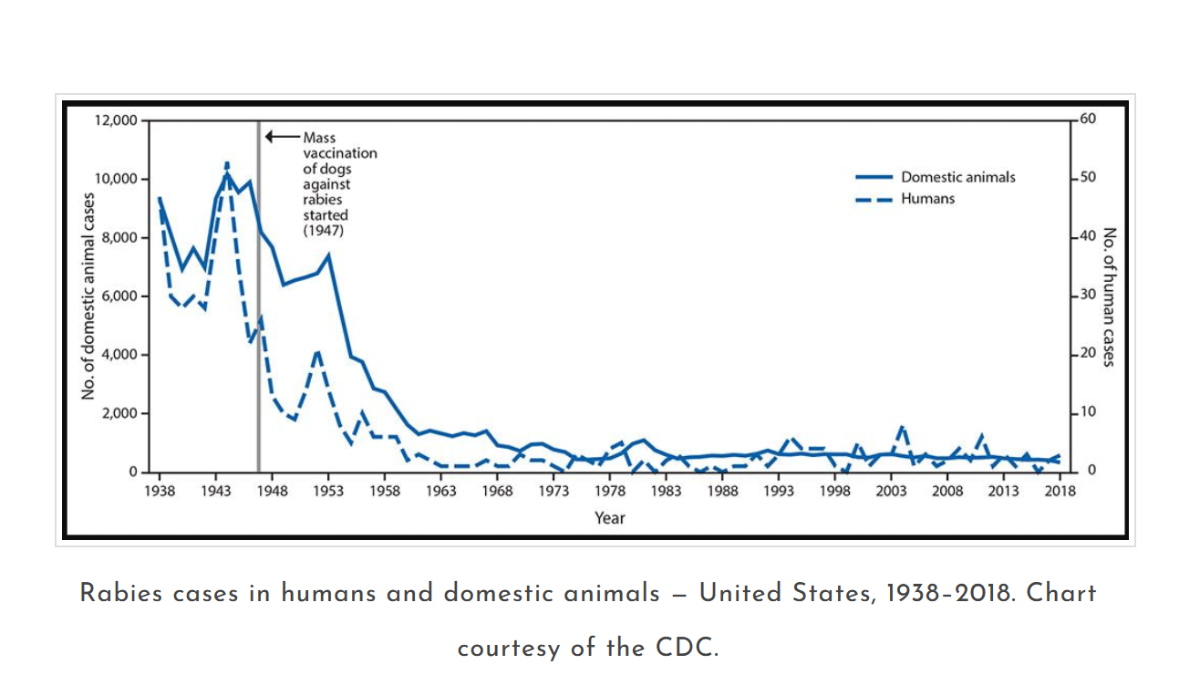
-From the role of luck to present appreciation for civilization and to the need to soldier through (with a bit of "luck"?; my children call this blind optimism) Mr. Munger recently commented on the % success rate to treat child leukemia (from 0% to 90%+) and associated this 'progress' with civilization. In 1931, being bit by a stray dog infected by rabies was essentially a death sentence. The US eradication of the rabies canine variant has been a amazing success arising from civilization (collaborative effort; policies such as stray dog 'management', rational application of science etc). All his life, he wondered.

-
^Filed yesterday under point 35: "Pilot has forfeited any entitlement to the relief it seeks by engaging in misconduct in relation to the very matter in controversy on its claims, namely, the value of its Put Option in 2024." There has been irreparable damage under way that needs concurrent legal treatment. There are still a few pieces of the puzzle missing and some lingering open questions but Can't You Smell That Smell?
-
Probability that covid will become endemic
Cigarbutt replied to LearningMachine's topic in General Discussion
Epilogue Covid has become less virulent with a developing seasonal pattern and it has become endemic. Many data points available to support the above mentioned conclusions; excess mortality shown below. Covid has followed its most likely evolutionary path, influenced by functional hybrid/herd immunity, especially since the Omicron variants have taken over (less virulent and more contagious path): Covid has become just one of the other respiratory viruses and is behaving very similarly the old 4 coronavirus variants that have been around for a long long time. On an individual risk assessment basis, virulence has come down and personal risk factors still count although the higher risk category is now narrower: Interestingly, even if often compared to the 1918 "Spanish flu" episode, the most relevant historical example for Covid may be the 1889 Russian viral episode. The enigma of the 1889 Russian flu pandemic: A coronavirus? - ScienceDirect ----- Any relevance to investing? Cycles are cycles, secular trends are pervasive (despite 'transitory' noise) and even if history never repeats, it often rhymes.
-
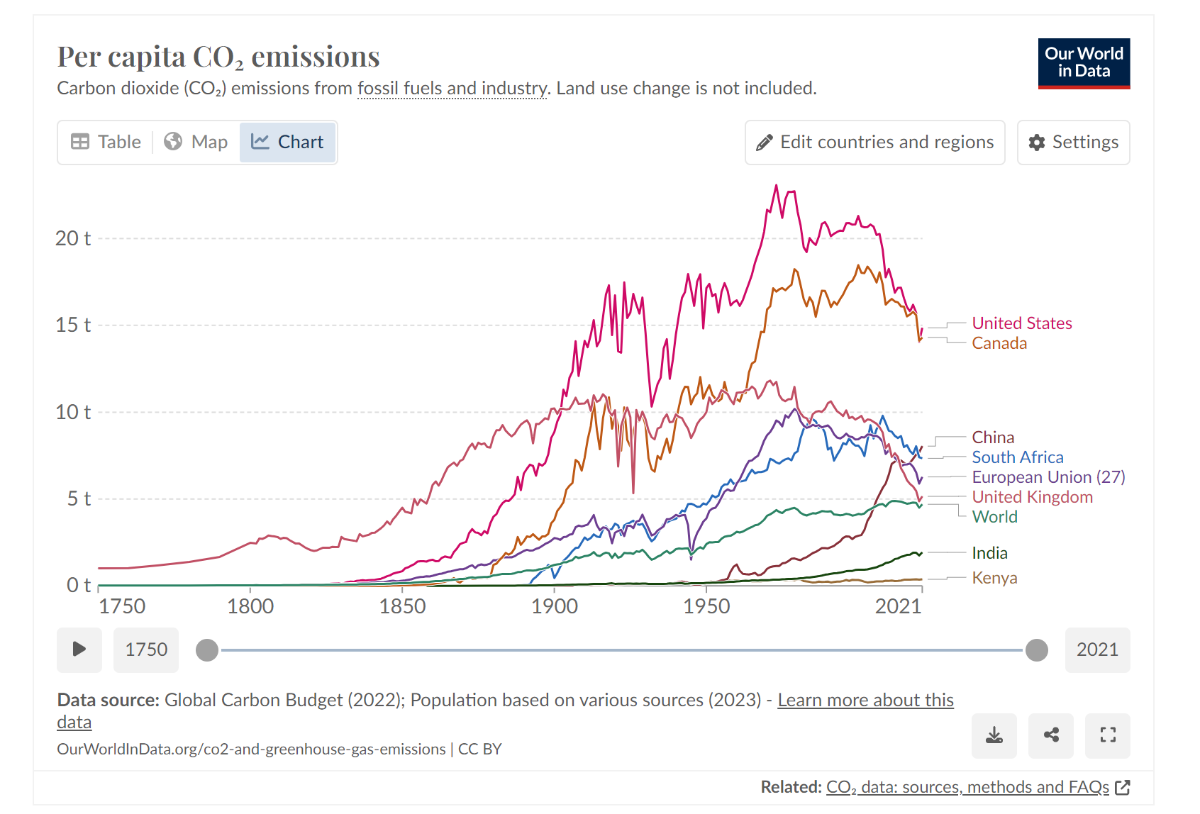
Richest 1% Emit As Much Carbon As 5 Billion People
Cigarbutt replied to Parsad's topic in General Discussion
-submitted only as food for thought, not to argue. There is a growing movement to put a price tag on "carbon" and the price tag will be "progressive" (mathematical definition as in progressive form of taxation) within a specific country. This concept also seems to apply between countries as 'rich' countries are expected to pay more (absolutely and relatively) compared to less rich countries.
-
Apologies for stating the obvious. i'll try to improve in the future. ----- The future is now? So, what should BHE do? -leave Oregon? -leave states with significant wildfire risks? -lobby for tort reform at the national level? From a certain (naive?) perspective, this sounds like an opportunity? For the Oregon fire, the jury (more or less) had to decide what a reasonably competent and prudent utility should have done under the set of circumstances ie they had to define where PacifiCorp belonged in the spectrum from normally expected mitigation efforts to recklessness and negligence liability-type behaviors, a spectrum which is being defined/refined for wildfire risks. BHE could use this opportunity? to become a leader in the category, perhaps emulating San Diego Gas & Electric and taking advantage of in-house insurance and reinsurance modelling capability to improve wildfire risk management. SDG&E recognized by Chartwell for wildfire mitigation predictive modeling technology | Sempra PowerPoint Presentation (oregon.gov) It's now possible to use advanced analytical tools to act, with real-time observations, in order to take validated decisions for public safety power shutoffs with almost surgical precision. ----- The future is not the past but PacifiCorp has many 'tools' to deal with past wildfire costs. First, the non-economic and punitive damages ratio to economic costs (from what i've seen) is at about 20x, a ratio which should not exceed 9x in the worst of cases (Supreme Court reference) and which is likely to be eventually much lower given where i think they should be in the normal-expectations-to-negligent spectrum. Second, they should ask (already done recently) for a cap in relation to future wildfire losses. In Oregon, about 70% of 'damages' go directly and indirectly to the State so a 'negotiated' solution may be in sight. Others? ----- Personal note The US situation for tort losses compared to Canada is highly unusual, especially given the amount of shared values. This AM, i was reading some legal stuff that came out lately. One case was about an ex-husband (lawyer and law professor) who used his knowledge and status to (legally) harass the ex-wife using a despicable approach (a personal approach similar to what was done during the short-term relationship it seems). Despite the nature of the actions from the ex-husband and the decision to accept the notion of judicial violence in the conclusion, the amount of punitive damages resulted in a ratio of about 1.25x to economic losses.. This difference between our two great countries is difficult to reconcile but i am prudent in condemning the US since the cancellation of Mr. Buffett's involvement in a multi-billion LNG project in my jurisdiction (CDN) was cancelled in 2020 and the exit may have been related to some difference in the underlying nature of our legal/regulatory framework linked to the secret sauce (and the difficulty to understand the combination of ingredients).
-
Follow-up note, news released yesterday in relation to the infamous California electric utility that went through bankruptcy and now is able to essentially pass the costs to the consumer. https://www.reuters.com/markets/commodities/california-regulator-decide-pge-base-rate-hike-request-2023-11-16/
-
Is the US economy set for another Roaring ‘20s?
Cigarbutt replied to james22's topic in General Discussion
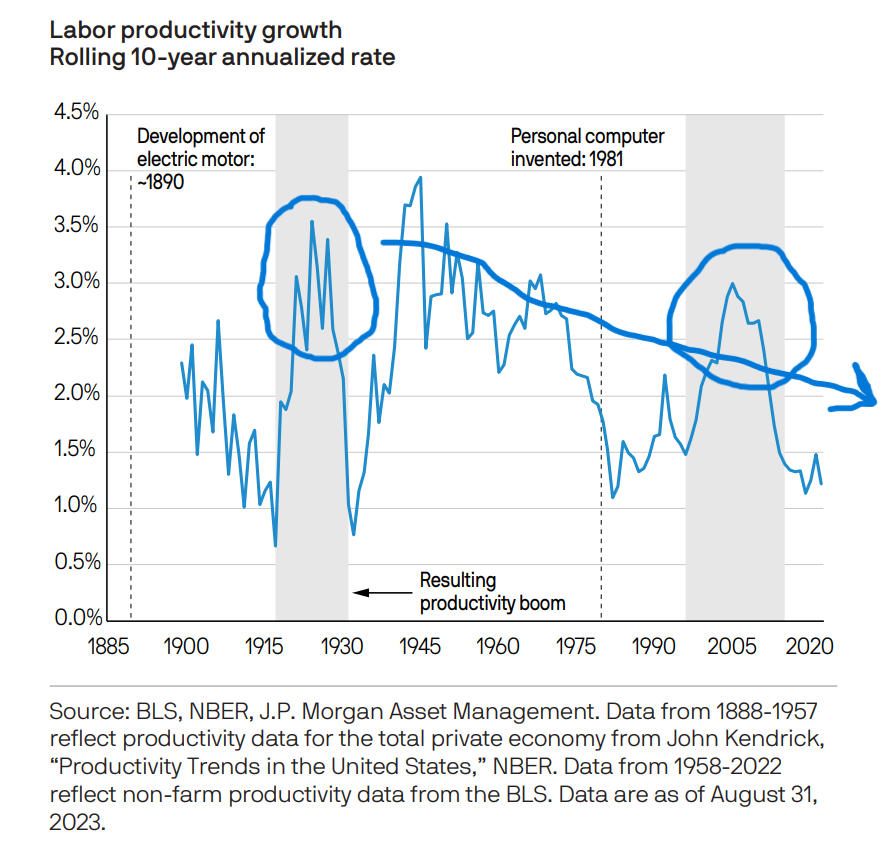
^Adapting quicker?, AI certainly deflationary?, inevitable but will it rhyme? In the 1920s, productivity growth was for real, similar to what happened after the dot-com bu**le but the secular trend in the last 50 years is... i believe productivity growth will make a comeback but it may take a while? and a bit of creative destruction (or destructive creation)?
-
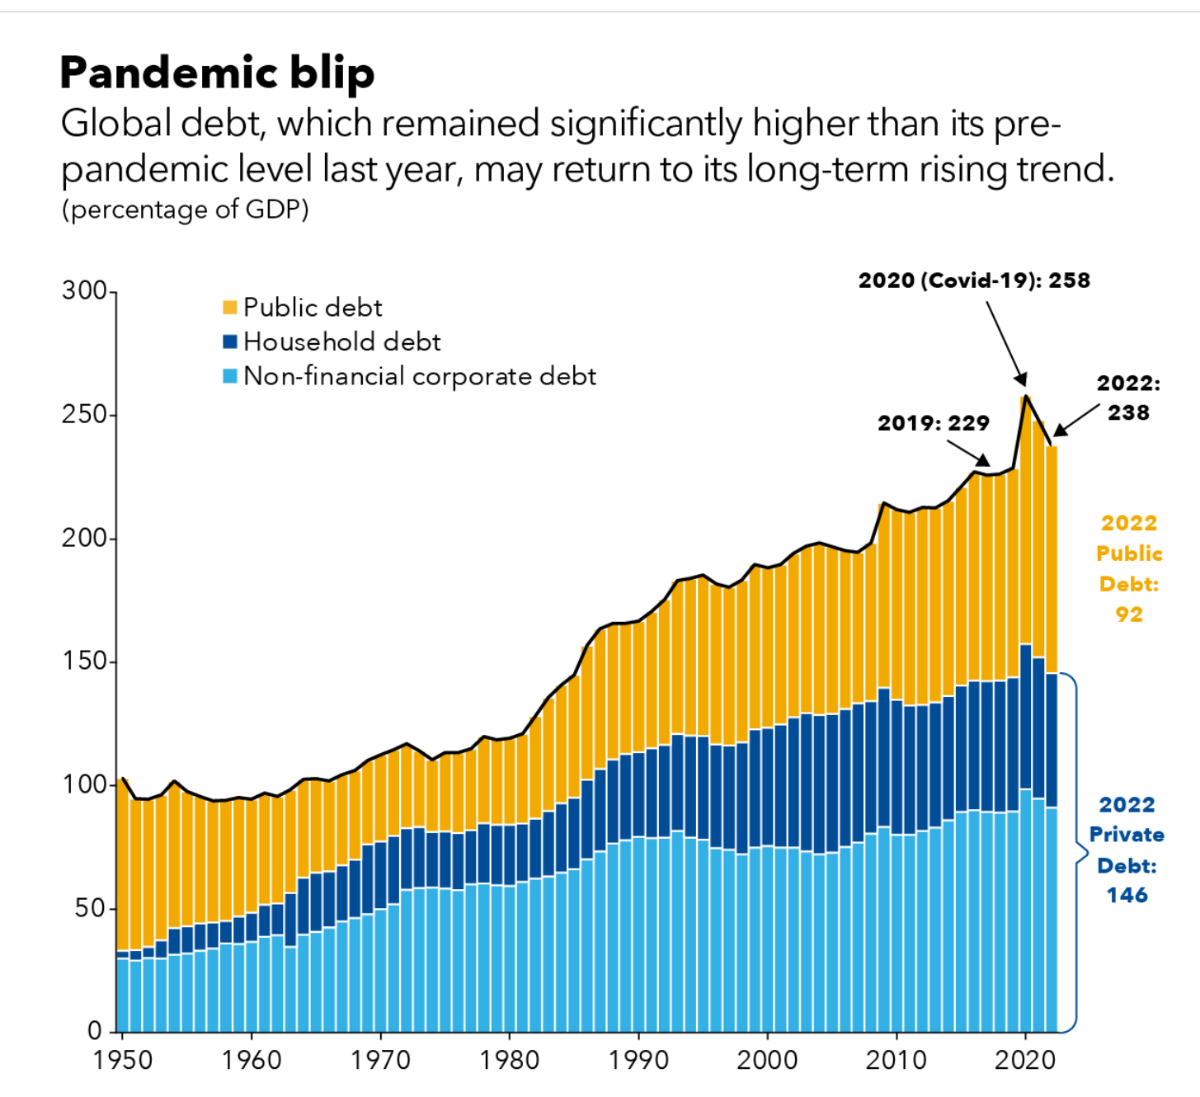
It's measuring global debt which is the US and the rest of the world (about 190 countries and total).
-
Is the US economy set for another Roaring ‘20s?
Cigarbutt replied to james22's topic in General Discussion
The penicillin example is interesting. Penicillin was 'discovered' in 1928 but availability came effectively to 'market' only in the 1940s, mostly as a result of imperfect but still impressive collaboration between countries and a reasonably effective combination of public and private participants. So it took a while for a revolutionary change (like electrification etc) to take effect. Now we have the internet, artificial intelligence and related and, so far, productivity growth numbers have remained quite anemic. So it may take a while for the evolutionary (so far) technology to make it to market in a way to improve productivity (and, as a corollary, our standards of living)? -
Yes since the early 80s, we (the global we) have gradually learned, in a Pavlonian way, to expect the fiscal-monetary playbook to play out, as expected. But is this sustainable? Is there a risk of a non-linear change in trend? Won't the US retain relative refuge value?
-
The bid-to-cover ratio was 2.24. In a context of a very high 'supply' of such securities. This requires to be interpreted into a wider context?
-
Interesting. Please help if the thesis is not beyond criticism. Having limited cognition, i don't along first principles and tend to cling to analogies, links, comparisons etc -i read this recently https://www.linkedin.com/pulse/can-crypto-flip-script-cantillon-effect-ckc-fund From the article: "Several cryptocurrencies and digital assets seek to separate new money creation from politics and the state." i work under the assumptions that: -money creation will remain tied to politics and the state -'we' will learn and won't repeat the Cantillon effect mistake that has shown up in financial and main street inflation numbers since 2020. Where am i wrong?
-
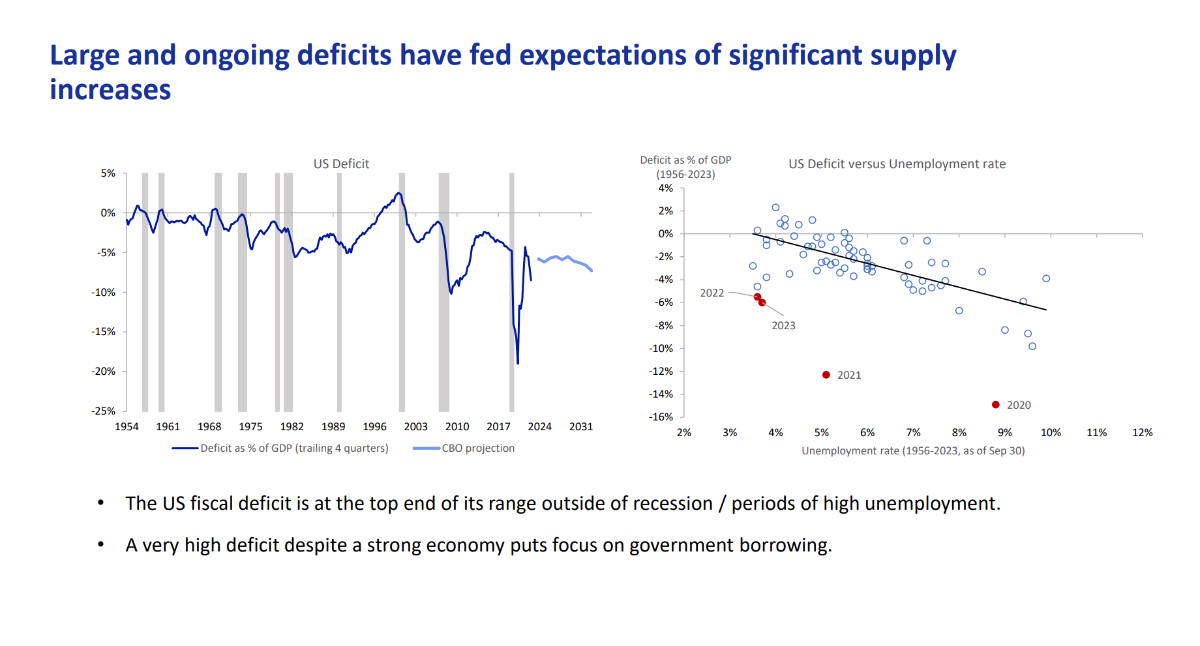
"Reckless" is a strong word and can be debated (here?) but the burden to meet the meaning of unusual is met. "Large and ongoing deficits have fed (sic) expectations..."? What's the point apart from 'interesting' discussions?
-
Rapid answers (possibly wrong and not expert-like). 1. This seems like a reporting requirement and the 2022 annual report had the following to help adjust if need be: "Cash provided by operating activities (excluding operating cash flow activity related to investments recorded at FVTPL) increased to $1,469.6 in 2022 from $1,352.0 in 2021 primarily reflecting increased net premium collections, partially offset by increased net claims paid at Crum & Forster and increased net taxes paid at Northbridge." 2. This seems related to a historical decision to purchase for treasury in order (not to cancel them) to use the shares so purchased for share-based compensation.
-
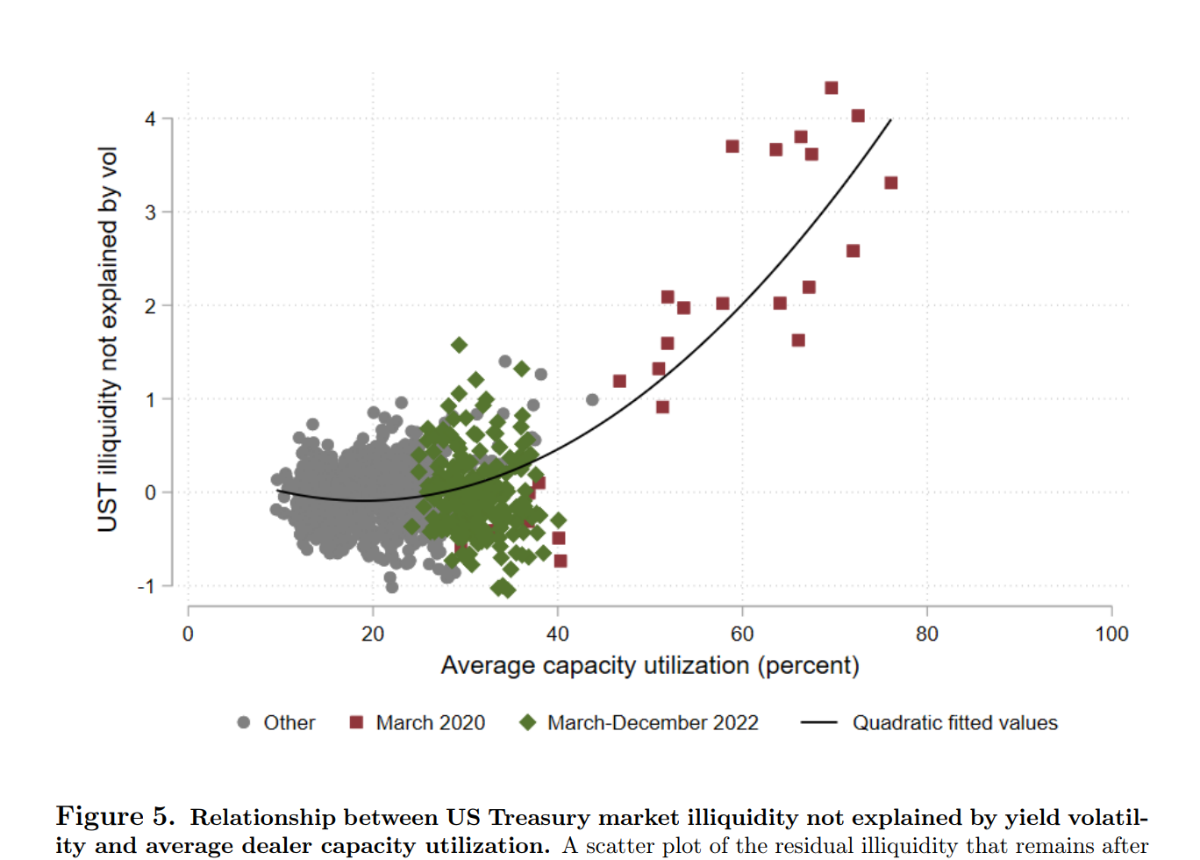
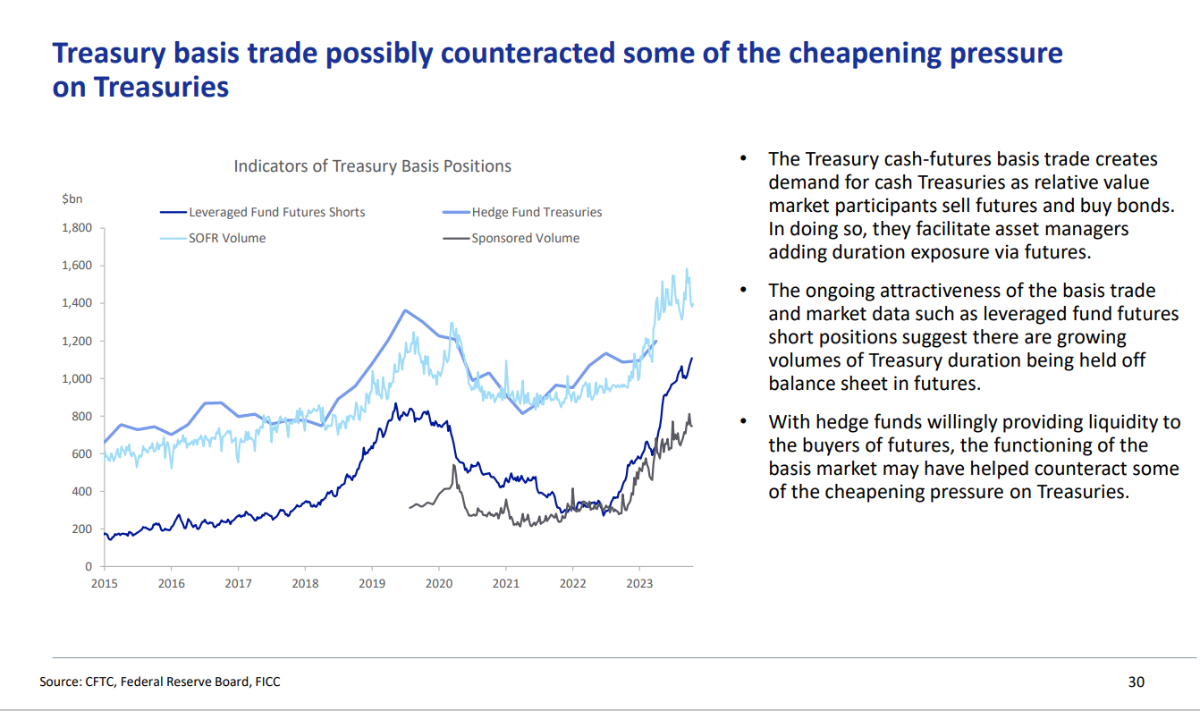
^Here's a humble take from a noob. Short version: Treasury yields have recently risen as a result of fundamental supply-demand factors and only a small part of this increase is from the technical issues mentioned in the WSJ article. ----- During the 1907 liquidity crisis, people wondered if the size of the money (and moral authority) of JP Morgan et al was enough and if there were more efficient (and more widely mutualized) ways to deal with such liquidity crisis. Then the Federal Reserve was created. Now, the size of the potential commitments seems to be endless but there are developing technical issues that are liquidity related. The size of the US Treasury market is HUGE and it seems like the intermediation process through primary dealers is no longer adequate for liquidity purposes. ----- As the supply of Treasury debt has soared in an inverted environment, primary dealers' balance sheet constraints have resulted in large and growing arbitrage opportunities which private market participants (hedge funds) have tried to exploit using very high leverage. When volatility hits, because of the value-at-risk framework, hedge funds tend to unwind their positions and, reflexively (and in counter-intuitive way?), this actually tends to increase volatility. This issue continues to be relevant and there is a macro-prudential discomfort for systemic risk. If and when volatility hits, the Fed has an almost limited set of "tools" to deal with this temporary noise but it's still an interesting issue (for private market participants). The following 2 graphs are from a recent publication, data stops end 2022. The following graph is from a report just released by government officials who can produce unusually euphemistic titles with more recent data, showing the same growing pains in primary dealers' balance sheet constraints. The 'easy' way out, as mentioned in the WSJ article, would be to re-establish some kind of relaxation on the SLR rule in order to allow commercial banks (and consolidated primary dealers) to expand their balance sheet and absorb Treasuries but there are problems: 1-This would mean continuing to allow private banks' balance sheet expansion ahead of underlying economic activity (just postponing the correction of imbalances) 2-This would mean to continue to allow banks to earn a significant (and growing) part of their return on assets from holding securities and not from making profitable loans to private market participants (the fundamental purpose of banks). Japan's banks have been on this trajectory for more than 20 years now and... 3-This would mean to re-ignite the fundamental factor behind the inflation with a lag that happened after Covid heroic monetary-fiscal measures What's the point? "I feel like he's trying to say something else that isn't such a mainstream take on it. He makes the very rare (for journalists anyway) admission that "Yet the end-buyers of the debt are unlikely to disappear since government deficits automatically create the very savings that are then channeled into financial assets." As a noob, i would submit that the above quoted statement only applies in selected circumstances, especially the automatic part.
-
Yes. And whatever temporarily depress valuations or cause the sector to be in temporary disfavor may represent an opportunity to grow in these capital intensive businesses. Added link for reference, if needed: https://www.law.georgetown.edu/environmental-law-review/blog/utility-liability-and-grid-modernization-a-path-to-reducing-wildfire-risk-and-protecting-consumers/
-
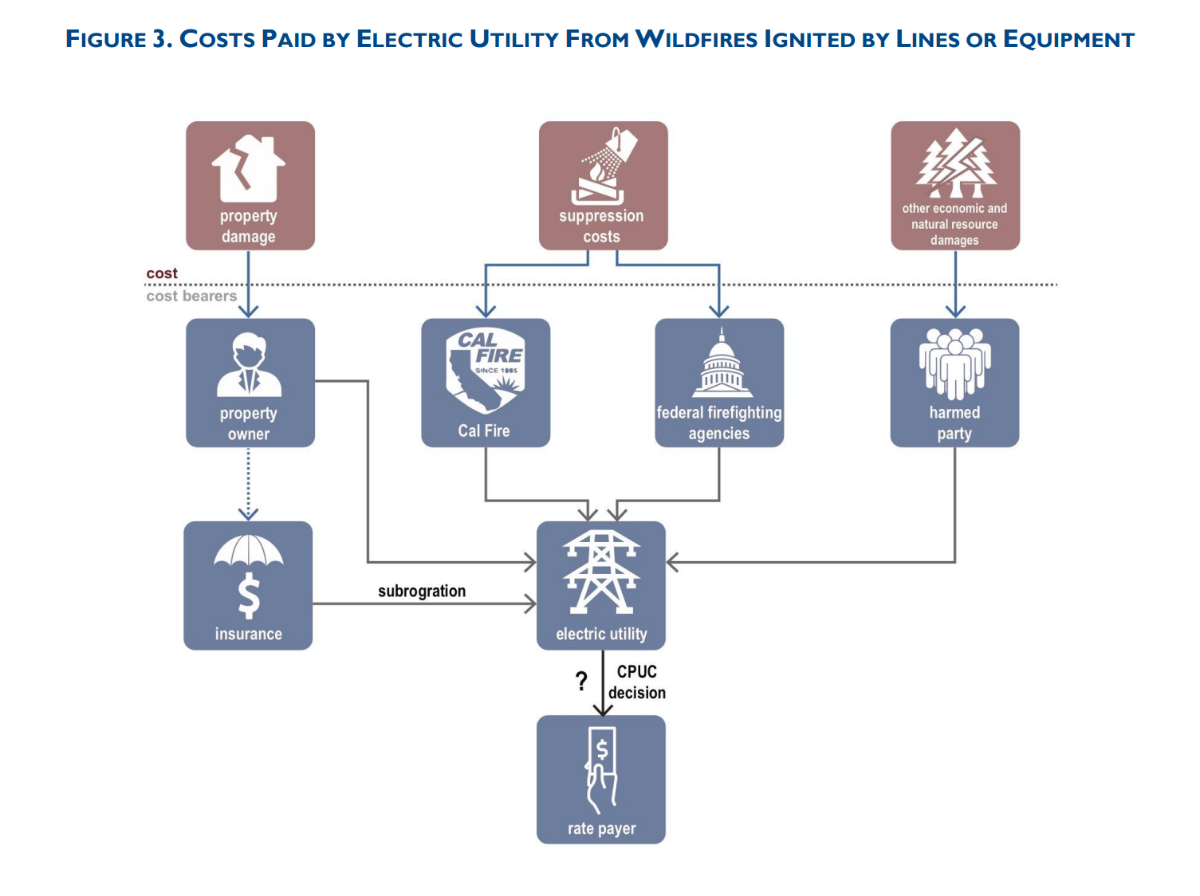
Ok, a follow-up here in order to: -promote some kind of uneducated wishful thinking? -see this noise as a potential building comparative advantage? At the very least, it's likely reasonable to look at both sides of the story? ----- The following is based also on a relatively involved assessment of what happened to PG&E. Short version, fire costs (and poor management) tipped PG&E into bankruptcy (phoenix entity coming out with residual pre-BK equity value), costs were mostly borne by PG&E owners (at least it seemed at the time) but now (over time) appear to be effectively passed to the end of the line ie customers. PG&E is based in California and there was an added consideration for inverse condemnation but even in that legal climate, the point is that costs will eventually be paid by customers and utilities will eventually earn their 'fair' return on capital. ----- i did not follow the PacifiCorp legal travails as closely but, during procedures, potential liability of 7B and even 11B was mentioned although eventually, if history is any guide, the final liability will likely be much lower. In this specific case (during appeals, we'll see), a jury found PacifiCorp guilty of recklessness/negligence. A common aspect of this verdict with a recent Colorado case, which came to a similar conclusion (and with the recent Maui fires it seems) was the failure of PacifiCorp to proceed with temporary shut downs of electricity distribution in key areas. How to deal with wildfire costs for utilities is work in progress and regulators are slowly taking notice (what works, what does not work). One of the developing ways to prevent wildfire costs is to optimize the use of temporary shut downs. In other words, 'we' will eventually get better at it and utilities should (eventually) be treated proportionally. ----- In August of 2020, on this Board (what are you selling pages), there was a participant who suggested the possibility to short Eversource Energy (poor management?, poor handling of an unexpected natural event etc) and i had suggested that this may not have been a good idea, at the time. Share price went from 90 to 80 and went back up rapidly. However, with interest rates rising, wildfire costs and others, share price is down 30%, imo getting to levels where BRK could pull the trigger (versus general price levels for utilities). ----- The point being that the issue of wildfire costs is significant but temporary and may offer an opportunity for BRK utilities to become leaders in developing working models with regulators. There are many ways to discount this but, in a reasonably working free market economy, the customer should eventually bear the price of those costs. Apologies for the long post but people often wonder about the impact of size on BRK for future growth and profitability etc. Expansion into utilities is potentially massive and offers long periods of adequate return on capital. But there will be noise and one has to assume that the US will continue to work reasonably well when dealing with such issues (public good vs private interests).
-
^Ok ok, you guys (@gfp and @JohnHjorth) are technically correct. But my humble (and naive?) interpretation then is that the aimed objective (for BRK) is to pay less for the remaining minority interest ie to effectively transfer less value from the acquiree to the acquired. The issue (conceptual) is that, if the above (as described) is technically correct, BRK then is trying to oppress minority shareholders. Somehow, this elicits some kind of gut reaction looking for a rational explanation and, on some occasions, economic substance is more important than the accounting language? At the very least, a key piece is missing (opinion), if previously held fundamental assumptions about the BRK culture continue to apply.
-
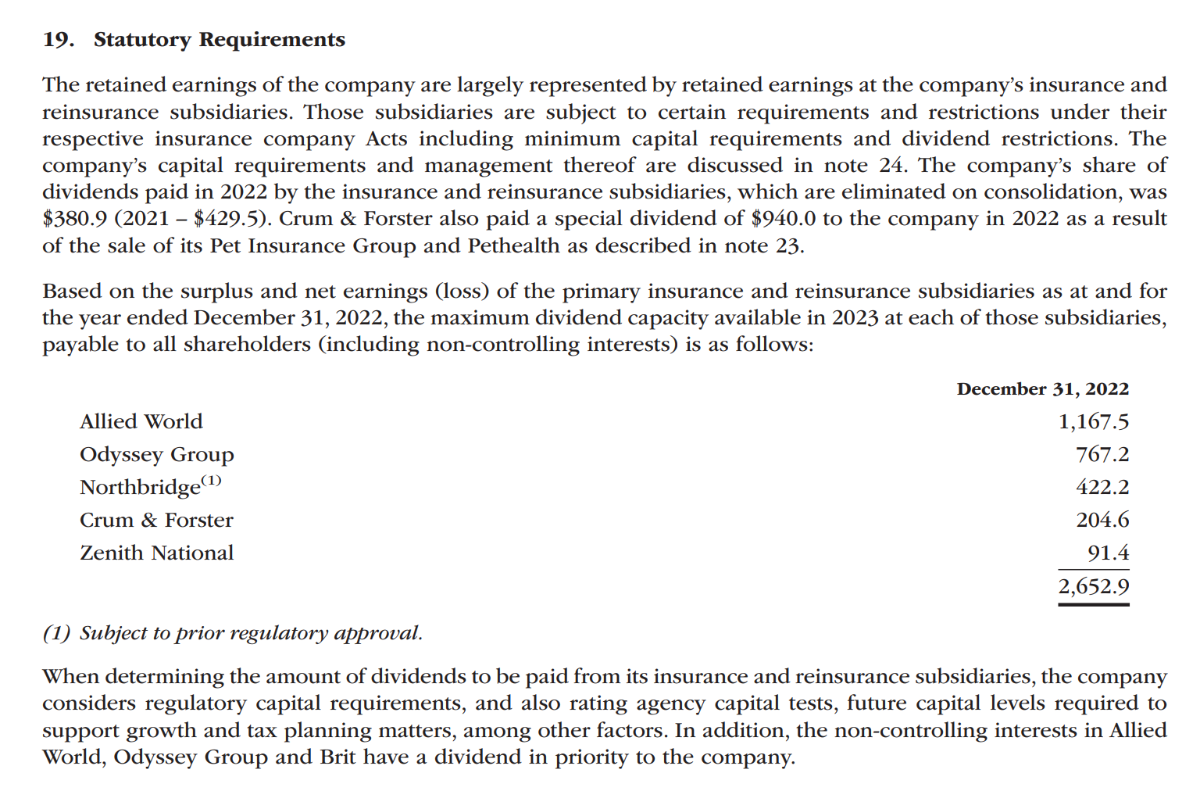
For an idea of the surplus position at end of 2022 (page 93 annual report):
-
Clearly. This open confrontation is unusual. From a recent CPAJ piece: "If an acquiree does not adopt pushdown accounting in a change-in-control event, it can elect to apply it in a subsequent period, subject to the requirements for a change in accounting principle. An entity may make a change in accounting principle only if it justifies that the alternative accounting principle is preferable. GAAP requires that companies apply the change in accounting principle retrospectively to the change-in-control event date (ASC 250-10-45-2)." It looks like BRK 'found' evidence that some kind of material impairment was present AND had been present at least since the time of change of control. It looks like this goes further than simply an intent to question an 'accounting' principle.
-
Need some help here. A few years ago, after reading this: https://www.bankofengland.co.uk/-/media/boe/files/speech/2018/the-future-of-money-speech-by-mark-carney i had looked into proof of work moving to proof of stake or else (referred to in page 9 of the link). The link has common (with Mr. Munger) references to Adam Smith. Any progress there in throughput?
-
Despite the above map and other 'sources', you are correct (i was wrong) and the percentage is closer to 80-85%. Thanks for the guidance. Because of your post, i spent a few seconds on this topic (inter-provincial migration) and the net positive migration to higher latitude (and slightly colder) regions of Alberta is for real and growing. Interesting. Estimates of interprovincial migrants by province or territory of origin and destination, annual (statcan.gc.ca) Real estate prices are clearly a factor. One also has to consider the relative commodity boom that is happening but there may be more (along the lines of what's going on in the US with NY/CA to FL/TX positive migration). ----) Back to what SharperDingaan is trying to do with this thread..
-
A not widely recognized but verifiable fact is that 90% of Canadians live within 160 kilometers of the US border. Number 3 reason for this fact is the attraction to Americans for what they represent, number 2 reason is economic ties but...number 1 reason is... simply climatic (not climactic). For literacy purposes, 1.6 km = 1 mile ----- i'm involved in the process of helping young adults in my tribe to get the government tools available to them (tax-deferred accounts for first house, for 'saving' and for 'retirement') to do the work for them and the result on their effective tax rate is really significant. And it's not that complicated. ----- You mention a coming period for the next 5 years where there is a risk of being 'burned'. From my unusual perspective, things are slowly shaping up for some kind of blossom, what am i missing?