Cigarbutt
-
Posts
3,473 -
Joined
-
Last visited
-
Days Won
1
Content Type
Profiles
Forums
Events
Everything posted by Cigarbutt
-
Positive development: April 8 (Reuters) - An Oregon appeals court on Wednesday ruled in favor of PacifiCorp in litigation over a series of Oregon wildfires in 2020, saying a trial judge erred in letting the case against the Berkshire Hathaway-owned utility proceed as a class action. The decision by the Oregon Court of Appeals in Salem could reduce PacifiCorp’s overall liability, which the utility has estimated could total tens of billions of dollars. PacifiCorp has denied claims by thousands of Oregon residents and business owners who accused it of causing several wildfires by negligently failing to shut off power lines during a Labor Day weekend windstorm in 2020. The appeals court said a trial judge overseeing the litigation erred in instructing jurors they could "assume that the evidence at the trial applies to all class members," and that the error was prejudicial to PacifiCorp. Lawyers for fire victims did not immediately respond to requests for comment. PacifiCorp did not immediately respond to similar requests.
-
https://fortune.com/2025/12/04/rich-people-flooding-dollar-stores-us-affordability-crisis/
-
Ok you don't like that source of info... Here's another, the findings are not that controversial, it just is what it is... https://snfagora.jhu.edu/wp-content/uploads/2025/11/Understanding-Evolving-Republican-Attitudes-Towards-Democracy.pdf The link is interesting as it subdivides republicans into Trump-first, Party-first and Constitution first. Disclosure: when the place where i live becomes the 51st state, i will be a Constitution-first type, you? (rhetorical question) It's the relative rise of the faction that treats people with different viewpoints as filth/vermin that i tend to worry about.

-
This is about a previous discussion concerning housing affordability. The question was: To what extent is housing "unaffordable" these days, relevant for a typical new first-time buyer in a typical large city in North America, UK etc. There is a study that just came out from my jurisdiction (in or around Montreal) comparing key issues including downpayment (deposit), comparing 2015 to 2025. This is relevant from my point of view since we bought at a low point in the cycle (1996) and our oldest child has recently bought, another is buying and another is about to. Key findings: In the last ten years: -prices have more than doubled -monthly mortgage payments have been multiplied by 2-3 -Downpayments have been multiplied by 2.7 -during a time when after-tax revenues have increased by about 20% So the ratio of mortgage payments to after-tax revenue has increased from 26% to 48%. -----) Another way to look at this housing affordability issue is the fact that the time necessary to accumulate the minimal downpayment has increased from 5.4 years to 11.6 years. Ok not the end of the world but time is money and the additional 6 years is worth something?, especially since i highly doubt that present-day first time buyers will have the returns 'enjoyed' in the last few years. Time will tell, i guess.
-
Some use the words slipping, sliding etc but whatever it is, it's not exactly bipartisan: Isn't this a movie that 'we' have seen before?
-
You are not the only person.
-
Thank you KJP, that was interesting. The second case is typical legal work used to resolve conflicting 'powers' at the margin. The first case is both interesting and relevant (versus power to order tariffs for example) as judges leaned towards limiting the power of the POTUS despite an actual war going on. Isn't it incredible that there is still a material possibility that the actual Supreme Court defers to a single person for a situation which should be crystal clear to start with (in terms of constitutionnaly-derived separation of powers)? For the "difficult" question related to the apathy of the good people, i would say here's the beginning of an answer: A Reagan-appointed judge who decides to speak out in (a left-leaning but high validity) publication: https://archive.ph/pVeOJ To @adesigar, i just saw your post, mine then becomes somewhat repetitive. Some stuff is worth repeating though?
-
https://www.sec.gov/comments/s7-31-08/s73108-39.pdf
-
Tightness and strain in liquidity is multi-factorial, tends to show up at end of quarters and as @wabuffo alluded earlier what's happened in the TGA account has contributed to this dynamic: Contrary to Q2-Q3 2023 which saw a similar increase in the TGA though is the fact that during Q2-Q3 of 2023, both the Fed (did not really start tightening then) and what happened in the reverse repo window (decreasing levels, so a net supply of reserves to the system) helped to mitigate what happened to reserves in the system despite a growing TGA. Recently both the Fed (tightening mode, removing reserves from the system) and the reverse repo window (almost empty) have not mitigated the effect on reserves in the system caused by a growing TGA. Whatever the reason(s), there seems to be a growing pattern of reduced liquidity which may be a "simple" plumbing issue but there may more to it? Reserves to GDP can be interesting but a more relevant measure may be reserves to the pool of issued and circulating Treasuries: Somehow, despite banks holding huge levels of reserves and Treasuries, this does not seem sufficient to help primary dealers to deal with a persitently large supply of Treasuries. It's always possible that banks are seeing undrawn facilities moving from off-balance sheet to on-balance sheet as a result of strain unrelated to plumbing but that remains to be validated. Anyways, the Fed forecasts that easing and a change of composition is in the air: Moving from ample to ampler to amplest?
-
Ok yes, at the commercial banks' level, about the reinvestment or redeployment opportunities, a lot of the "investable" funds have been channeled into dividends and buybacks (especially buybacks since GFC) and a devil's advocate may suggest that a significant part of these funds were derived from the NIM on IOER subsidy but let's not invoke devil's advocacy here and now. But this redeployment has resulted in less funds available for other aspects such as typical loans for the underlying productive and non-financialized economy. Is there such great underlying demand for typical loans then? Anyways, from another era of buybacks, banks have not been exactly great at market timing but a recent report, inspired by regulatory work supported by the Federal Reserve, called this payout flexibility in action. It kind of misses the potentially attractive and opportunistic aspect of buybacks (buy low?) but even the GOAT was buying banks in 2007. About the redeployment at the largest six banks who nonetheless prefer to buy back their own shares, one could argue that they could redeploy their reserves into Treasuries but they've done that, recently and in spades, but this process has met structural and more acute 'transitory' inflationary constraints... An explanation for the evidence suggesting tepid demand for productive private loans would be some kind of crowding out idea (heresy?) so there's got to be other explanations?
-
There is a love-hate relationship between banks and regulators and, given overall tendencies, there may be a certain polarization between the amazing advantages regulators provide (such as reserves-not-really interest income) and the disadvantages of a growingly more liquidity-dependent and complex plumbing system. The annual report you mention is for the 2020 year. Since then, as far as i'm aware, Mr. Dimon has not really mentioned the following (for banks as a whole or for his own JPM): i'm not relevant in this whole story but some say that a billion here and a billion there and then soon you may be talkin' real money. ----- i'm unable to conceive deep insights so let's try an analogy. Given your interest in NovoNordisk, let's go diabetic. In certain cases (ICU-type), it's possible to use an insulin drip to lower blood sugar while, at the same time, have a IV line for glucose infusion to elevate blood sugar. This way, you (think) can control the sugar blood levels. But this is quite time-consuming and necessitates close monitoring and it can get messy at times, giving the impression of the need for even more control (regulation). However, also, the obvious consequence is that the human adaptive mechanism (self-regulatory forces) does not get to effectively kick in as it is overidden by larger regulatory outside constraints. It's ironic that recent talks and studies come up with a 65% rule of required excess reserves to clear Fedwire transactions as only a minuscule amount of excess reserves were necessary to clear transactions before the GFC? Is this called evolution, adaptation or habituation?
-
Question 1- -Capitol Riot pardon on top of the cancellation of all other related trials -DOGE creation, a non-governmental 'agency' with huge potential implications -Personal control of the Justice Department (Attorney General with unlimited and non-conditional loyalty, key role to provide judicial validity to decrees, nominations, firings etc) and federal police -Designation of immigrants as foreign invaders -Tariffs -Coordinated cultural war (Kennedy Center, Smithsonian Institute, universities etc etc) -Use of national guards All these premeditated moves based on existing laws but in the context of distortions (laws mentioned do exist but are taken out of context, invasion, rebellion, economic emergency) with increasing laxism in superior courts and even the Supreme Court. Unprecedented powers are given to one person as if there was, in fact, a rebellion, an invasion or an economic emergency... Question 2- Thanks again for the helpful feedback. On my side, in the context of constructive discussions (with family and acquaintances, quite typical and ordinary people), many, especially in younger cohorts tend to be alarmed by such developments (democratic backsliding) and i then tend to act as a moderating voice, but it looks like i'm running out of moderating arguments in what is considered a very slippery slope (i recently read the German drift to Revolution, written in 1933, and...it rhymes...). You don't think your army could be used to influence the next election cycle? I admire the US and continue to marvel at its Constitution. The founders were obssessed to avoid the concentration of power into the hands of one person. Washington, when he retired (under no obligation to do so, to the contrary) described the necessity to promote virtue in the common man. What did he mean by virtue? Who decides if there is a rebellion, an invasion or an economic emergency? The angry mob? It has been said that Jefferson had a particular attachment to two books: Montesquieu's treaty about the separation of power and Gibbon's history of Roman decline.
-
Keeping in mind the recent interest in those discussions related to recent liquidity issues in the 'system', the SLR ratio indeed is acting as a constraint against lending and even against more commercial banks' balance sheet acquisition of Treasury securities! One of the obvious 'solutions' (opinion) to the recent liquidity strains would be to simply relax or suspend the application of the SLR. However, (opinion, based on conventional money ideas), the last time they (regulators) did this (early 2020s), there was a bout of 'temporary' mainstreet inflation and there may be more to this than simple chronological correlation? ----- Real L+L growth has been very weak for a while: Do you think banks such as JPM have been constrained for private lending due to the SLR ratio limitations? Or is there something else ?
-
Isn't this just semantics though? Bank profit = change in assets-change in liabilities When banks are paid with reserves, isn't this a profit? When the Fed reverses the operation, won't the banks be able to sell this asset (returned Treasury) for another asset (marketable). And the extra reserves, can't banks sell or loan those reserves to other banks for a profit? ----- Isn't it interesting that the Fed has stopped remittances to the Treasury since 2022 because of deeply negative equity but has continued to pay IOER at relatively high rates (this did not matter as much when rates were ultra low)? So you have the Fed paying (with reserves i realize but still) relatively high rates (clearly higher than what banks pay on associated created deposits) to a very high % of bank assets. Considering historically ROAs of banks, this income stream continues to be a very significant risk-free contributor to their net interest margin and profitability.
-
The point is that, as an individual, the operation looks like an asset swap, but overall, there is a new deposit (money) in the system and this holder of this new money can buy something else with that new money.
-
There seems to be clear evidence that private sector balance sheet expansion occurs wtih QE. 1-See the balance sheet picture previously shared above, when the Fed buys Treasury securities from non-bank participants 2-Whe the Fed buys the Treasury security from a non-bank party (eg hedge fund), the transaction goes through a primary dealer (just a conduit) and there is an effect between balance sheets of the involved commercial bank (reserves) and the central bank (Treasury security) but there is ALSO an expansion of the balance sheets between the involved bank and the involved non-bank party. The hedge fund, for example, which sold the Treasury security ends up with money that can be spent. In a very likely way, the hedge fund is likely to buy ANOTHER Treasury security with the money but this is NEW money. This NEW money will only disappear when the Fed reverses easing in the other direction. 3-To provide further support, look at what happened quantitatively to deposits over time. Given one of the Wabuffo's iron laws of macroeconomics, deposits do not create loans, loans create deposits (new money formation principle). In essence new money comes from loan origination at commercial banks. However, and this is becoming more relevant, banks also create money when they buy securities in the open markets (just play around with balance sheets and this works out). Interestingly, when the Fed buys a Treasury from a non-bank party, the end result (balance sheet wise) is the same as if the commercial bank buys the security itself; it's just that the commercial bank ends up with excess reserves as an asset instead of the Tresury security itself. Look at the following for fun (using deposits as a proxy for money growth): For the longest time, loans and leases were the basis for money (deposits) creation. What has happened since 2007-8 (the QE era)? Clues: Commercial banks' deposits were created from the Fed buying Treasury securities from non-banks and from themselves, directly, buying securities (mostly Treasuries and MBS). If you add those up (L+L, QE, banks buying securities), you end up with, essentially, a good approximation of the overall deposit (money) growth over time and the underlying components driving that growth. -Numbers for securities in commercial banks have been adjusted for a baseline around 2007-8) -I know this is not perfect (ie banks funding with its own equity, its own debt, others etc) but the main ingredients of new money creation are there and private balnace sheet expansion, there has been, with the coordination of central and commercial banks' involvement in markets
-
Thank you again for the data points and the perspective. Somehow, i think you have a legal background (lawyer?) and wondered if the unprecedented executive overreach, Congress irrelevance and undermining of the rule of law was something worthy of concern. Oh and BTW, the apathy i was refering too was not about the noise, it was about the apathy (inspired by MLK) of the good people and the lack (apparent?) of noise at that level.
-
The following is just for fun (financial plumbing can be interesting!? and relevant???). There is no ominous undertone or, hopefully, any conspiracy-driven intent. i'm just someone preparing for Halloween whose main activity these days is to play pickleball so (obvious disclosure) i'm no 'expert'. ----- An interesting aspect has been that QE happened mostly (about 90-95%?) not simply and directly through banks but through private market participants who happened to hold available Treasury securities. This aspect resulted not only in balance sheet adjustments between commercial banks and the Federal Reserve but also between banks and private participants. With the Federal Reserve buying the security, a bank balance sheet expansion occurs, cash is created as an asset and a (uninsured) demandable deposit is created. As an aside, recently, with some banks trying to match these newly created liabilities with longer term Treasuries, the unrealizable part of the mismatch was a cause for concern/trouble. See the following: Because of the above, two things happened during easing: 1-Banks ended up with a new profit center: interest paid on reserves more than interest paid on deposits 2-Private market participants looking for securities earning more than interest on deposits i wonder if banks, somehow, are resisting the reversal (tightening) of this profit opportunity. In many fields, it's easier to adapt to easing than to tightening. Some even suggest some kind of dependence. Anyways, for the longest time this ample reserves regime didn't seem to be necessary but there does not seem (at least clealy and so far) any significant cost to this growing need for centrally driven liquidity but who really knows? If dependence is a component, sometimes it takes a while for true and authentic recognition. (just a simple reflection here, i remember Mr. Buffett and Mr. Munger stating it was weird that two parties could both recognize an accounting gain while sharing a derivative transaction)
-
Fair enough, thanks again for the thoughtful feedback. Maybe it's just my unusual focus on downside protection and margin of safety. As a simpleton unable to think through first principles, during free times, i will continue to look for analogies in history (Civil War, Germany early 30s); but it's not the naivete that may be different this time, it's the apathy?
-
Thank you. That was very helpful (thought provoking, helping to focus where i'm wrong etc). What to do then if one is a leaning right fiscal conservative with moderate and flexible views on social aspects observing, with interest, the critical creative/destructive transition going on in the leading world power led by agents promoting polarization and appealing to the worse evils of our nature? Is this a downward spiral or the movement of a pendulum or else? Wasn't Abraham Lincoln a reasonable model here? Wasn't he able to navigate a difficult period bridging ideals with the general public (with sometimes very obvious incoherences and even contradictions)? Disclosure: A large part of my investable assets are denominated in a "foreign" currency, the great USD, and i'm getting to think that this obvious choice is becoming less and less obvious.
-
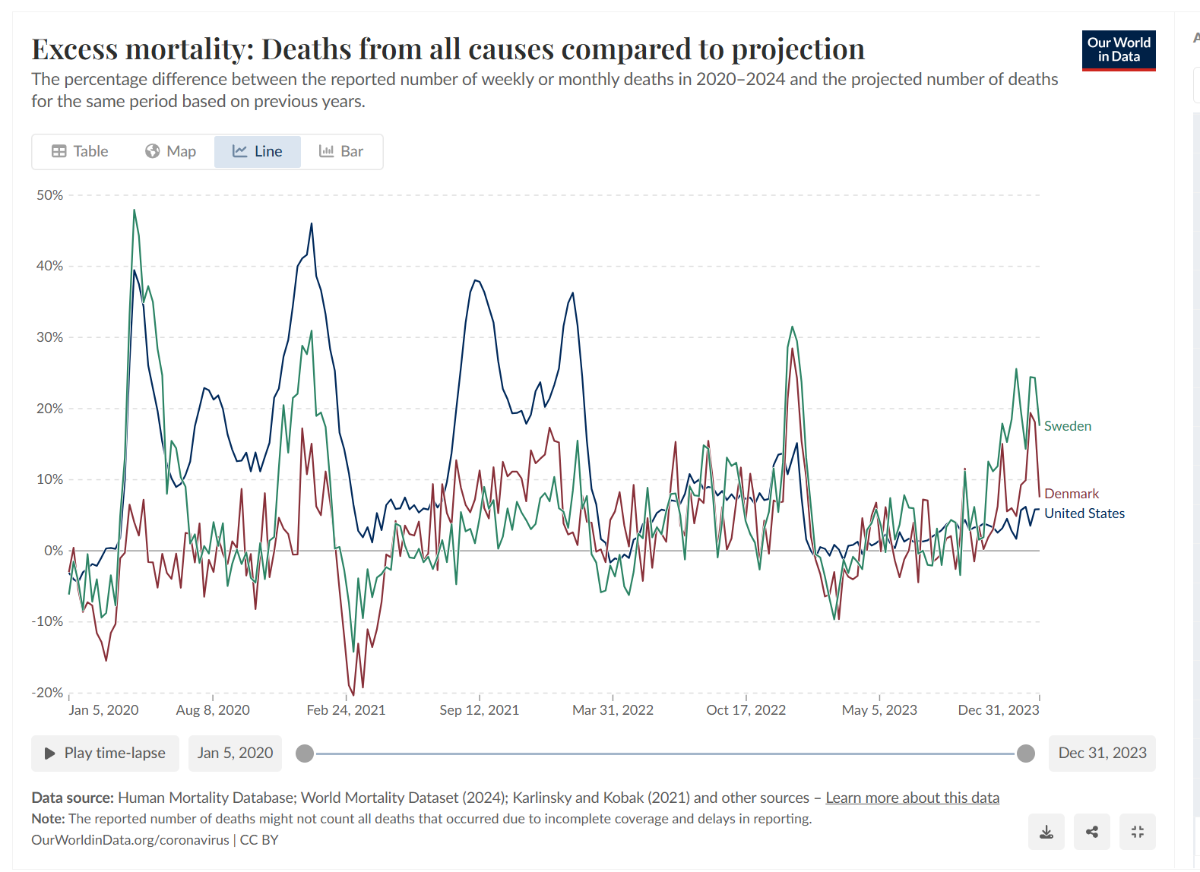
Opinion: it's not fundamentally a "sorry i hurt your feelings" or a level of "education" question, it's how to argue based on underlying facts and reason. Rhetorics and all can be sort of fun but there has to be some kind of mutual agreement about basic facts, about rules of engagement. The underlying question was: can 'restrictions' have a positive effect on a communicable disease? And, because of tribal limitations, it seems impossible to start from solid grounds before gyrating into the abyss of poor arguments and magical thinking. ----- Compare the US, Sweden and Denmark (the 51st state compares to Denmark BTW). The areas under the excess curves are significant because they are large and because they are a tip-of-the-iceberg proxy for disease burden. Sweden chose a relatively less restrictive path but paid a human price. Opinion: they openly discussed initially the risks and acknowledged the consequences after (the severity of which 'they' the experts did not fully expect). Said kindly, the US ("you") did much more poorly from a disease burden point of view. I know many differences here including a sicker and heavier population but a significant part of the poor performance was the very unusual inability to cooperate through constructive discussions, as seen in the recent exchanges here. ----- What should be even more of concern (opinion) is that, despite the very poor disease burden performance, the US, by far exceptional here among 'rich' countries, paid a very large debt-funded cost for this result. During the COVID-19 pandemic, the United States saw a significantly higher increase in expenditures relative to its GDP compared to Denmark and Sweden, mainly due to a large discretionary stimulus. The Scandinavian countries relied more on existing welfare systems and targeted measures, resulting in a much lower percentage increase. Comparative expenditures during COVID-19 Country Estimated COVID-19 Fiscal Spending (% of GDP) Nature of Response Key Statistics and Findings United States Over 19% Early stimulus estimated at 11.5% Massive discretionary stimulus. The US passed multiple large relief packages, including transfers to individuals and businesses (such as the Paycheck Protection Program), direct government purchases, and tax provisions. Highest increase among these nations. The US experienced one of the highest increases in public social spending among OECD countries, with an increase of 6 percentage points from 2019 to 2020.Large demand impulse. In 2021, the US demand impulse from fiscal policy was almost four times larger than in the Euro area.Higher deficit. The discretionary spending alone added over 11% to the 2019 GDP. Denmark 4.5% in 2020 Targeted support using existing systems. Denmark used its large fiscal space to provide rapid and targeted support to firms and households, cushioning the economic shock. Measures included a wage support scheme to prevent layoffs and large-scale, though not fully used, emergency packages. Contained economic contraction. Denmark's rapid action led to one of the mildest economic contractions in Europe.Lowest increase among these nations. From 2019 to 2020, Denmark saw an increase of less than 1 percentage point in its public social spending-to-GDP ratio, the lowest of the three nations compared. Sweden ~4% in 2020 ~4.5% in 2021 Moderate, less restrictive approach. Sweden opted for a less restrictive public health approach and initially relied on voluntary behavior changes. Its government offered substantial liquidity support and loan guarantees for businesses, but its fiscal spending was more moderate compared to the US. Small increase. Like Denmark, Sweden's public social spending-to-GDP ratio increased by less than 1 percentage point from 2019 to 2020.Limited spending, large liquidity support. Sweden's direct spending was limited, but it provided significant liquidity support to businesses. While this support temporarily boosted public finances, the overall effect on GDP was lower than in the US.
-
Other similar "pictures": even a more 'sensational' one: On a more serious note, the job picture has been changing (diverging, bifurcating, call it what you want). i've been following targets in the temp staff space (private and publicly traded) and they are struggling. Really strange in a so-called humming economy. Is the job market still a lagging indicator? ---- Is this a part of you in the corner?
-
Thank you @flesh for this answer. i would tend to agree with you here on many levels. At least, we seem to agree (to build the discussion) with a pretty well established assumption that 'restrictions' can improve the outcome of communicable diseases. It's interesting though that this spectacular improvement along civilized human progress has started to reverse. Why?
-
What's relevant to the exchange with @Milu here (ie the reason for this specific post)? The above post of yours is a typical conversation strategy that not only does not contribute to constructive discussions (any type, political, investment etc) but also undermines the process. Textbooks call this an hyperbole argument but i (typical citizen with limited IQ etc) call it the drama-queen argument style. 'Experts' note that this hyperbole strategy can be 'entertaining' and can help with tribal thinking but does not help to build constructive discussions because of the deception, distraction and insulting components involved and i would say that 'experts' are not always wrong. ----- As an ordinary citizen, the easy thing is to simply move one but textbooks mention the importance of attempts to constructively reframe the discussion and to ask open questions? 1-Why do you @Gregmal et tribal al, get all worked up for such a simple question: Can 'restrictions' prevent the spread of communicable disease and decrease disease burden? Can you (or tribal others) answer this question in a binary (yes or no) way at least? 2-Isn't there a way to introduce at least some nuance for such potentially complex and contentious issues?
-
Not so fast... i agree and it seems impossible to engage in a constructive (bi-directional) discussion here but... The underlying point that you 'suggested' was that "restrictions" had no significant effect (mortality) on a communicable disease... ... ----- During Covid days (or any day when tribal emotions or beliefs are involved), it was/is indeed difficult to engage. Concerning "restrictions" (all aspects, some voluntary and spontaneous and some 'mandated'), there seemed to be a tendency to adhere to a tribal position on some aspects. For restrictions, most people agreed that there were costs (economical, social etc) but a certain tribal-based thinking process excluded the possibility that "restrictions" could decrease the morbidity/mortality burden of a communicable disease... The same tribe that 'suggested' that Covid was a "hoax"...i think this was/is bizarre from an independent and critical point of view. It's sort of common sense supported by most evidence and adequate critical analysis... For Sweden, compared to relevant Scandinavian neighbors, when engaging with people dealing daily with covid casualties to data to analysis, one came with the clear picture that Sweden did indeed have a less restrictive approach but this approach, in the first few months, before getting closer to herd immunity with vaccines helping ++, did result in much higher morbidity and mortality. It was a 'cost' (human) to pay for a less restrictive approach. But Swedish 'experts' and those in public health positions did not suggest that restrictions had no effect on a communicable disease...? ----- Anyways, i sense that you will be impermeable to such conversation and, when reading and thinking about your initial post on the matter (restrictions versus impact on a communicable disease...), i remembered the case of Simmelweiss when he tried to convince (with common sense, data and 'arguments') colleagues (in the 1840s) that washing hands could have an impact on communicable diseases. When colleagues with whom he tried to engage remained impermeable, he became miserable, a path better not chosen.