


Viking
-
Posts
4,641 -
Joined
-
Last visited
-
Days Won
35
Content Type
Profiles
Forums
Events
Posts posted by Viking
-
-
1 hour ago, wisowis said:
Thanks for the post, Viking. Question: Why will earnings from this bucket more than triple?
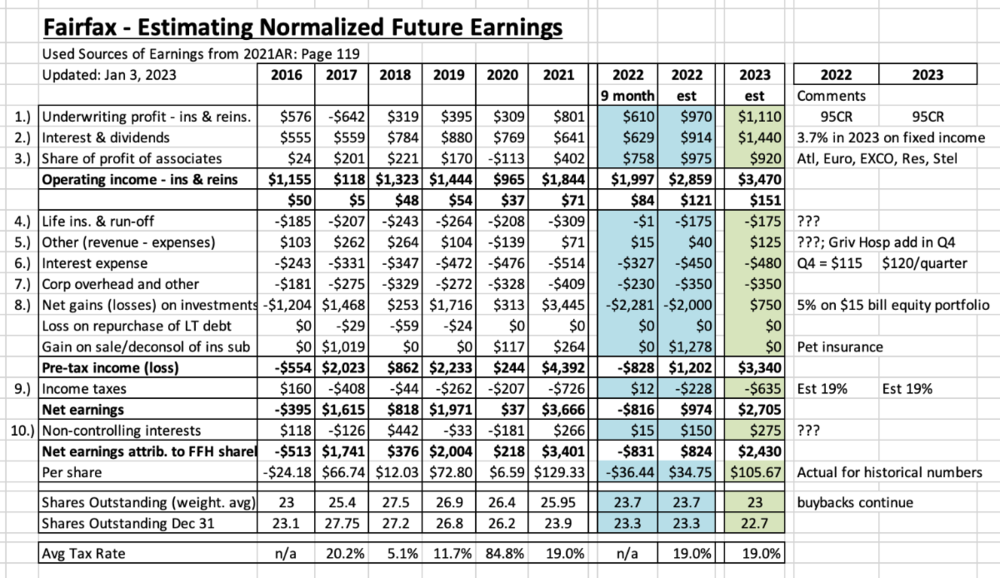
@wisowis good question. The "Other (revenue - expenses)" bucket has had significant noise the past couple of years. In 2023 Consolidated investments produced pre-tax income of $271 million but the 'reported' number was $46 million. Losses from Grivalia, Boat Rocker and Farmers Edge were $204 million in 2023. There was a significant write down on Farmers Edge of $133.4 million in 2022. I don't think these one-time losses will continue at this level moving forward.
Consolidated investments produced revenue of $6.6 billion in 2023, up from $5.6 billion in 2022. This bucket of holdings is growing like a weed.
There is likely a little more pain coming from Farmers Edge but once Fairfax takes it private my guess is they will do something to (finally) stop the losses/bleeding. Boat Rocker has a carrying value of $84 million and a market value of $24 million so we could see another modest write down here. The past couple of years, Grivalia Hospitality has been spending heavily to build ultra-luxury resorts with minimal money coming in; I think this may have changed late in 2023 as they now have 5 resorts (I think) open for business = revenue.
Thomas Cook India is smoking. Recipe, Sporting Life, AGT Food Ingredients and Dextera all look to be chugging along.
Once the significant bleeding stops I think people will be pleasantly surprised by the earnings that this bucket will be able to deliver in the coming years.
Regardless of reported earnings in recent years, I think significant value is building in the holdings in this bucket. At some point in will show up in reported earnings. And it will likely 'surprise' people like what happened a couple of years ago with the spike in earnings from the 'share of profits of associates' bucket.
Therefore, I think my estimate of $150 million in 2024 and $200 million in 2025 is quite conservative.
----------
FFH 2023AR: "As the table on page 15 shows, the consolidated investments include the following: Recipe, Fairfax India, Grivalia Hospitality, Thomas Cook India, Dexterra Group and Boat Rocker Media. Our consolidated investments are significant, producing total revenue of $6.6 billion and pre-tax income of $271 million in 2023. Fairfax India had pre-tax income of $380 million, Recipe $38 million, Thomas Cook $27 million and Dexterra $29 million. Those were offset by losses at Grivalia of $66 million, Boat Rocker $26 million and Farmers Edge of $112 million which included impairments of $64 million."
FFH 2022AR: "As the table on page 13 shows, consolidated investments include the following: Recipe, Fairfax India, Grivalia Hospitality, Thomas Cook India, Boat Rocker Media, Dexterra Group and Farmers Edge. Our consolidated investments are significant, producing total revenue of $5.6 billion, EBITDA of $743 million and pre-tax income of $303 million (excluding a $133 million writedown of Farmers Edge) before minority interest in 2022."
FFH 2022AR: "Operating income of the Non-insurance companies reporting segment increased to $184.9 in 2022 from $78.2 in 2021. Excluding the impact of the non-cash goodwill impairment charges on Farmers Edge recorded during 2022 of $133.4, operating income of the Non-insurance companies reporting segment increased significantly by $240.1 to $318.3 in 2022, principally reflecting higher share of profit of associates at Fairfax India, higher business volumes at Thomas Cook India, and improved margins and higher business volumes in the Restaurants and retail operating segment and at AGT. This significant improvement of $240.1 from the Non-insurance companies reporting segment reflected the easing of COVID-19 restrictions that had previously negatively impacted this reporting segment with the increase in operating income in 2022 driven by increases reported in all underlying operating segments."
-
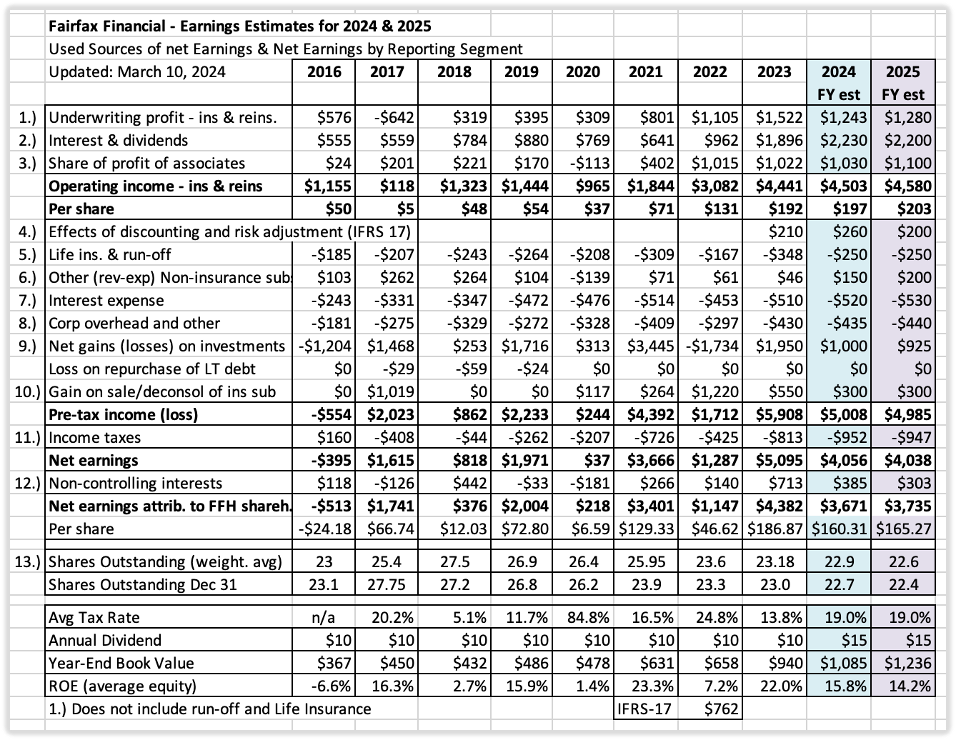
Earnings Estimates – Two Year Summary for 2024 & 2025
Below is an update to my two-year earnings estimate for Fairfax. Please note, forecasts are a guess at a point in time. To state the obvious, things are constantly changing. As a result, my earnings forecasts quickly become outdated. These forecasts are intended solely for entertainment purposes – please keep this in mind.
Since my last update, Fairfax has released both Q4 earnings and their 2023 annual report. This allows us to finalize results the 2023 year and update our forecasts for 2024 and 2025.
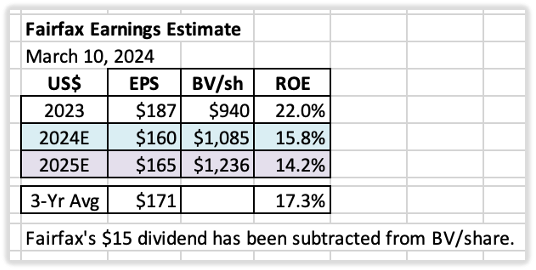
Summary
My current estimate is Fairfax will earn about $160/share in 2024 and about $165/share in 2025. For reasons outlined further below, I think both of these estimates have been constructed using mildly conservative assumptions.

2024 & 2025 Forecast
A hard piece to forecast with Fairfax is capital allocation. Fairfax is currently generating a significant amount of earnings. But we don’t know today how the future cash flows will be invested:
- Grow insurance (continuation of hard market)
- Buy out minority partners in insurance?
- Equities or fixed income?
- Buy back a meaningful amount of Fairfax stock?
- Other?
Looking at the last 5 years, the management team has done an outstanding job with capital allocation. My guess is they will continue to make good decisions (on balance) and this will benefit shareholders – likely providing a tailwind to my forecasts for 2024 and 2025.
Using Yahoo Finance as a guide, analysts are collectively estimating that Fairfax will earn about US$148/share (C$200) in 2024 and US$157/share (C$211) in 2025 (using $0.742 US$/C$ exchange rate). Why are analyst estimates below my forecast? From what I can see, most analysts are assigning little benefit to future earnings and Fairfax’s proven capital allocation skills. Most analysts will include these benefits into their earnings estimates after Fairfax has announced something.
I am assuming interest rates remain roughly at current levels (at March 10, 2024). Of course, this will likely not be the case. But given the duration of the fixed income portfolio is now closer to the duration of the insurance liabilities, changes in interest rates (up and down) might kind of balance out (in ‘net gains/losses on investments’ and ‘effects of discounting and risk adjustment- IFRS 17’)
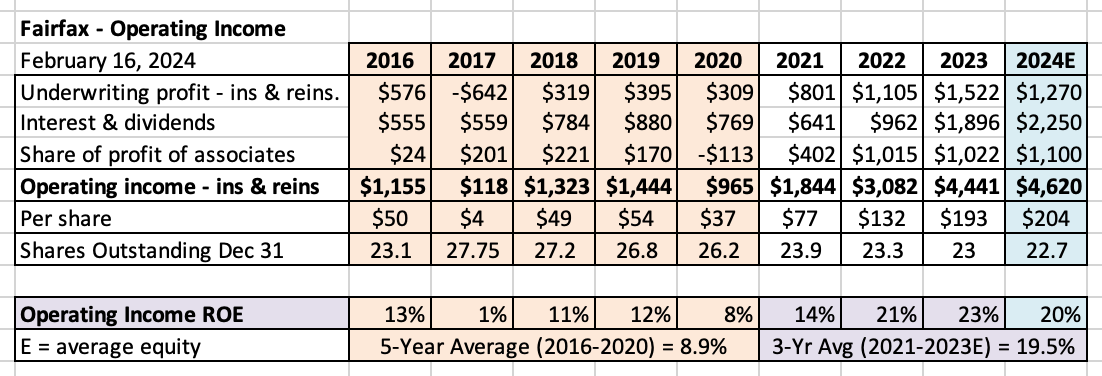
Below is an 8-year snapshot for Fairfax. It communicates in a concise manner the dramatic transformation that has happened at the company, beginning around 2021. There has been a spike in operating income per share – it has increased from an average of $39/share over the 5-year period from 2016-2020, to $192/share in 2023. This much higher amount now looks like the new baseline for the company. For 2024, my estimate has operating income increasing to $197/share, which is a 400% increase from the average from 2016-2020. Normalized earnings at Fairfax have moved to a much higher level – and, importantly, this level looks sustainable.
What are the key assumptions?
1.) Underwriting profit: Estimated to come in at $1.24 billion in 2024.
-
Net written premiums growth of 12% in 2024 and 3% in 2025. This is being driven by:
- Continuation of the hard market, which we estimate will add $1 billion of NWP.
- The Gulf Insurance Group (GIG) acquisition, which will add $1.7 billion of NWP.
-
Combined ratio (CR) of 95% in both 2024 and 2025.
-
Catastrophe losses: 2024 will be a more normal year (higher than 2023).
- Fairfax continues to modestly shrink their total catastrophe exposure.
- Reserve releases: continuation of the positive trend observed in 2023.
-
Catastrophe losses: 2024 will be a more normal year (higher than 2023).
2.) Interest and dividend income: Estimated to increase to a record $2.2 billion in 2024 and 2025
- Interest and dividend income in Q4 2023 was $536.6 million; this provides a good baseline (starting point).
- GIG adds about $2.4 billion to the total investment portfolio in 2024. A tailwind.
- Eurobank will start paying a dividend in 2H 2024. A tailwind.
- Rate cuts by global central banks would be a headwind in 2H.
3.) Share of profit of associates: Estimated to increase to a record $1.03 billion in 2024.
- Earnings at Eurobank, Poseidon, Stelco and Fairfax India, in aggregate, should continue to grow nicely. EXCO (nat gas prices) could be a headwind.
- GIG will be a small headwind as it is now consolidated.
4.) Effects of discounting and risk adjustment (IFRS 17):
- The two key drivers for this bucket are the trend in net written premiums of the insurance business and changes in interest rates.
- Net written premiums growth of 12% in 2024 should be a tailwind.
- I am modelling for interest rates to remain flat.
- This bucket is among the most difficult to model – therefore, my confidence level in my estimates is low.
5.) Life insurance and runoff:
- This combination of businesses lost about $348 million in 2023.
- I expect earnings in 2024 to be a little better – a lower loss of $250 million - with life insurance being a modest tailwind.
6.) Other (revenue-expenses) - non-insurance subsidiaries:
- Recipe, Dexterra, AGT, Grivalia Hospitality, Boat Rocker, Farmers Edge etc.
- This combination of businesses earned $46 million in 2023.
- I expect earnings to be better in 2024, coming in at $150 million.
- This bucket is poised to grow nicely for Fairfax in the coming years. It could surprise to the upside. Yes, the results will be lumpy.
7.) Interest expense: At $520 million, a modest increase to prior year of $510 million.
8.) Corporate overhead and other: At $435 million, a modest increase to prior year of $430 million.
9.) Net gains on investments: Estimated to come in around $1 billion in 2024.
- The big driver will be the FFH-TRS position. $250 x 1.96mn shares = $500 million?
- Remaining mark to market holdings of $7 billion x 7% return = $500 million?
10.) Gain on sale/deconsol of insurance sub: This is where I put the large asset sales/revaluations.
- In 2023, it was the sale of Ambridge and the revaluation of GIG for a total of $550 million.
- In 2024, I am modelling a gain of $300 million. Perhaps Fairfax (finally) gets approval from regulators in India to move their ownership in Digit from 49% to 68% and this generates a sizable gain. A Digit IPO might also result in a write up of Fairfax’s position.
Bottom line, this bucket is a wild card. But Fairfax has a long history of surfacing significant value hidden on its balance sheet. $300 million per year seems like a conservative average estimate. I am including insurance and non-insurance here together (even though the title says insurance).
11.) Income taxes: estimated at 19% (historical average rate)
12.) Non-controlling interests: I am expecting Fairfax to take out one of its minority partners in 2024. The leading candidate is Brit. My second choice would be increasing their ownership in Allied World to 90% (from 83.4%).
- In the past, I used an average rate of 11% (amount of net earnings that was allocated to non-controlling interests). This has been reduced to 9.5% in 2024 and 7.5% in 2025.
- This change increases the amount of net earnings going to Fairfax shareholders.
13.) Shares Outstanding: Estimated that effective shares outstanding will be reduced by 300,000 shares per year for 2024 and 2025. This is the same amount as 2023.
Notes:
- ‘Underwriting profit’: Includes insurance and reinsurance; does not include runoff or Eurolife life insurance.
- ‘Interest and dividends’ and ‘share of profit of associates’: Includes insurance, reinsurance and runoff.
—————
Return on Equity Calculation
Return on equity (ROE) is calculated below using ‘average equity’ which is:
- (PY ending BV/share + CY ending BV/share) / 2
I think most of the industry (other P/C insurance companies, analysts) calculate ROE using an average number for equity. So, this likely makes my ROE estimates more comparable with industry numbers.
-
9 hours ago, Hamburg Investor said:
Agreed, @dartmonkey and @Dinar.
Just to be clear: the nine times earnings is without the gains on the stock portfolio, without TRS and without (maybe) gains on selling of wholly owned businesses like the pet insurance businesses or IPOs. Assuming normalized earnings of 200 dollar per share (125 dollar in OE isn’t a normalized, but a minimum number) or a little bit less in year 1 gets us to a pe ratio a little bit below 6 and an roe of 21%. If stock markets tank in year 1 it will be way less of course.
If Watsa doesn’t reach roe way above 15% in times like these (hard market, value beating growth), than he won’t reach an average of 15% (that 15% isn’t tied to OE, @dartmonkey, so 15% of 29bn or 6bn would be including stock gains etc… That’s your point, isn’t it?!) over the longterm.
Regarding that goal of compounding at 15%, I again and again read, that Prem hasn‘t reached it and Buffett hasn‘t reached his (former) goal and that these two and Markel won‘t reach returns like in the years up to 2007/2009 again, as they are e. g. too big. I think what those people miss is, that the years following 2007/2009 until 2019/2021 were really special and giving strong headwinds to all insurers (that’s why the valuations of those three came really down compared to pre the financial crisis). Soft markets, bad returns for value versus growth, low interest rates were a toxic cocktail for those three (and others). It was a very long soft market, growth has never underperformed value by such a margin and for such a long time (am I wrong?) and interest hasn‘t been lower (especially for such a long time). And yes, in case of Fairfax Prem wasn‘t really executing well; but that’s only part of the story. BRK and MKL weren’t either shooting the lights out and even if Prem would have done a perfect job between 2010 and 2016 (which he clearly hasn’t), the returns in those years would have been subpar in relation to historical returns too. And that’s not a coincidence, that all three performed with low CAGRs in those years, it’s structural. It’s the other side of the startup boom, it’s the other side of house prices and oldtimer prices booming, the other side of the tech boom, the other side of businesses not earning a dime getting as much cash as they wanted. What’s the point of float, if you get cash everywhere and as much as you want? What’s the point of float, if you have to pay the bank for holding your cash instead of getting a return? Historical float was a driver of roe at all three businesses, but that special sause literally disappeared in the lost decade.
But now hopefully it again all makes sense. Without that decade Fairfax wouldn’t been valued so low. I really feel lucky having found an above average business, reinvesting at 15% (or more) at a pe ratio below 6, while the market is valued 5 times higher.
@Hamburg Investor i agree that very low interest rates especially 2017-2020 negatively impacted the returns of the fixed income portfolio. The elephant in the room for Fairfax was the equity hedges / short positions. The equity hedges were in place from 2010-2016 and the last short position was removed in 2020. Over an 11 year period (2010-2020) these collective positions lost Fairfax an average of $494 million per year. This is when Fairfax was a much smaller company. Fairfax got the position size wrong. And the duration. That was straight out bad investing.
I have also talked an nauseam about the many terrible equity investments made from 2014-2017. The first investment in Eurobank ($444 million - went to zero). Commercial International Bank - Egypt ($330 million - opportunity cost - dead money for a decade), Exco Resources, Fairfax Africa. APR, Farmers Edge and AGT. All of these investments performed poorly after purchase. Many needed more money from Fairfax to keep the lights on. A few needed more money multiple times. Some of these investments also needed management help. What i have listed here are a collection of terrible investments. And not because of zero interest rates or any external factor. Fairfax messed up. At the time their equity selection process was badly flawed. IMHO, Fairfax’s issues had nothing to do with value investing being out of favour.
At the same time, Fairfax was doing lots of very good things. Insurance was growing like a weed. The pivot was made in insurance in India from ICICI Lombard (position was monetized) to Digit (start-up was seeded). Investments in India were performing well - Fairfax India was launched. It’s like Fairfax was suffering from some bipolar corporate disease from 2010 to 2017.
Of course, not all investments are going to work out. Fairfax’s problem in 2017 is too many of its equity investments were sub-par (remember, Blackberry and Resolute Forest Products were some of legacy investments that were the big dogs back then).I think something changed at Fairfax in late 2017 or early 2018. It’s like Prem had finally had enough of the crap and bs with the equity holdings/process. From 2018 forward, Fairfax has put a premium on buying companies that were very well managed. And financially sound (i.e. not likely to need more cash from Fairfax to keep the lights on). At the same time, Fairfax looked at its existing equity holdings and saw them for what they were - and then Fairfax got to work to clean up the mess. I think Prem also delivered the message - new capital would now be allocated primarily to the best opportunities/managers (15% return target was now expected).
Six years later it is amazing the progress that Fairfax has made. Today, as a group, the equity holdings are well run. And they are profitable - meaning they don’t need money from Fairfax to remain a going concern. They are using retained earnings to drive their growth. Fairfax is also using retained earning to make new purchases and drive new growth. 2024 might be an inflection point for the performance of the equity portfolio (as a group).
Are there still a few issues? Yes. CIB still resides in Egypt. There will always be a few issues in every equity portfolio. But the issues are shrinking is size every year. And the flowers in Fairfax’s equity portfolio are blooming and getting bigger every year. And new flowers are getting planted.
The quality of the insurance business has never been better. The quality of the equity portfolio has never been better. The bond portfolio is perfectly positioned. The management team is executing exceptionally well - capital allocation has been superb the past 5 years - regardless of what has been going on in the macro environment (actually they have been exploiting it). Size is not an issue for Fairfax (and shouldn’t be for the next decade). I am looking forward to seeing what kind of ROE Fairfax can deliver in the coming years - my guess is it will be better than most are thinking today. It really is stunning the turnaround they have pulled off the past 5 years.
-
4 hours ago, SafetyinNumbers said:
SCR.TO is held in the Limited Partnerships bucket but I think it’s about 14.5m shares so just qualifies for the top 20. Probably not worth tracking unless it makes an outsized move.
Thanks for the heads up. This one looks large enough. I’ll likely add it tomorrow
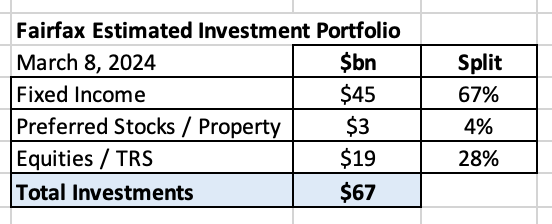
-
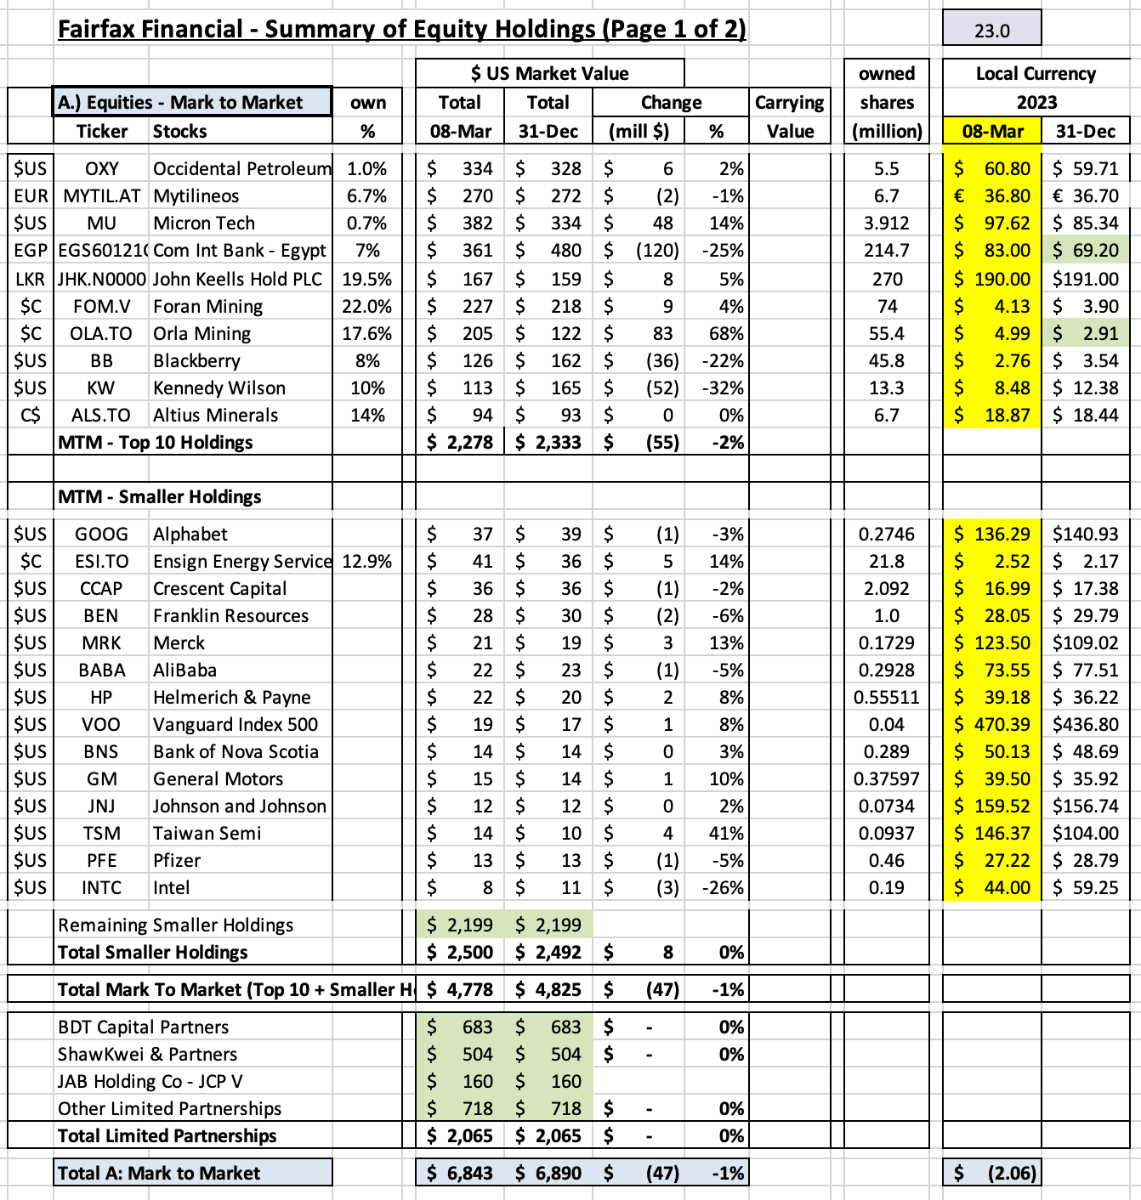
As of March 8, 2024, my guess is Fairfax has an investment portfolio that totals about $67 billion, with the split being roughly as follows:
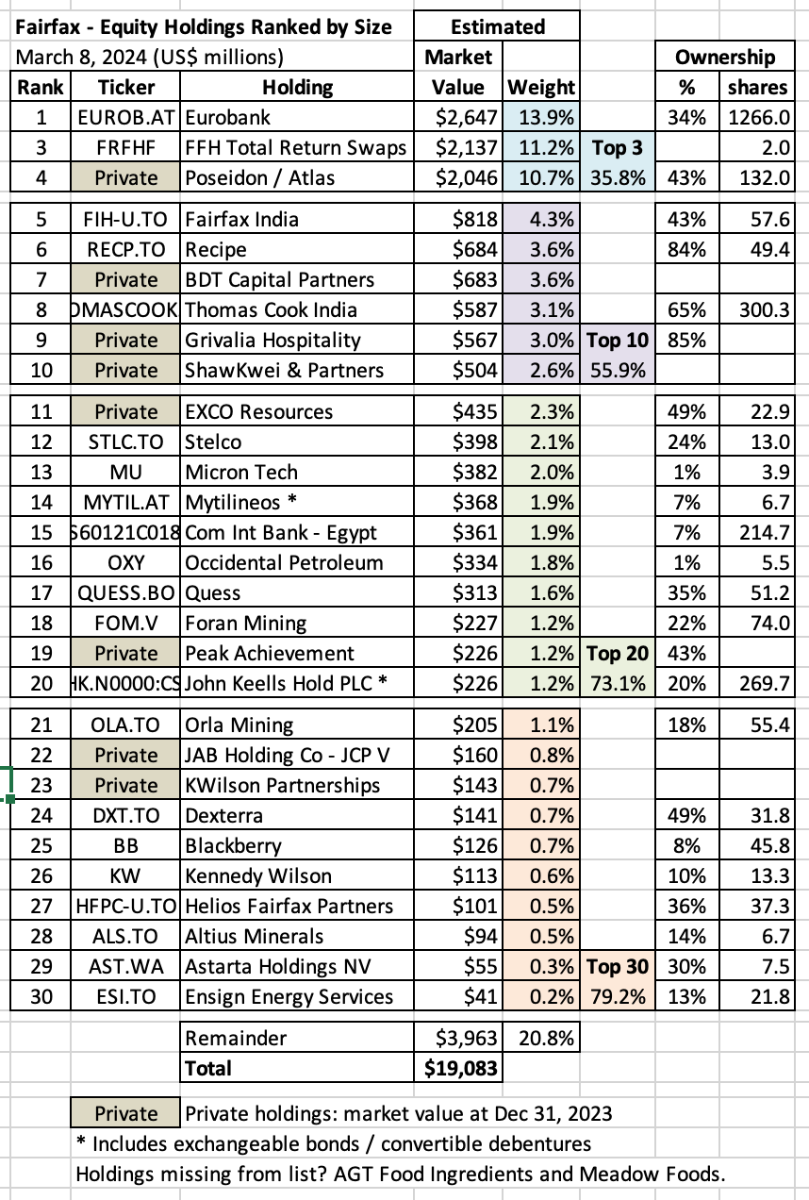
In this post we review the holdings in the equities ‘bucket.’ To value a holding, we normally use current ‘market value,’ which is the stock price at March 8, 2024, multiplied by the number of shares Fairfax owns. For private holdings we use Fairfax’s latest reported market value, which was Dec 31, 2023. Derivative holdings, like the FFH-TRS, are included at their notional value.
Additional notes:
- Mytilineos *: includes exchangeable bonds
- John Keells *: includes convertible debentures
What holdings are missing from my list below? AGT Food Ingredients and new purchase Meadow Foods (2023) are two that come to mind. I just have no idea what they are worth. Let me know if you have an estimate.
Ok, let’s get to the fun part of this post.
What are some of the key take-aways?
Below are mine. What are yours?
1.) Fairfax has a pretty concentrated portfolio
- The top 3 holdings make up 36% of the total
- The top 10 holdings make up 56% of the total
2.) Steady improvement in quality of the top holdings over the past 6 years: What happened?
- New money has been invested at Fairfax very well (FFH-TRS, buying more of existing holdings)
- Some high quality businesses have continued to execute well (Fairfax India, Stelco)
- Some businesses, after years of effort, have turned around (Eurobank).
- Some businesses that were severely affected by Covid have emerged stronger (Thomas Cook India, BIAL)
- Some businesses were restructured/taken private (Exco, AGT) and are now performing much better.
- Some low quality businesses were sold/merged/wound down (Resolute Forest Products, APR, Fairfax Africa).
- Some low quality businesses have shrunk in size due to poor results (BlackBerry, Farmers Edge, Boat Rocker).
The important point is the quality of Fairfax’s largest holdings have steadily been increasing. And this should result in higher overall returns from the equity portfolio in the coming years.
3.) What rate of return should this collection of equity holdings be able to deliver in 2024?
-
12% return x $19 billion = $2.3 billion
- share of profit of associates ($1.05 billion)
- dividends ($200 million)
- ‘other’ consolidated non-insurance co’s ($100 million)
- investment gains ($650)
- for associate holdings, change in excess of carrying value to market value ($300 million)
This looks like a reasonable target for 2024, looking at the solid prospects/earnings profiles of the current holdings.
4.) A slow shift away from mark-to-market holdings. Today, less than 50% of the total portfolio is held in the mark-to-market bucket. Back in 2019, my guess is closer to 80% of the total portfolio was held in the mark-to-market bucket.
- This shift should have the effect of smoothing Fairfax’s reported results moving forward, especially during bear markets. As a reminder, in Q1, 2020, Fairfax had $1.1 billion in unrealized losses (when the equity portfolio was much smaller). As more holdings shift to the ‘Associates’ and ‘Consolidated’ buckets, it is the trend in underlying earnings at the individual holdings that will matter to Fairfax’s reported results and not a stock price - earnings are much more consistent than a stock price. Lower volatility in reported earnings should help Fairfax’s valuation (as volatility is considered bad by Mr. Market).
- This shift will also start to create a Berkshire Hathaway problem for Fairfax: over time book value will become an increasingly poor tool to use to value Fairfax. Why? The value of the ‘Associates’ and ‘Consolidated’ companies captured in book value each year will fall short of the increase in their true economic value. Fairfax India is a good example of this today. Eurobank is a holding to watch moving forward.
Bottom line, Fairfax looks very well positioned today. But the story gets better: like the past 6 years, I expect the quality of Fairfax's equity holdings to continue to improve in 2024. That will improve future returns. And, like a virtuous circle, the growing cash flows will be re-invested growing the companies even more.
Thoughts? Am I missing something? What number below is most wrong? Why?
-
Now that Fairfax's annual report is out I am able to update a few things. I thought I would start with the equity holdings. The AVLN position (from the Riverstone UK sale) was completely exited by year end 2023. As a result, the significant noise from this holding has been eliminated. We now have a clear view of exactly what Fairfax's position is in its various equity holdings.
I wonder how much Fairfax spend exiting the AVLN position in 2023? My guess is it was a significant use of cash.
----------
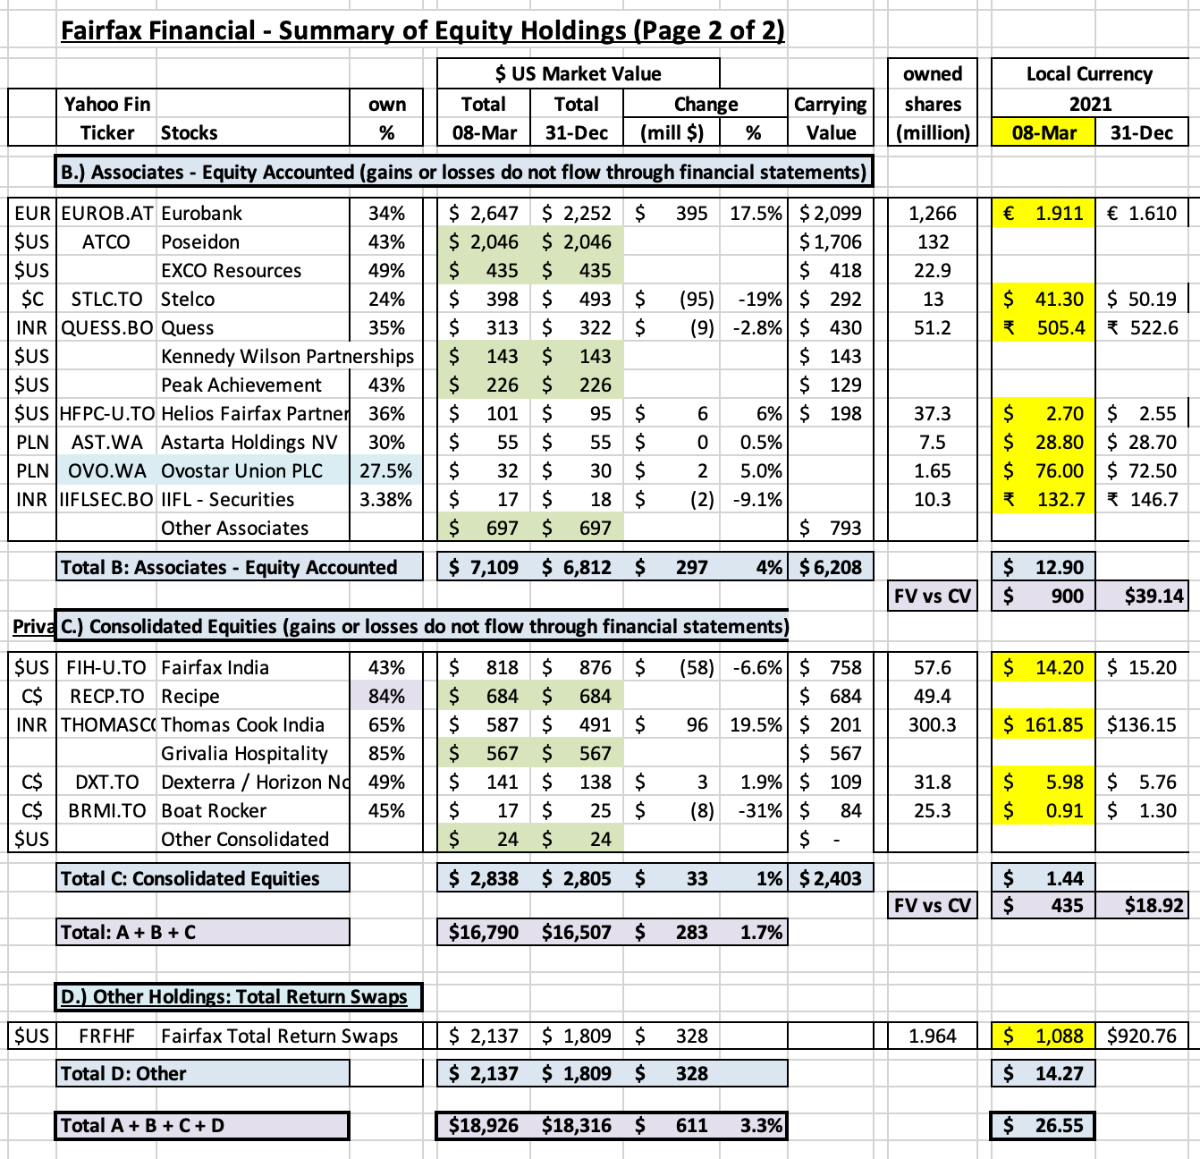
What was the change in value of Fairfax’s equity portfolio to March 8, 2024?
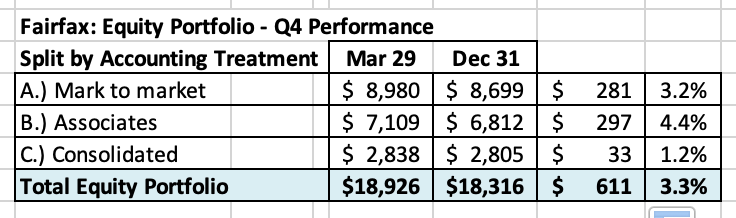
March 8, 2024
Fairfax’s equity portfolio (that I track) had a total value of about $19 billion at March 8, 2024. This is an increase of about $611 million (pre-tax) or 3.3%.
I include the FFH-TRS position in the mark to market bucket and at its notional value.
My tracker portfolio is not an exact match to Fairfax’s actual holdings. My summary has been updated to include information from Fairfax’s 2023 annual report. My tracker portfolio is useful only as a tool to understand the rough change in Fairfax’s equity portfolio (and not the precise change).
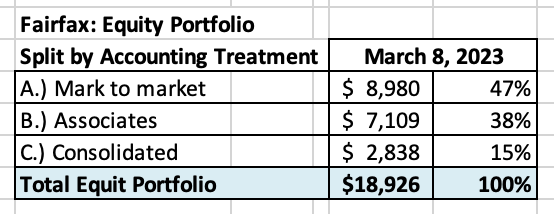
Split of total holdings by accounting treatment
About 47% of Fairfax’s equity holdings are mark to market - and will fluctuate each quarter with changes in equity markets. The other 53% are Associate and Consolidated holdings.
Over the past couple of years, the share of the mark to market portfolio has been shrinking. This means Fairfax's quarterly results will be less impacted by volatility in equity markets.
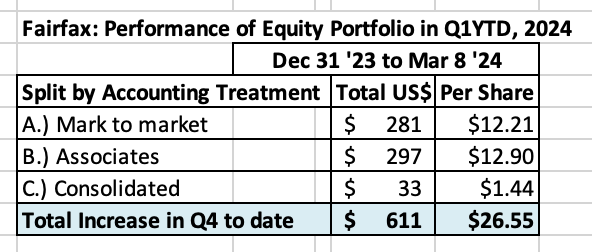
Split of total gains by accounting treatment
- The total change is an increase of $611 million = $26.55/share
- The mark to market change is an increase of $281 million = $12.21/share. The change in this bucket of holdings will show up in ‘net gains (losses) on investments’ (along with changes in the value of the fixed income portfolio) when Fairfax reports results each quarter.
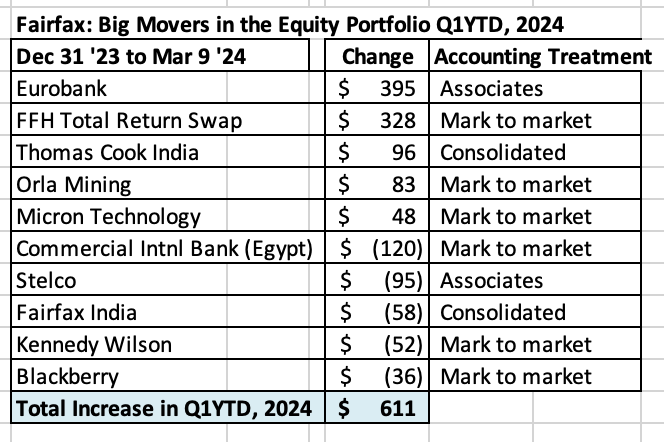
What were the big movers in the equity portfolio Q1-YTD?
- Eurobank is up $395 million and it is now Fairfax’s largest equity holding at $2.6 billion.
- The FFH-TRS is up $328 million. This position is now Fairfax’s second largest holding.
- Thomas Cook India is up 96 million. TCIC continues its strong performance.
- Commercial International Bank is down $120 million. Egypt devaluated its currency 40% on March 7. Well run bank. Country is an economic mess.
Excess of fair value over carrying value (not captured in book value)
For Associate and Consolidated holdings, the excess of fair value to carrying value is about $1,335 million or $58/share (pre-tax). Book value at Fairfax is understated by about this amount.
- Associates: $900 million = $39/share
- Consolidated: $435 million = $19/share
Equity Tracker Spreadsheet explained
Holdings have been separated by accounting treatment: mark to market, associates – equity accounted, consolidated, other Holdings – total return swaps.
We come up with the value of each holding by multiplying the share price by the number of shares. Are holdings are tracked in US$, so non-US holdings have their values adjusted for currency.
This spreadsheet contains errors. It is updates as new and better information becomes available.
-
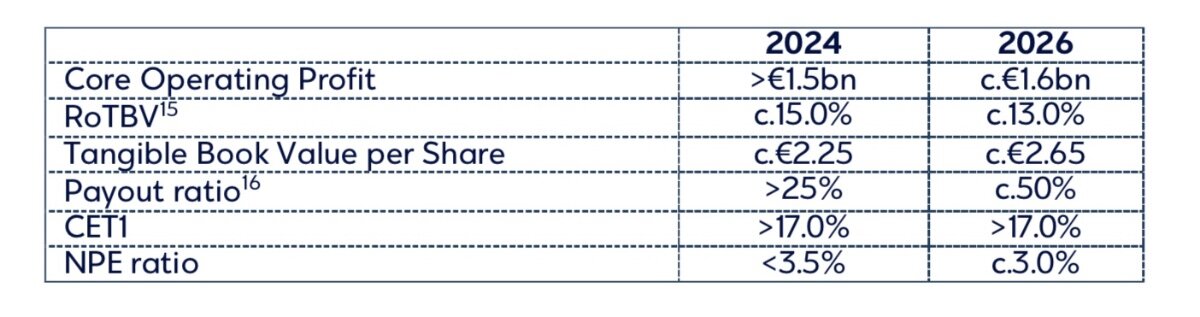
I just listened to the Eurobank 2023 YE conference call. Their aggressive actions the past 3 years have positioned the bank exceptionally well. They are being very conservative with their estimates for 2024-2026. They have so many catalysts to boost earnings over guidance in 2024 and future years. The management team is laser focussed and is executing very well.
Why is Eurobank being so conservative?
1.) They need to get the Hellenic Bank acquisition approved by regulators. Status quo is the best way to do this. Cypress is a different country… and local people tend to be very protective of critical institutions like banking.2.) Once approved, Eurobank will need to make a mandatory tender offer for the @45% of Hellenic Bank they do not own. So obviously Eurobank doesn’t want to drive the acquisition price even higher (by announcing big cost and revenue synergies prematurely).
Once Cypriot regulators approve the deal and after they own as much of the company as they can get - only after this happens - will Eurobank management more freely communicate on cost and revenue synergies. At least that is how things look to me. They are keeping their head down for now. Smart.
On the dividend, Eurobank expects to get confirmation from the regulator in May. They provided an estimate of €0.09/share. Fairfax owns about 1.224 billion shares.
€0.09 x 1,224 million shares = €110 million = US$120 million. That would be a material increase in total dividends received by Fairfax (from all sources) - perhaps an increase of about 80%. It would also be a material increase to ‘interest and dividends’ (from all sources) of about 5% - significant.
In Fairfax’s 2021 Annual Report, Prem mentioned that the average cost of Fairfax’s position in Eurobank was US$0.94/share = $1.1 billion. Fairfax made their first investment in Eurobank in Dec 2014. So, about 9 years later Fairfax could be getting a dividend yield of about 11% (from its cost base). And as @nwoodman pointed out earlier, this could increase quite a bit in the next couple of years.
The Eurobank acquisition has delivered other significant benefits to Fairfax over the years - like their 80% ownership of Eurolife (Eurobank stills owns 20%).
I don’t have a strong opinion on how Grivalia Hospitality is going to work out (Eurobank and GH management still owns 21.5%). But anything George Chryssikos has touched has worked out very well for Fairfax and its shareholders.
Link to Eurobank’s conference call:
https://www.eurobankholdings.gr/en/investor-relations/financial-results-pages/financial-year-2023
PS: my share count is different from @nwoodman . I will update my numbers after Fairfax releases their annual report. -
27 minutes ago, nwoodman said:
Eurobank Earnings are out
EPS of 0.31 for the year
Looking to transition to 50% payout over the next couple of years
“In a lower interest rates environment, Eurobank aims to generate resilient returns to shareholders, which will be further enhanced by the full integration of Hellenic Bank in Cyprus, capitalizing on the strong franchise in Greece, organic growth and strategic initiatives in Cyprus and Bulgaria. The ROE' is expected to reach 18% in 2024 and circa 15% beyond 2024, while the payout ratio will gradually increase towards 50% of profits in
20264. Eurobank, as a regional bank with diversified earnings stream, aims to ensure top line growth amid a lower rates environment, with non-Greek operations contributing c. 50% to the Group core profit in 2026. The 2024-2026 financial goals are as follows:
Edit: MS take on earnings attached
What a simply amazing year for Eurobank. Transformational. Their website is painfully slow right now? Below is a link to their full year results presentation. I think Eurobank is sandbagging their 2024 estimates. And that is the sign of a strong management team - underpromise and overdeliver. That is the same playbook they used in 2023 and 2022. They do not feel any pressure to be overly aggressive with financial targets.
I am looking forward to seeing details of what the 25% payout (of 2023 baseline earnings) will look like - what the split is between dividend and stock buybacks.
Eurobank is a $2.5 billion position for Fairfax today. A 15% return = $375 million; 20% = $500 million. This investment has quickly turned into a home run for Fairfax. And i think it is just getting started. A double in the stock price over the next 4 years is not a crazy target.
-
1 hour ago, nwoodman said:
No particular insight but this looks like a “public hanging” to me. Not good, but I can’t see Fairfax stepping with a line of credit if this is more than regulatory violations.
I would expect any help that comes from Fairfax India will be structured in a way that is very beneficial to Fairfax India.
Perhaps a similar playbook to how Fairfax helped out Thomas Cook India during Covid and John Keells during Sri Lanka’s economic crisis. A couple of years later, both of those incremental investments have worked out very well for Fairfax shareholders. It’s almost like a kind of vulture investing… except in a situation you understand exceptionally well.
Fairfax’s ownership in IIFL Finance has come down quite a bit over the past couple of years. Fairfax sold all of their direct ownership position. And in Q4 2023, Fairfax India sold a big chunk of their stake (i think it raised around $150 million).
Fairfax also exited their direct holding in sister company IIFL Wealth. And i think Fairfax India has sold down their position quite a bit as well.
-
6 hours ago, gfp said:
@Viking if you are really a stickler for detail and this post is as of end of February, the Orla mining percentage ownership is low as well
https://www.fairfax.ca/press-releases/fairfax-announces-acquisition-of-additional-orla-shares-3/
@gfp Thanks. My master has been updated. My math says they have spent about US$61 million in Jan/Feb adding to their Orla position. It is about a $183 million position today.
-
26 minutes ago, giulio said:
Increased position in JKH through debt conversion. FFH now owns close to 20%.
https://www.ft.lk/top-story/Fairfax-converts-Rs-14-3-b-worth-debt-into-equity-at-JKH/26-759025
@giulio that is a great article. I will update my spreadsheet to capture the new news. I really appreciate you (and everyone) pointing out things i have missed. Great community. -
42 minutes ago, dartmonkey said:
Blackberry is now a $130 million position = 0.0021% of Fairfax’s $60 billion investment portfolio.
Thank you so much for this summary, much appreciated.
Minor quibble about a decimal place: Blackberry seems to be on the way to being 0.0021%, but it's not there yet. 130/60,000 is 0.0021 but that means it's still 0.21%.
One other quibble - I would add one word to this sentence: This is another good example of Fairfax FINALLY exiting from a poorly performing legacy investment (financially and also in terms of involvement from the management team). Capital at Fairfax continues to shift to better opportunities.
@dartmonkey i made the correction. Thanks for pointing it out (accuracy is important). I think lots of investor are very happy to see Fairfax significantly shrinking its investment/involvement in Blackberry. Moving in the right direction. -
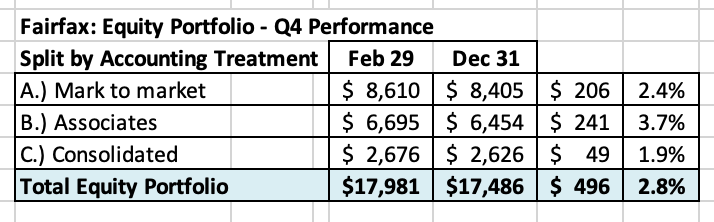
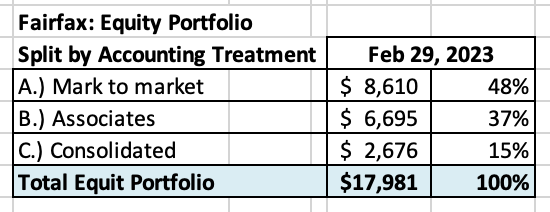
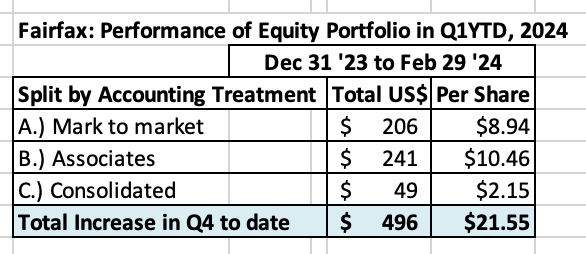
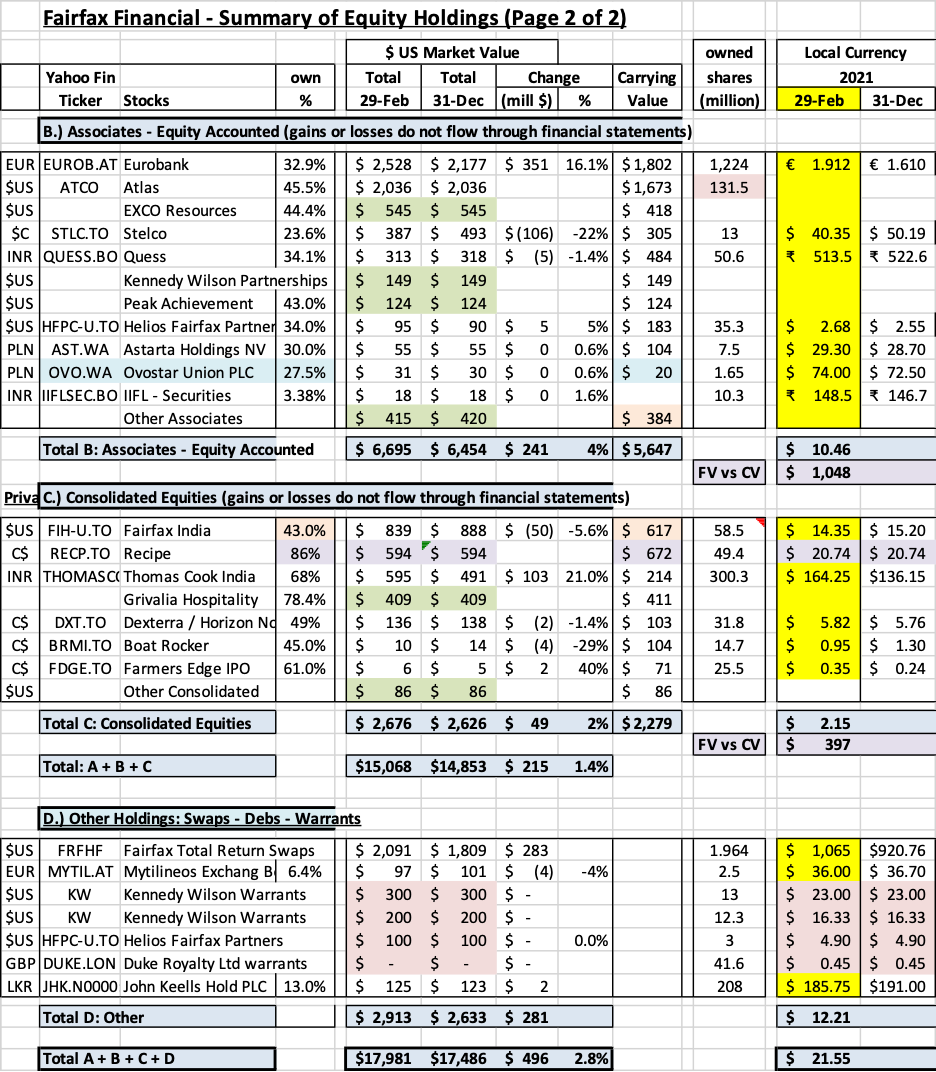
What was the change in the value of Fairfax’s equity portfolio to Feb 29, 2024?
Fairfax’s equity portfolio (that I track) had a total value of about $18 billion at February 29, 2024. This is an increase of about $496 million (pre-tax) or 2.8% from December 31, 2023. The increase two months into Q1 works out to about $21.45/share.
I include holdings like the FFH-TRS position in the mark to market bucket and at its notional value. I also include debentures and warrants in this bucket.
My tracker portfolio is not an exact match to Fairfax’s actual holdings. My summary contains no information from Fairfax’s 2023 annual report, as it has not been released yet.
As a result, my tracker portfolio is useful only as a tool to understand the likely directional movement in Fairfax’s equity portfolio (and not the precise change).
Split of total holdings by accounting treatment
About 49% of Fairfax’s equity holdings are mark to market - this includes 'A.) Mark to Market' and 'D.) Other Holdings' - and will fluctuate each quarter with changes in equity markets. The other 51% are Associate and Consolidated holdings.
Over the past couple of years the share of the mark to market portfolio has been falling. This means Fairfax's quarterly results will be less impacted by volatility in equity markets. That is an important development.
Split of total gains by accounting treatment
- The total change is an increase of $496 million = $21.55/share
- The mark to market change is increase of $206 million = $8.94/share. Only changes in this bucket of holdings will show up in ‘net gains (losses) on investments’ (along with changes in the value of the fixed income portfolio) when Fairfax reports results each quarter.
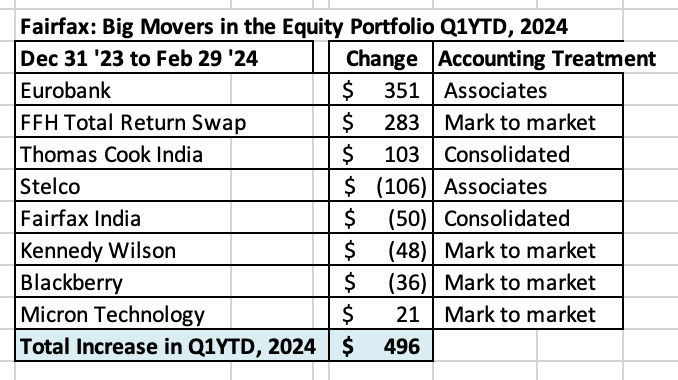
What were the big movers in the equity portfolio Q1-YTD?
- Eurobank was up $351 million and it is now Fairfax’s largest equity holding at $2.5 billion. Eurobank reports results March 7. It will be interesting to see if they initiate a dividend.
- The FFH-TRS was up $283 million. This position is now Fairfax’s second largest holding. The investment is up a total of $1.356 billion over the last 3 years, which is a gain of 185%. Simply an amazing investment.
- Thomas Cook India delivered a very strong Q4 to cap off a stellar 2023. Fairfax’s position was up $103 million. People are travelling again in India!
- Kennedy Wilson was down $48 million. The company has been hit hard by concerns in office real estate segment. The value to Fairfax from this holding is not its equity exposure. The value is the extensive partnership the two companies have established over the past 12 years, most recently in significantly expanding the real estate debt platform. I wonder if Fairfax does not use the current weakness in KW's share price to materially and opportunistically increase its stake in the company in 2024. That was the playbook Fairfax used with a number of holdings that were negatively impacted by Covid in 2020 - and these incremental investments have worked out extremely well for Fairfax a couple of years later.
- Blackberry continues to shrink in size, down $36 million. Blackberry is now a $130 million position = 0.21% of Fairfax’s $60 billion investment portfolio. In Q1, Fairfax also ended its $150 million debenture investment in Blackberry and Prem resigned from Blackberry’s board. The debenture was a $500 million dollar position in Sept 2020. This is another good example of Fairfax exiting from a poorly performing legacy investment (financially and also in terms of involvement from the management team). Capital at Fairfax continues to shift to better opportunities. The clean-up of poorly performing equity investments looks largely completed – understanding that there will always be a few underperformers.
Excess of fair value over carrying value (not captured in book value)
Carrying value in this section is understated by quite a bit as it does not capture Q4, 2023. I will update this once the annual report is released. For Associate and Consolidated holdings, the excess of fair value to carrying value is about $1.445 billion or $62/share (pre-tax). Book value at Fairfax is understated by about this amount (less the tax impact). Below is the split.
- Associates: $1.048 million = $45/share
- Consolidated: $397 million = $17/share
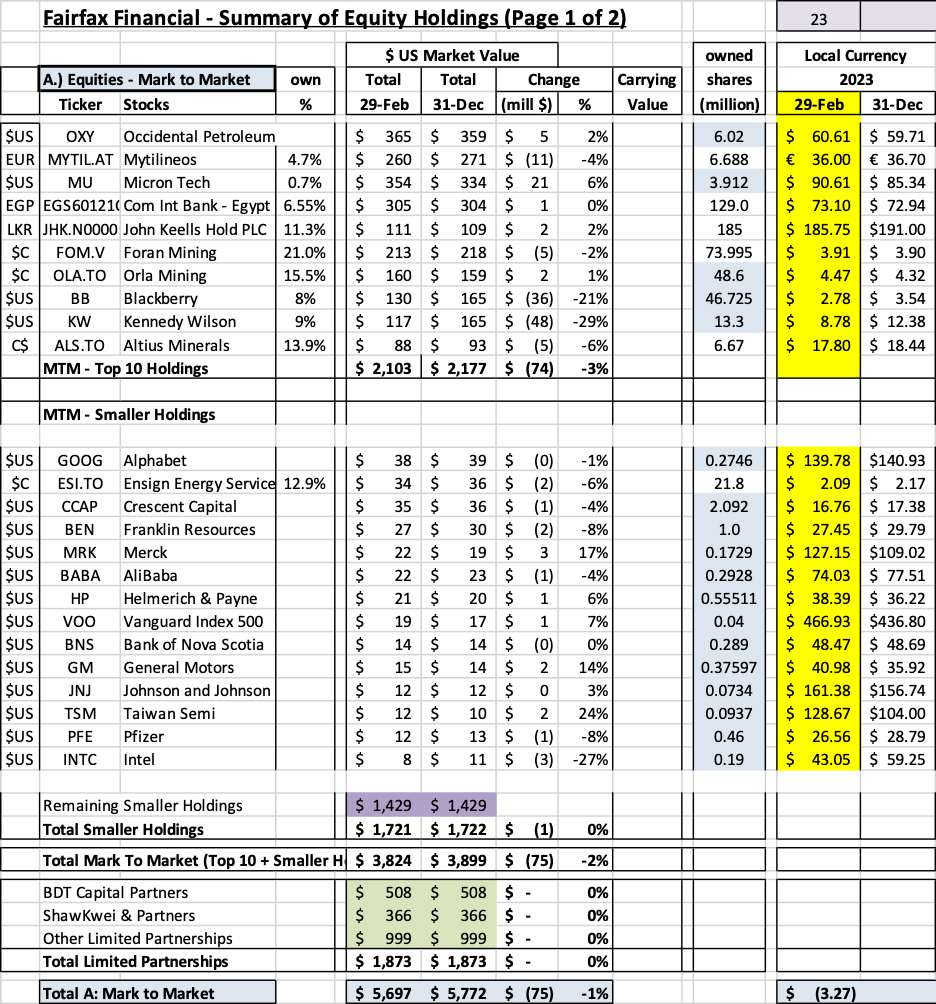
Below is a copy of my Excel spreadsheet (next 2 pages) if you want a closer look.
Equity Tracker Spreadsheet explained:
The summary below attempts to track all equity holdings at Fairfax. Each quarter the spreadsheet is updated to capture any ‘new news:’ purchases and sales.
We have separated holdings by accounting treatment:
- Mark to market
- Associates – Equity accounted
- Consolidated
- Other Holdings – derivatives (total return swaps), debentures and warrants
We come up with the value of each holding by multiplying the share price by the number of shares. Are holdings are tracked in US$, so non-US holdings have their values adjusted for currency.
Important: the list is not complete. Some information we only get once per year when Fairfax published their annual report. Fairfax also makes changes to their portfolio each quarter.
-
 1
1
-
Berkshire Hathaway has been one of the great investments of the past 60 years. We all knew Buffett was a genius. The business model was genius (using float from P/C insurance operations as cheap leverage). The company (outside of Buffett) was well managed. So why did so many people not get rich from owning Berkshire stock? What were the main reasons investors missed out on making big money?
I have been asking myself this question recently. I have followed Berkshire Hathaway more than most over the past 30 years. i owned shares a number of different times in the past and have done ok with it as a trade. But i missed out on making the big money. I would appreciate hearing what others have to say.
Did you nail your investment in Berkshire Hathaway? What enabled this?
Or more likely, did you miss out on making a killing in Berkshire Hathaway? What did you do wrong?
My obvious error was not owning a concentrated position and holding for decades. But that explanation doesn’t really explain anything that is useful. I think my big errors were:
1.) not understanding the power of compounding - in a Berkshire Hathaway context. My expectations of the future returns for BRK were much too low (how fast new income streams could be created from retained earnings). This led me to mis-value the stock.
2.) being too much of a market timer / trader - happy to take a quick short term gain.
The reason i think about this question so much is I do not want to make the same mistake with Fairfax.
-
1 hour ago, Libs said:
The comments about railroad and energy are quite jarring, and a complete departure from the past. Kudos to Warren for facing these issues head-first. As a shareholder it's forcing me to re-examine some of my assumptions, though. I had thought these two pillars were iron-clad.
Buffett is a master communicator. He just lowered the expectations bar significantly for the future returns for two of Berkshire’s largest businesses - railroad and energy. This will be a big, big benefit to Abel when he takes over.
Just imagine the outcry if Abel has said this post Buffett?
-
25 minutes ago, glider3834 said:
+1 - hopefully Eurobank can get remaining approvals to be able to offer for 100% - also Hellenic's capital ratios look decent in the 20s & NPEs have been de-risked into the low single digits - also regulators have put on hold any dividends by Hellenic pending acquisition by Eurobank
' Furthermore, despite high earning, the bank said it cannot proceed with the declaration of dividend for full year 2023 “due to regulatory restriction.”
“At this moment the restriction is in place due to a series of reasons. We at this transitional phase amid a takeover which the regulators have deemed that capital should remain with the organization instead of being distributed as a dividend,” Rouvas said.'
With the size of earnings at Hellenic Bank, it must be disappointing for minority shareholders to not get a big dividend payout right away. With all the cash building at Hellenic Bank, does this mean Hellenic will actually be able to fund a big piece of the takeout of the minority partners? W—————
Banking in Cypress is a duopoly with Hellenic Bank and Bank of Cypress with something like 80% share in most important categories when combined? Here are the results from Bank of Cypress - also outstanding.
-
4 hours ago, glider3834 said:
My math says Eurobank paid an average of €1.78 to acquire 55.3% of Hellenic Bank over the past couple of years (awaiting regulatory approvals to become majority owner). In 2023, Hellenic Bank earned €0.88/share. Tangible book value at Hellenic Bank is €3.54/share at Dec 31, 2023, up 35% year over year. This is looking like a great investment by Eurobank.
- https://www.hellenicbank.com/-/media/hbc/announcements/2024/february/12m2023/commentary-en.pdf
-
23 minutes ago, Hamburg Investor said:
What else can you say but: Thank you!
The picture gets richer every time thanks to the different perspectives you offer and which are necessary for a deeper understanding.
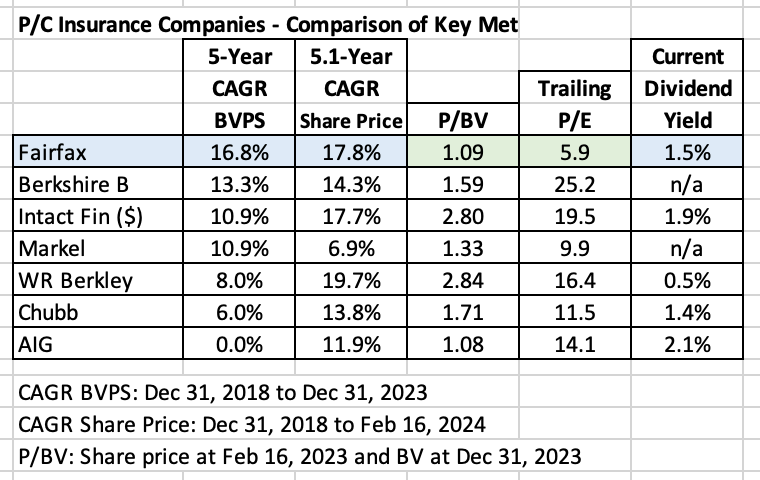
What strikes me when watching your last chart: Every single "Non-Berkalike" (I don't like the term, but still...) exploded in valuation, meaning the Price CAGR exceeds the book value CAGR in that 5 year view by miles:
Non-Berkalikes:
- Intact: 6.8% (17.7% minus 10.9%)
- WRB: 11.7%
- Chubb: 7.8%
- AIG: 11.9%
While the Berkalikes (including the original):
- BRK: 1.0% (14.3% minus 13.3%)
- MKL: (4.0%)
- FFH: 1.0%
On average the non-Berkalikes Price increase exceeded Book value growth by 9.6%, while the Berkalikes performed (0.6%) in that category. And Apart from AIG, the non-Berkalikes are currently all valued higher (PB ratio). And AIG should certainly be excluded for other reasons. Is this simply coincidence, as its only seven data points? Or is it due to the unorthodox, difficult to understand structure with "owned businesses" and the high level of involvement in publicly traded companies? A different shareholder structure? Mr. Market is going nuts again?
Anyhow I would be quite happy if the share price could stay where it currently is and Prem would buy back the company with the profits from the next few years. In less than a decade, the company would belong to the readers of cobf...
@Hamburg Investor Yes, i like to look at Fairfax in lots of different ways. None on their own are perfect. But looked at together, i think it is possible to sketch a pretty accurate picture of the company and its valuation.
One of the lesson’s for me with Fairfax over the past couple of years is how long it takes for narratives to change for companies. Even when the facts are clearly saying something quite different. This is actually good news for investors. In situations where fundamentals are improving faster than what is being reflected in the narrative it means you have lots of time to learn and get your position size right.
-
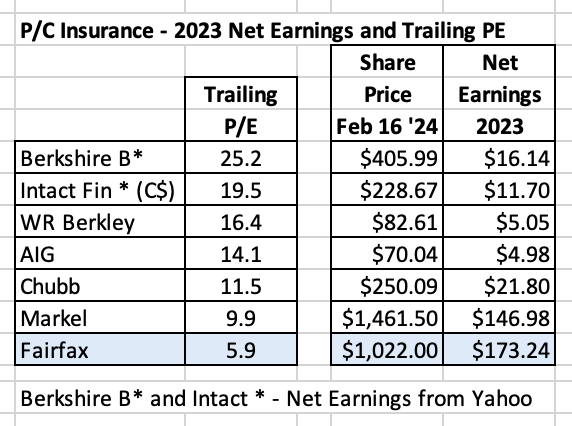
How Does Fairfax’s Valuation Compare to Other P/C Insurers?
There are lots of methods an investor can use to value a company and its stock price. In this post, we are going to use a method called ‘relative valuation.’ We are going to try and see what we can learn about Fairfax’s current valuation by comparing the company to a group of other P/C insurers.
We are going to keep the analysis very top line. In terms of time-frame, we are going to use the last 5 years. This is a good length of time to get a reading on the performance of the management teams for each company. And it also smooths out the impact of large short term events like catastrophes, Covid and the big swing in interest rates.
Who are we going to look at?
Below is the list of the seven P/C insurers we will compare (listed in alphabetical order):
- AIG: the fallen star; a turnaround play today.
- Berkshire Hathaway: historically, the gold standard; now more of a conglomerate than P/C insurer. We include it for fun.
- Chubb: big, traditional insurer; international in scope.
- Fairfax Financial: a turnaround play; about 30% of investments are in equities; international in scope.
- Intact Financial: largest P/C insurer in Canada; expanding globally.
- Markel: baby Berk; US focus
- WR Berkley: traditional insurer; US focus
To state the obvious: all P/C insurance companies have unique business models. Berkshire Hathaway has not released Q4, 2023 results so for them I have used an estimate for 2023YE book value and 2023 EPS.
—————
The most important metric used by investors and analysts to value a P/C insurance company is book value. Yes, it has its flaws. However, it is a good place to start.
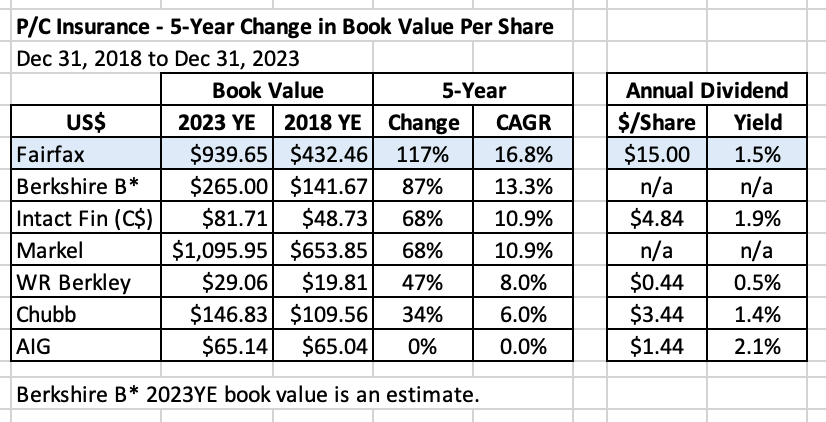
5-Year Change in Book Value
“In other words, the percentage change in book value in any given year is likely to be reasonably close to that year’s change in intrinsic value.” Warren Buffett
We are going to look at the change in book value for the 5-year period from Dec 31, 2018 to December 31, 2023. We have sorted the results in the table below from the best to the worst performers.
So which company has increased BVPS the most?
Fairfax Financial.
Fairfax has increased BV by 117% over the past 5 years, a CAGR of 16.8%.
Were you expecting that? I bet you weren’t expecting that.
The second surprise is the size of the outperformance by Fairfax over all peers. For example, Fairfax’s BV CAGR is 10% better than that achieved by Chubb - that is serious outperformance. Don’t get me wrong, Chubb is a quality company.
In the quote above, Warren Buffett suggests investors should use the annual change in book value as a rough approximation of the change in intrinsic value for a company. Using Buffett’s quote as a guide, I think we can safely say that Fairfax has increased intrinsic value over the past 5 years at a much faster pace than its P/C insurance peers.
Note: five of the seven companies pay a dividend (and WR Berkley has also paid special dividends).
Why has Fairfax’s performance been so strong?
The management team at Fairfax has been executing exceptionally well over the past 5 years. Especially when it comes to capital allocation. I recently wrote a long post on this topic so I am not going to repeat it here.
How have shareholders been rewarded?
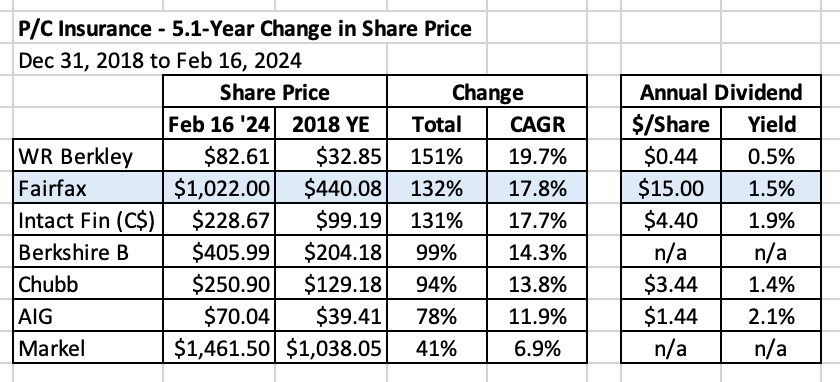
5.13-Year Change in Share Price
We are going to look at the change in the share price for the 5.13-year period from Dec 31, 2018 to February 16, 2024. Once again, we have sorted the results in the table below from the best to the worst performers.
Which company has seen their share price increase the most?
Three companies are bunched together as the top performers - WR Berkley, Fairfax Financial and Intact Financial. Including dividends, these three companies have delivered a CAGR of around 20% to investors over each of the past 5.13 years. That is outstanding.
Berkshire Hathaway, Chubb and AIG can be grouped in the next performance band. Including dividends, they have delivered a CAGR of about 14% which is quite good. And Markel has been the clear laggard with a CAGR of about 7%.
Another key takeaway is the performance of the group as a whole has been very good. Six of the seven companies listed have delivered a very good return to investors over the past 5.13 years. For reference, over the same 5.13 years, the S&P500 increased 100%, which was a CAGR of 14.4% (not including dividends).
Now let’s put book value and share price together and see what we can learn about valuation.
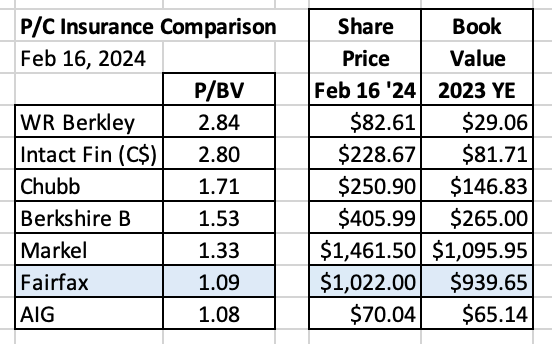
Current Price to Book Value (P/BV)
At 2.8, Both Intact and WR Berkley trade at the highest P/BV multiple. This is not surprising given they also saw the biggest increases in share price over the past 5 years.
Does anything in the chart below jump out?
Yes. Fairfax looks out of place.
Fairfax has been compounding book value at the highest rate over the past 5 years. So how can it also be trading at the lowest P/BV (i.e. the cheapest) valuation? That makes no sense.
Let’s look at another valuation measure and see what it tells us.
Price to Earnings Ratio (PE)
To keep things simple, I used reported EPS from 2023 for each of our seven companies. For Berkshire, who has not yet reported, I took the estimate from Yahoo Finance. For Intact Financial, who reported restructuring charges in Q4, I was generous and used the 2023 number in Yahoo Finance (which looks like it nets out the restructuring charges).
Does anything in the chart below jump out?
Yes. Fairfax looks out of place (again).
Fairfax has been compounding book value at the highest rate over the past 5 years. So how can it also be trading at the lowest PE (i.e. the cheapest) valuation? That makes no sense.
So what can explain the disconnect between Fairfax’s past performance (top-tier) and its valuation (bottom tier)?
To be fair, as we learned earlier in this post, Fairfax’s stock price has been one of the top performers over the past 5 years. So investors clearly have been warming to the company. However, even with the strong performance in recent years, the stock’s valuation continues to be at the bottom when compared to peers. Why is that?
Lack of understanding of the company.
Fairfax is still not a well understood company. Few investors (or analysts) have followed it in recent years. Yes, this is changing. But it will take time for people to get back up to speed with the company.
Fairfax is also a turnaround. And turnarounds are exceedingly hard to value - especially at the point when their business results hockey stick and turn higher.
The interesting thing with Fairfax though is the turnaround was actually completed back in 2021. But because the company was not followed back then pretty much no one noticed (well, except for a bunch of investors on the investing forum ‘Corner of Berkshire and Fairfax’).
Operating earnings and the future.
Over the past 5 years, Fairfax has quietly completed one of the of great turnarounds in recent Canadian business history. Operating earnings at Fairfax have exploded - and that is not hyperbole.
Operating earnings averaged $1 billion ($39/share) at Fairfax for the 5-years from 2016 to 2020. In 2023, operating earnings were $4.4 billion ($193/share). Per share, operating earnings have increased 395% over their baseline from just a couple of years ago.
Importantly, this new level of operating earnings, around $200/share, is sustainable. This was discussed on Fairfax’s Q4 conference call. Operating earnings are considered the highest quality type of earnings a P/C insurance company can deliver. Think about what this new development means for Fairfax’s future results - earnings, ROE, book value and multiple.
What did we learn in the post?
Warren Buffett tells us that the change in book value per share is a good approximation for change in intrinsic value. Over the past 5 years, Fairfax has delivered a cumulative increase in BVPS of 117%, which is a CAGR of 17.8%. Simply outstanding. This is best-in-class performance compared to peers.
We also learned that operating earnings have spiked at Fairfax by close to 400% over the past 3 years from $39/share to about $200/share today - and that the higher amount is durable. This suggests Fairfax should be able to continue to deliver top-tier performance when compared to peers in the coming years.
We also learned that Fairfax currently has the cheapest valuation - its P/BV is 1.09 and its PE is 5.9. Fairfax’s valuation is significantly below peers.
So an investor today is able to buy the top performing P/C insurance company - with among the best future prospects - at the cheapest valuation. In short, the risk/reward set-up for Fairfax has rarely looked better. I think that guy in Omaha would call Fairfax a very fat pitch.
"The way of the successful investor is normally to do nothing -- not until you see money lying there, somewhere over in the corner, and all that is left for you to do is go over and pick it up." Jim Rogers
-
13 hours ago, Cigarbutt said:
That's a point that needs to be underlined.
-Short version
FFH's underwriting has improved and this improvement can be seen in reported numbers and more can be inferred to support the conclusion that future underwriting results are likely to surprise, positively, overall, over the next 5 years.
-Longer version
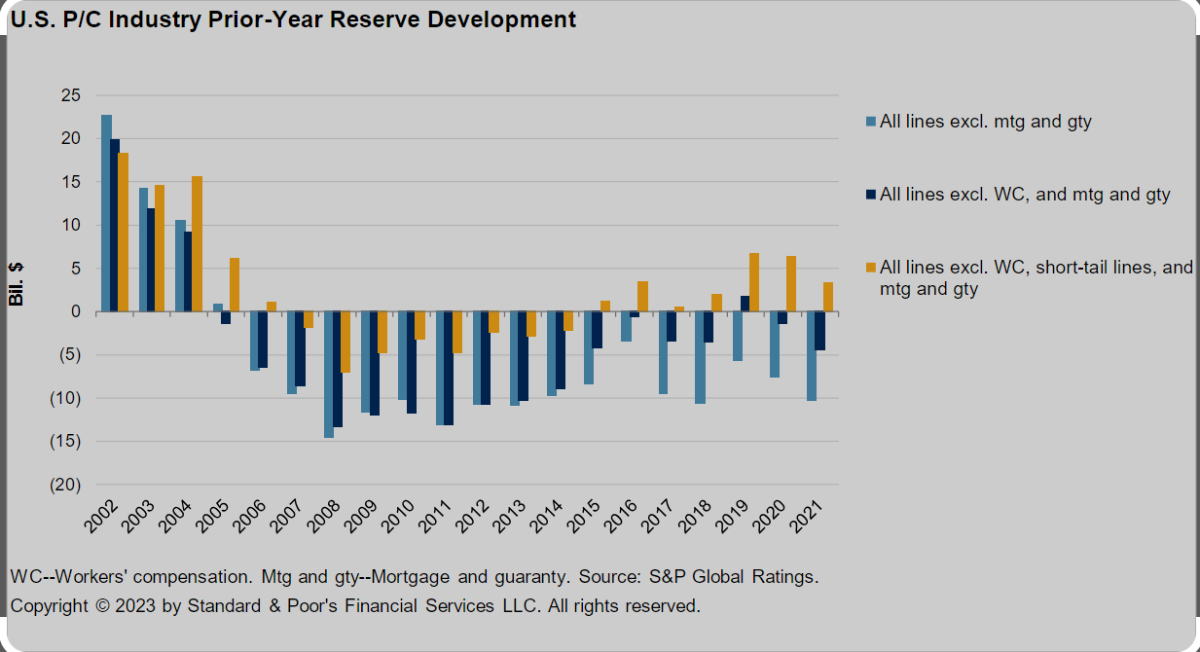
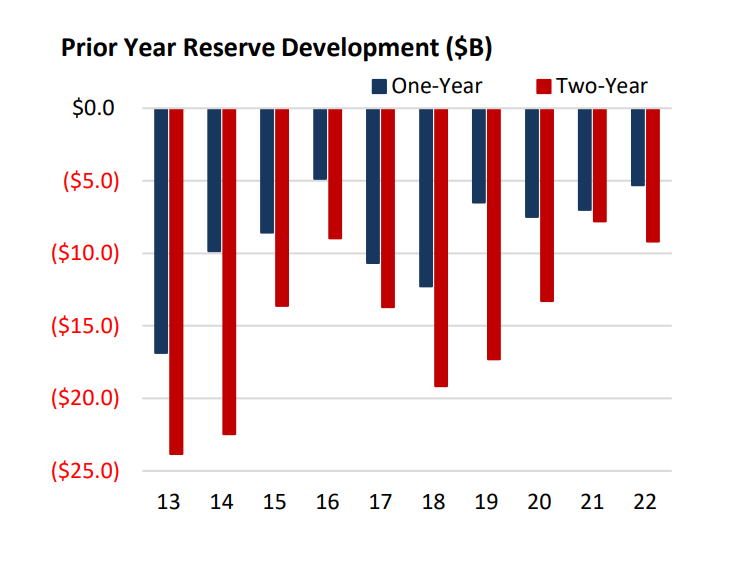
This has been discussed before (a few years back in these pages and with you at times...). Here are two pictures. The first is the reserve cycle which is tied to the underwriting cycle.
This is a longer term graph which includes US P/C (relative proxy for world P/C) and which shows how reported combined ratios eventually benefit from reserve releases a few years after a hard market has started and how the opposite occurs after a soft market. Opinion: for FFH with their insured lines profile, their comparable industry follows more the yellow bars, bars which should be compared to FFH's actual results (see below).
Here's another with 2022 results (from NIAC, US P/C):
So more of the same and a significant adjustment needs to be made for workers comp which, at the industry level, has seen a very unusual and high rate of reserve redundancy for a few years including more than 6.6B for 2022, thereby indicating otherwise a recent net adverse development pattern. Note: FFH writes WC policies but the proportion is much less than at the overall P/C level. If avid for details, one can go through their IFRS and otherwise appropriate disclosures and dissect the reserve development pattern at Zenith. Spoiler alert: this additional work does not materially change the conclusions from this post.
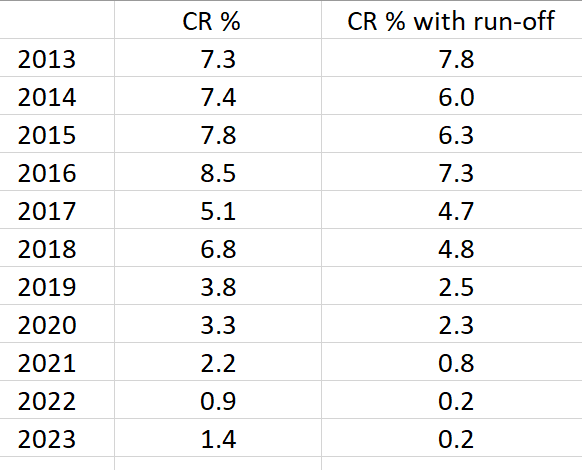
Here's from FFH:
The first column is reported directly and represents the CR % points of reserve redundancy at operating subs. The second column requires some basic math and includes the run-off earned premiums and reserve development there also. Several aspects stand out but the main point is that FFH's pattern of reserve releases has been more or less parallel to the industry but better (few % points overall), is likely to improve over the next few years as the market turned around 2018-9 as more recent positive float reserve development will more than compensate older negative float reserve development. The big bonus though (and possibly underestimated and presently unrecognized?) is the fact that FFH grew their premiums very opportunistically, compared to peers. This means that the expected reserve releases over the next few years are likely to surprise to the upside and it's helpful to remember that, for a company writing at a ratio of premiums to equity near one, each one % point of improvement in the reported combined ratio, which includes the accident year combined ratio (which is expected to be reported at slightly to moderately below 100, on a net basis, over the next five years) and the reserve development CR %, corresponds to a pre-tax one % point of improvement in ROE.
Technical stuff related to the above Excel table:
-the 2023 result in the second column is likely correct or close to correct but this needs to be checked with the release of the annual report
-in Q4 2023, 0.7% of CR was released at operating subs, for a total of 1.4% for the year, perhaps putting some weight to the hypothesis that the trend for gradually higher reserve releases may have started to turn to the upside for the quarters to come...
@Cigarbutt thanks for your post. I am not an insurance analysts so i really appreciate the detail you provided in your post. Rather, i am a generalist and i develop a thesis (perspective) based on what i learn over time. And than i constantly adjust my thesis as i get new information.
I remember when Fairfax was buying up all the international insurers in 2015 and 2016 and thinking ‘old Fairfax’ buying shitty insurance companies… Yes, my ‘thesis’ at the time was completely wrong.
The reality is Fairfax built out their international platform at the perfect time… AIG and others were looking to shed P/C insurance assets. Great strategic move for the company. The fact they were able to do this when they were bleeding money from the equity hedge/short positions is pretty amazing.
Fast forward to today and international is delivering a solid underwriting profit and looks poised to possibly be a growth engine in insurance for Fairfax in the coming years.
-
Not sure if this has been posted before (it is from Feb 14). Great take-down of MuddyWaters.
MUDDY WATERS ATTACKS FAIRFAX WITH UNFAIR FACTS
https://iansbnr.com/muddy-waters-attacks-fairfax-with-unfair-facts/ -
1 hour ago, StubbleJumper said:
To be worth 1.5x BV, effectively, you need to argue that the long-term ROE on a going-forward basis will be high enough. We know that the first dozen years of FFH's existence were characterised by an absolutely ridiculous run of consistently high growth in BV (see the table on page 20 of Prem's annual letter from last year). But following that start-up phase that began in 1986 and ended a dozen or so years later, there has been a period of about 20 years with much less convincing growth in BV. And then there's been the past 3 or 4 years.
It's really interesting to take that table that Prem publishes every year and monkey around with it a bit. Erase 1986 and 1987 on the argument that you can't "start up" twice and then recalculate compound annual growth. Break the series into the growth phase from 1986-99 and the lacklustre phase from 2000-2019 or 2020, and calculate the compound growth rates for each of those phases. When you do this exercise, you might view the 17.7% historical average growth in BV on that table in a somewhat different light and you should certainly question whether that series can be replicated going forward.
That then leaves the really difficult task of guessing what all of that means for the future. My take is that the economics of the insurance industry will not allow FFH to routinely achieve its bogey of 15% growth in BV on a going forward basis. I'd be happy if they could grow BV by 12%, but suspect that it may be more like 10% over the long term. That's not a knock on FFH, it's just a tough industry. If they actually do routinely achieve that 15% goal, I'll be the happiest guy around.
But, turning to valuation, if you pay 1.5x BV for something that grows its book by 15%, you are basically getting a 10% earnings yield with relatively rapid growth. But, if you paid 1.5x BV and FFH grows BV by 10%, you are getting a 6.7% earnings yield and decent growth...and I'd say you'd have slightly overpaid, but not terribly so if the earnings are rock-solid, regular and predictable (in other words all of the things that the insurance industry is not!). At this point it's trading at a shade over 1x BV, which means that the market finally figures that FFH is worth more alive than dead (ie, if it trades at <1x BV, in theory it's worth more dead than alive, so just break it up, sell off the pieces or run them off, and give the proceeds to the shareholders!). I'd say that it's definitely worth 1.2x but I guess we'll see over the coming months whether the market agrees with that. Maybe it'll rattle off 8 or 10 years of fabulous returns that will make me think it's worth 1.5x? Time will tell....
SJ
Great conversation @StubbleJumper and @Cigarbutt . I think trying to model ROE more than 5 years out is largely a fools errand (i.e. the next 10 or 15 years). However, i think ROE can be modelled over the next 3 years and perhaps over the next 5 years with some accuracy. This is true for any company, including Fairfax.My guess is Fairfax has an excellent opportunity to deliver 15% ROE (on average) for each of the next 5 years. Why?
1.) As Buffett teaches us with the Aesop fable, the size, timing and certainty of cash flows are the three key variables. Fairfax will be earnings an enormous amount over the next 5 years ($20 billion?) - and we now have a high degree of certainty on this.
2.) Fairfax is on a 6 year ‘hot streak’ when it comes to capital allocation. Financial markets have experienced wicked volatility over the past 4 years - active management matters a lot in this environment. Please re-read 1.) and add the effects of compounding.
3.) It looks to me like Fairfax has been upgrading the quality of its insurance businesses. This suggest underwriting profit is likely to surprise to the upside moving forward (like it has in 2022 and 2023).
4.) Fairfax has been aggressively upgrading the quality of their massive $17 billion equity portfolio for the past 6 years and the benefits of this are just starting to hit earnings. Historical numbers don’t help with this bucket - they misinform an investor.
5.) Fairfax’s $43 billion fixed income portfolio is perfectly positioned for the next few years and the benefits of this are flowing into earnings.6.) Fairfax has been incubating holdings on its balance sheet for years (and decades). These will be monetized at the appropriate time and the company will book significant one time gains. Lumpy. But lumpy doesn’t mean they don’t exist.
None of the 6 points above are being reflected in the current multiple. I think that’s crazy. As an investor, i love it.
If you want to look out more than 5 years you are really making a call on management and their capital allocation skills. Are they good? If so, how good?Today most people on this board are now saying “yes, earnings look good for the next 3 or 4 years BUT it can’t possibly continue over the long term.”
With the stock trading so cheaply today it suggests Fairfax’s ROE will be poor in 2024, 2025, 2026 and every year after. IMHO, that is a massive disconnect from reality.
-
On the valuation front, i continue to think that Fairfax today is still crazy cheap. 1.08 x BV and a ‘normalized’ trailing PE of around 6.4
Over the past 3 years what was the big miss from investors? Investors grossly underestimated the rapidly improving earnings power of the company.
What is the big miss from investors today? It looks to me like investors are now grossly underestimating the power of compounding over time.
Compounding is probably the most important concept in investing. The fact it is getting zero attention when people discuss Fairfax tells me volumes about investors mindsets. You also see it in analysts forward estimates (pretty much all have earnings falling at Fairfax in the coming years).
And i love it.
—————
Most investors missed investing in Berkshire Hathaway 30 or 40 years ago. They knew what Berkshire Hathaway was earning. And they knew Warren Buffett was an above average capital allocator.
What was probably the biggest single reason they didn’t invest (or sold their shares too soon)? They didn’t understand the power of compounding.
-
It can be useful to look into the past. 13 short months ago i put together my estimate for 2022YE. It was dominated by investment losses (bonds and equities). Thank god for the pet insurance sale.
The more interesting forecast on the chart below is the estimate for 2023. At the time it looked crazy high. And of course, it has now been proven to have been crazy low.
What are some of the lessons looking back on the 2023 forecast?
1.) Valuing a turnaround is tough.2.) It is important to keep an open mind - when the facts change… update the model.
3.) Don’t get trapped by dogma (things that ‘have to happen’).
Fairfax 2024
in Fairfax Financial
Posted · Edited by Viking
@gfp good question. I have some questions of my own as to how Eurobanks dividend will flow through Fairfax's income statement and balance sheet when it starts.
But before I get into the accounting, here is a general thought. I am hoping Fairfax continues to grow the 'interest and dividend' bucket. I think it is generally viewed by investors to be the most important income stream for a P/C insurer (with underwriting profit being a close second) because it is usually not very volatile year to year. As more of Fairfax's earnings come from 'low volatility' sources we should see multiple expansion.
My assumption is when Eurobank starts paying a dividend it will drop into 'interest and dividends' for Fairfax. If this is not the case, someone please let me know. As I have said many times before, I am not an accountant - so there will be errors in how I look at things. And that is a real strength of this board - we are all to learn from each other and improve our understanding/analysis.
What happens to 'share of profit of associates' for Eurobank? Is this number each quarter affected by the dividend payment? The short answer is I don't know. Perhaps you or someone else can enlighten me?
Is share of profits of associates an income statement item (share of pre-tax net income)? And the dividend a balance sheet item (return of capital)?
My understanding is Fairfax's carrying value for Eurobank will get updated each quarter as follows:
If this is not accurate, please let me know.
The other question I have regarding the Eurobank dividend is, once approved, how will it be paid out... quarterly? or will it be in a lump sum?
Thanks again for the question.