Cigarbutt
-
Posts
3,373 -
Joined
-
Last visited
Content Type
Profiles
Forums
Events
Everything posted by Cigarbutt
-
Which activities in life brings you the most fun?
Cigarbutt replied to Charlie's topic in General Discussion
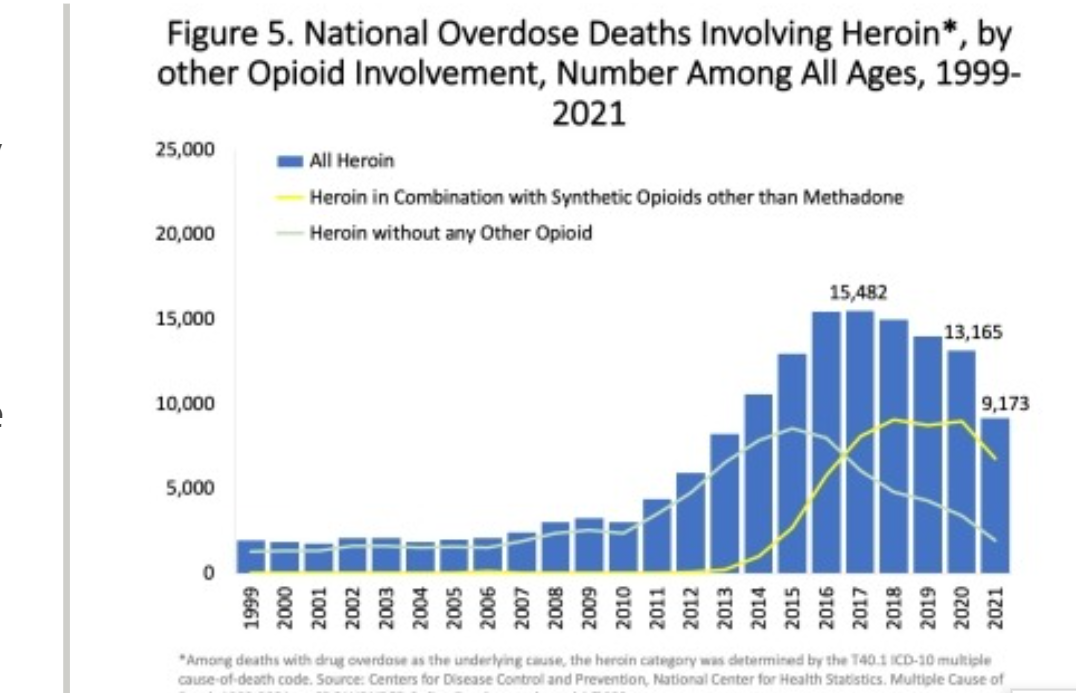
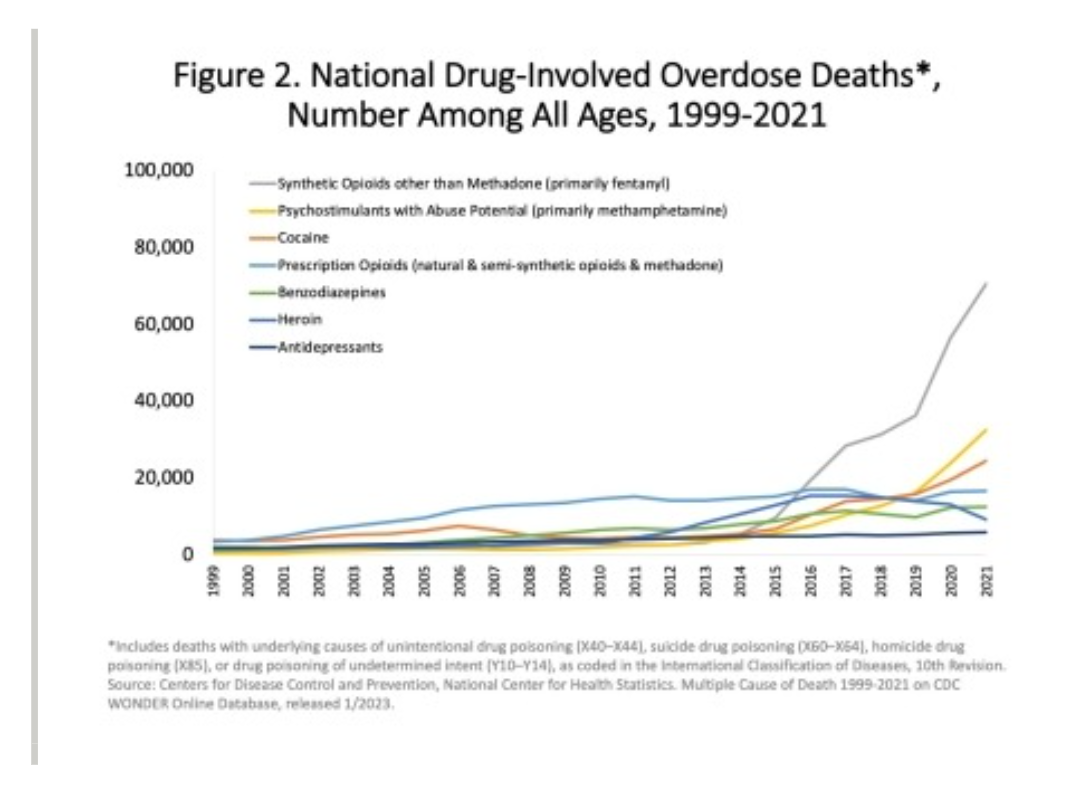
What a disturbing movie which shows extremes of pleasure as well as extremes of hardship (maybe not a totally balanced view with even some tendency to glorify drug use?). The toilet scene/metaphor is...interesting, even enough to have an olfactory hallucination with nausea just from watching... Anyways, it's not clear what you mean by history repeating itself (heroin overdoses as an essential cause of death has come down lately with deaths for 'synthetic' opioids, especially fentanyl showing a rising trend with no signs of slowing down). US data: ----- Anyways, lately, it's been possible to come up with synthetic alternatives that are highly potent (both ups and downs) and that seem to connect very strongly with pleasure/fun brain centers which derive from a long evolutionary process (to survive, reproduce etc) which did not 'forecast' such an option in nature. i guess 'we' will eventually adapt. ----- Anyways most people posting in this thread seem to go for more measured forms of fun.
-
Which activities in life brings you the most fun?
Cigarbutt replied to Charlie's topic in General Discussion
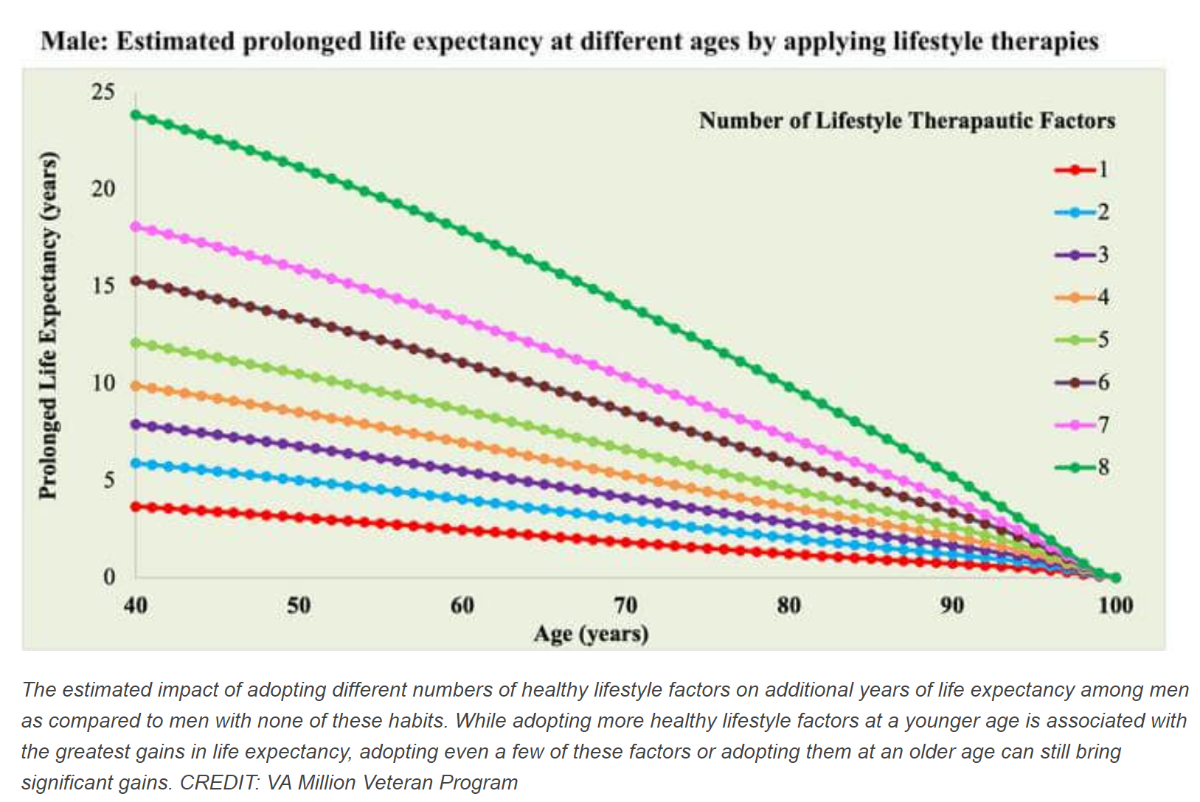
i sense that you want to conclude this sub-discussion in a decent way but your last comment underlines that fun activities are a form of compromise. You may find interesting that there is data that help to quantify the "price" paid for fun. There is that recent Veteran study that suggests (along the line of basic lifestyle changes that you mentioned earlier) that combining 8 lifestyle changes at age 40 could result (likely overestimated to some degree because of study methods) in a close to 25-year increase in lifespan (also healthspan to a large degree). So this kind of data can be used to estimate the 'price' of periodic hangovers. For example, using the following graph, the third line from the bottom (in purple) corresponds to the potential incremental gain in years (lifespan) if periodic binge drinking does not occur. Of course, hangovers can occur with 'reasonable' drinking (quantity and frequency) so that the number of years lost from periodic moderate hangovers after 40 is about 1-3 and, after 60 about 1-2 and maybe the pleasure of occasional alcohol relative over-consumption is worth it?
-
Which activities in life brings you the most fun?
Cigarbutt replied to Charlie's topic in General Discussion
You are correct. Even if a peripheral issue, i apologize for the potentially misleading part of the graph (for the topic discussed) as i did not appropriately look at all aspects before putting the graph as a reference. There was no conscious intent and, as explained, there are potential reasons for the part of the graph that can be found distracting and less intuitive. Many people studying this issue ((dis)ability component of health) have an interest in sports physiology and training. Typically when looking at performance, you get something like this (here is long jump but you get a similar phenomenon in all athletic sports, especially those with a large aerobic component ie long distance running): As you can see, the shape of the curve is similar to the one i had included in the initial response. This additional info does not negate the fact that you pointed out correctly that there was an inadequate part in the info i provided. PS One of the things in life that brings me the most fun is to be proven wrong, thank you.
-
Which activities in life brings you the most fun?
Cigarbutt replied to Charlie's topic in General Discussion
The graph is derived from more solid data starting from age 40 and older. The slope of the graph line for those aged 40 and less is sometimes depicted as horizontal. For the younger age groups, the line is more conceptual than factual and depends on definition and the way data is collected (surveys, longer term follow-up etc). For example, if healthspan is defined as disease- and disability-free and if you include walking speed and the amount of weight one can carry for the ability component, one can reasonably conclude that the score would tend to increase during development (early years). Anyhow, i think it's a moot point. ----- Anyways, the idea of this thread is to have fun and, if high levels of physical activity, strict diets and living like a monk are not your thing, it's been shown that increasing step counts in increments of 500 is associated with a significant reduction in cardiovascular mortality both in men and women, particularly in older age groups. To each, his/her own. ----- Personal note. It's also been shown that moderate to high intensity exercise can be useful although the health benefit is less clear. Then it's a matter of personal taste. This AM, i went for a 214-minute intense activity and my wife just invited me to go play tennis which is likely to be intensely fun, although slightly less physically demanding. -
Which activities in life brings you the most fun?
Cigarbutt replied to Charlie's topic in General Discussion
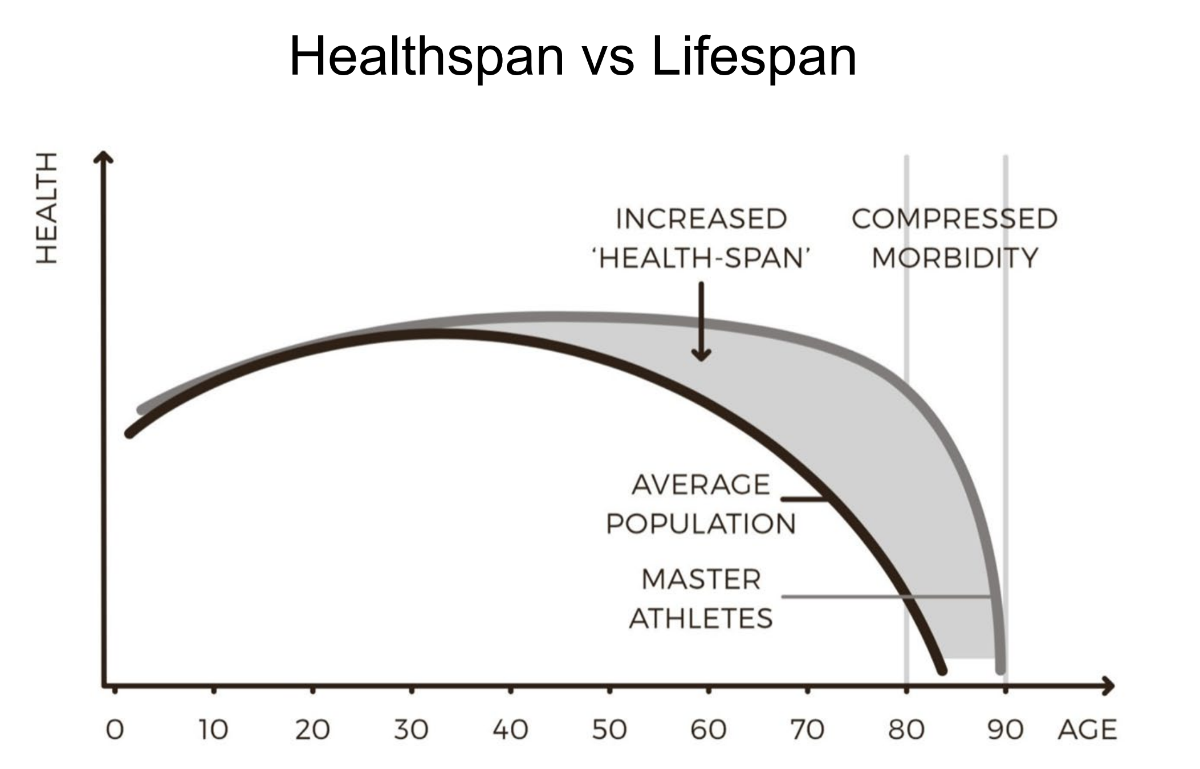
Yes, there is a lot of data that confirms this: -Simple things can make large differences over longer periods, especially on a cumulative basis (similar to compounding of retained earnings) -The return on basic lifestyle change investment very likely shows a diminishing return on incremental effort/focus and it's unclear if going into 'fancy' methods does any good, as an independent variable An interesting aspect is that not only is lifespan lengthened by 10 to 15 years but this longevity gain likely correlates strongly with healthspan too. Simplified graph supported by good data, peer-reviewed and reproduced in different contexts etc: There is a 'natural' experiment going on now that also supports these conclusions. Cancer rates in younger cohorts are rising which is too bad because cancers occurring in younger people tend to be more aggressive. The rise in cancer rates is linked to many variables but adverse lifestyle changes very likely have been contributing to this unfortunate development. So i guess there are at least some areas where being a contrarian is a good investment strategy but sometimes one has to be patient? The human brain is so much geared towards immediate satisfaction. ----- Personal note: i played a softball game tonight and was the oldest person on the field (excluding umpires). There is also a building amount of data showing that spending too much time in front of a screen is negatively correlated with healthspan so let's call this mental gymnastics?
-
Thank you, some kind of thirst for conspicuous status i guess. Interesting. Frankly, i don't have a clue how a more sustainable course will happen and this forum (or most online forums) may not be the ideal place for such discussions. Also, i did my fair share (mostly elsewhere on the net) of patient/polite opposition to people calling names without substance when dealing with referred 'facts' such as Alex Berenson's pieces about covid. Anyways. ----- The main idea of recent posts in this thread (which may be relevant to you?) is a framework i have to set up within the next 5 to 10 years whereby, after some kind of amount is left aside (for others; no conspicuous virtue signaling here ), i wonder what number to use as a quasi-automatic safe withdrawal rate as i believe this should be a dynamic number, not the typical 4% used. i'm trying to find out a way to make it easy to adjust the rate up or down depending on market conditions.
-
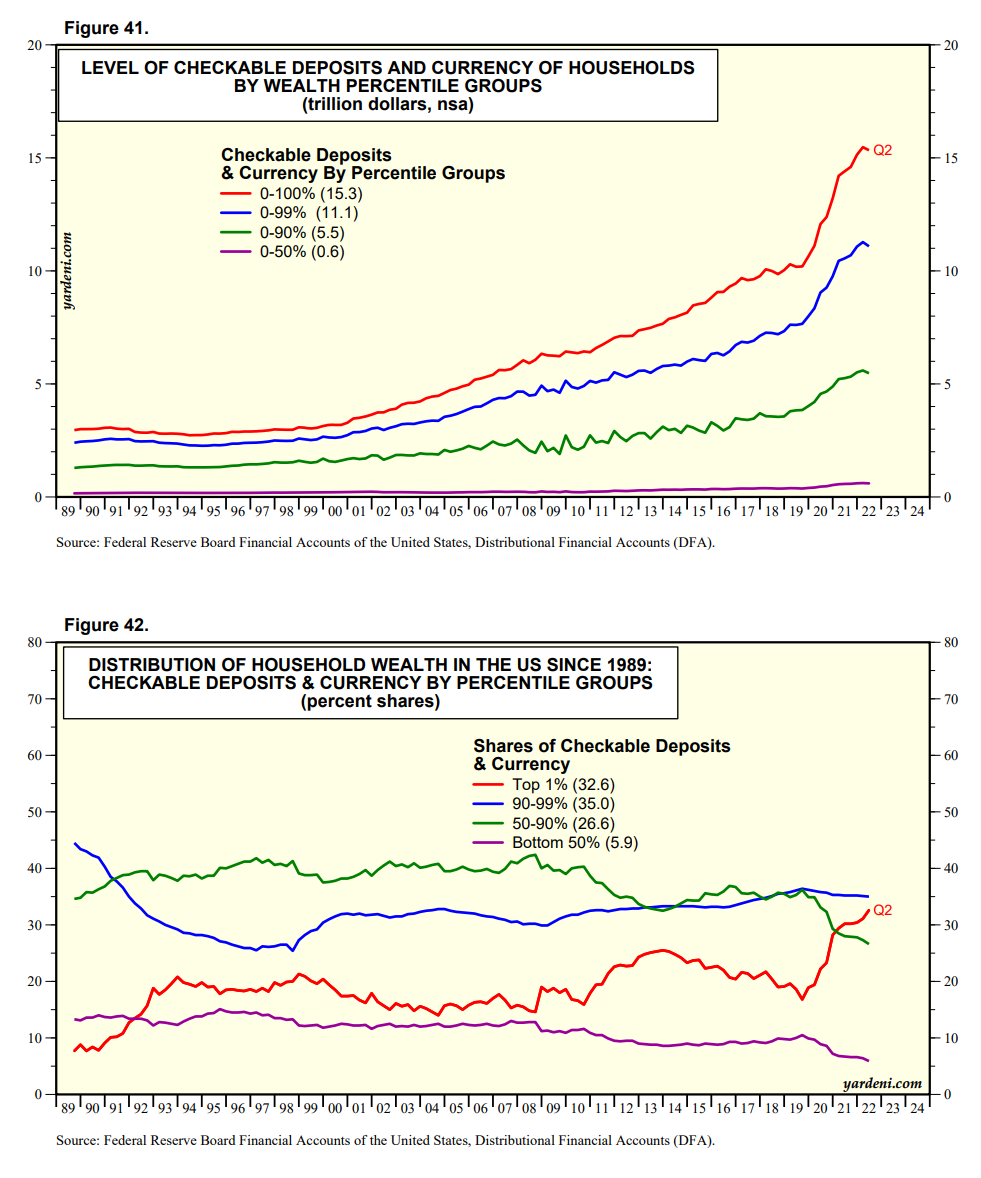
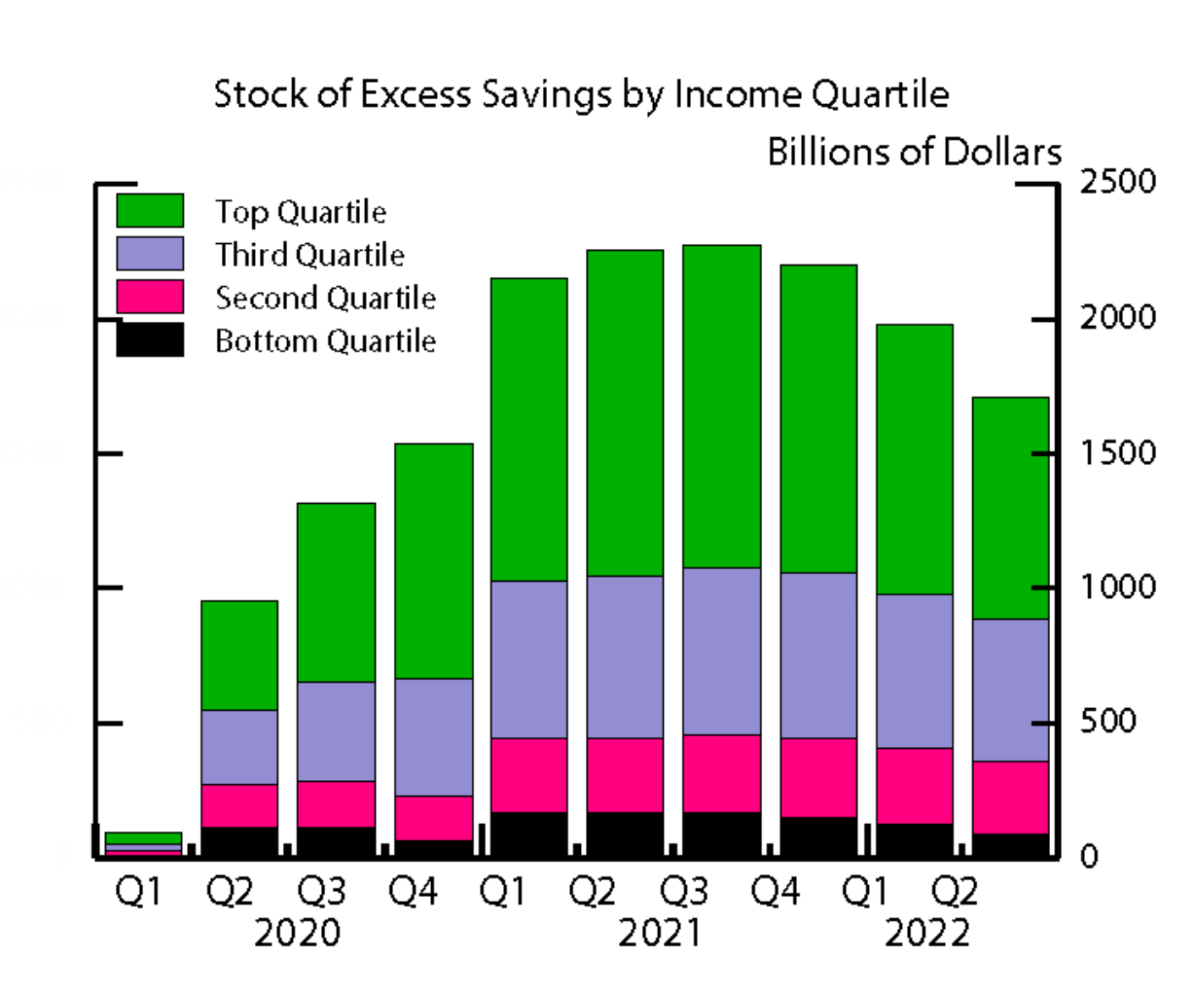
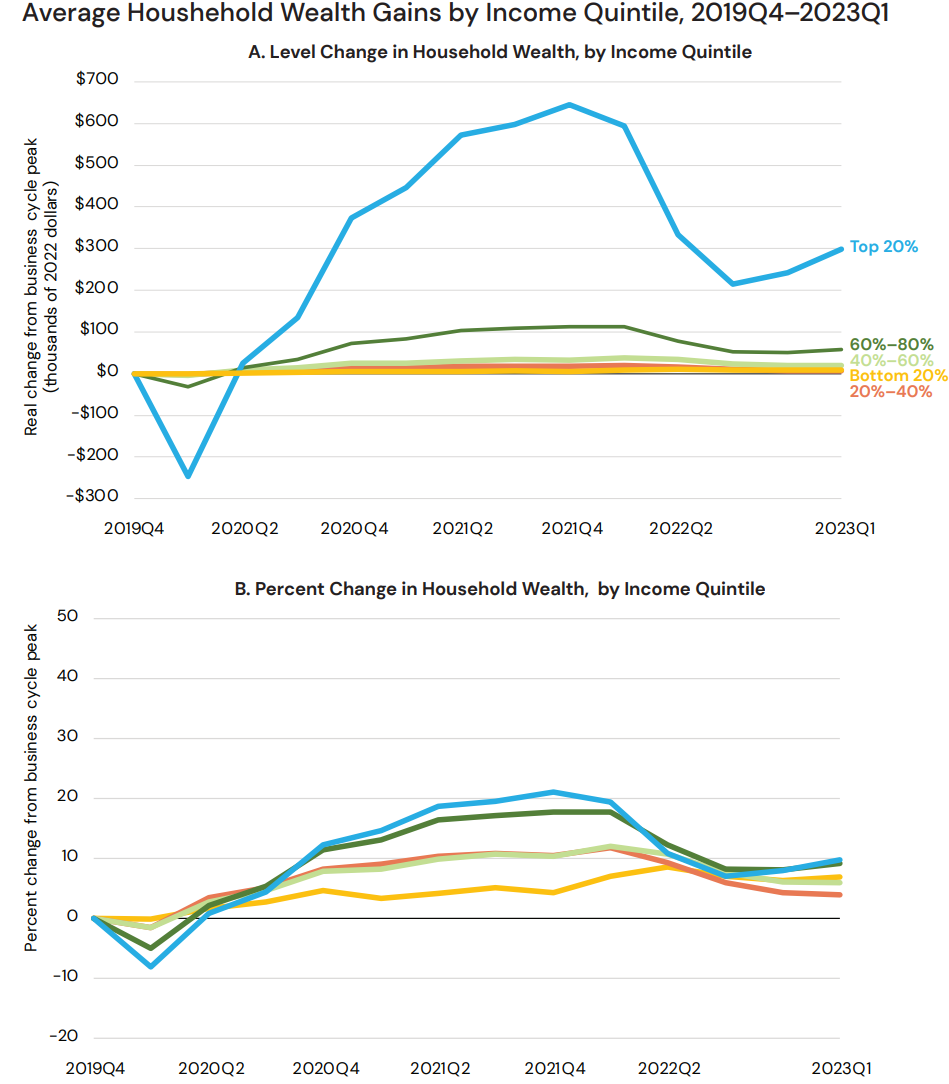
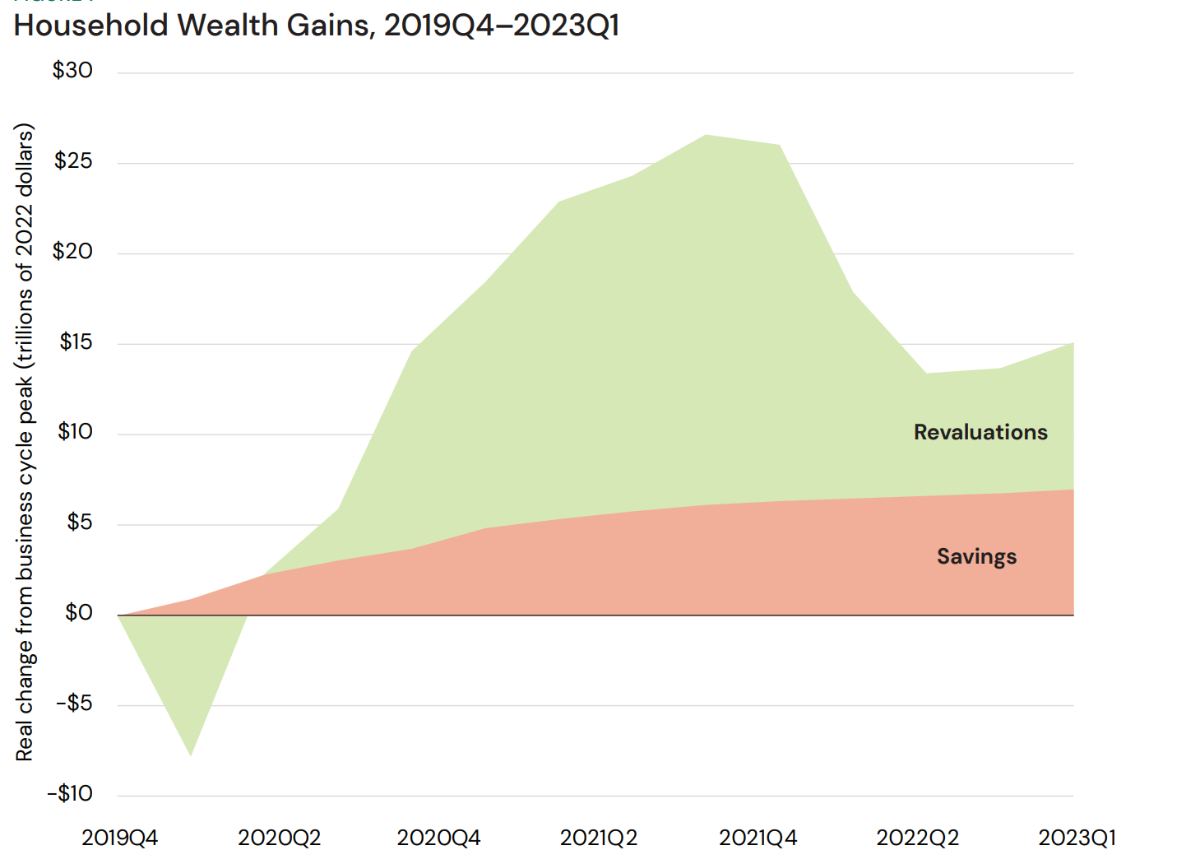
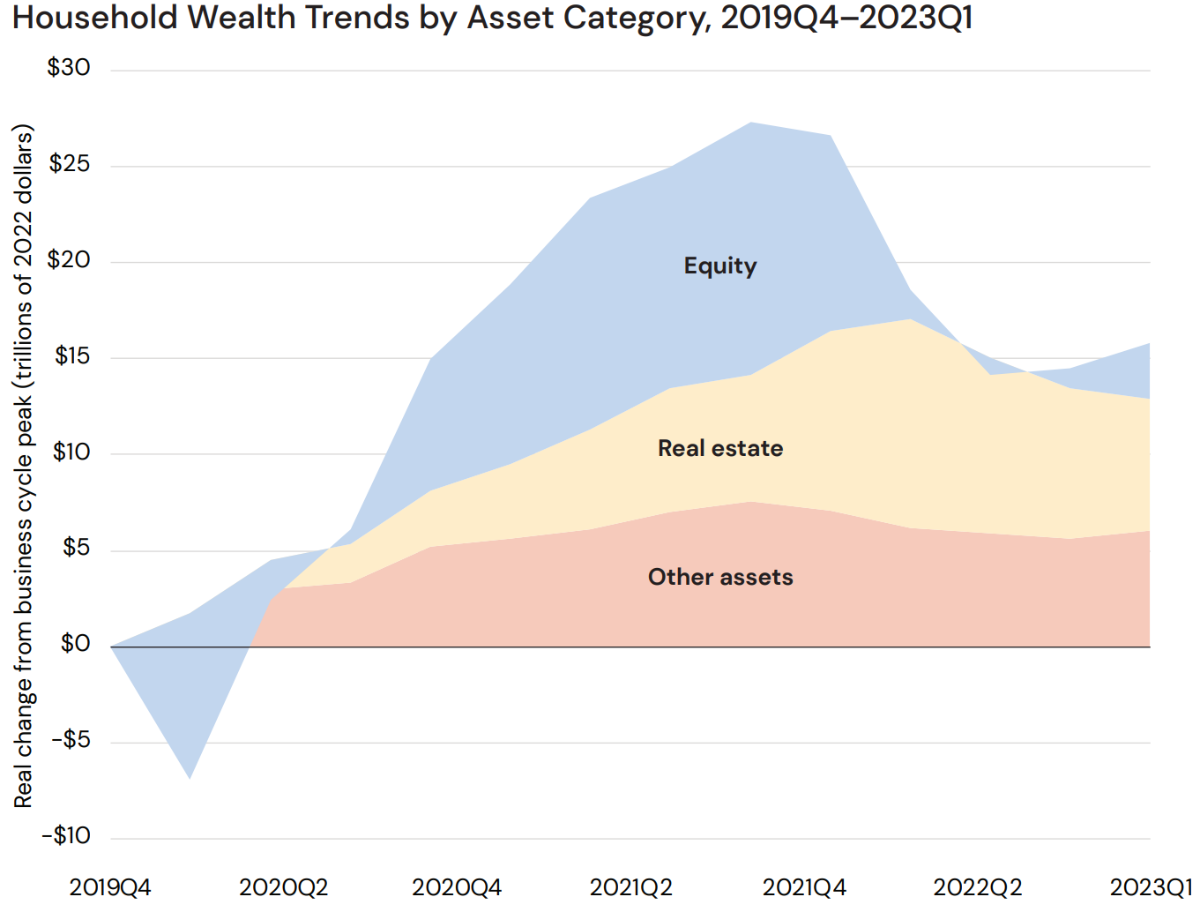
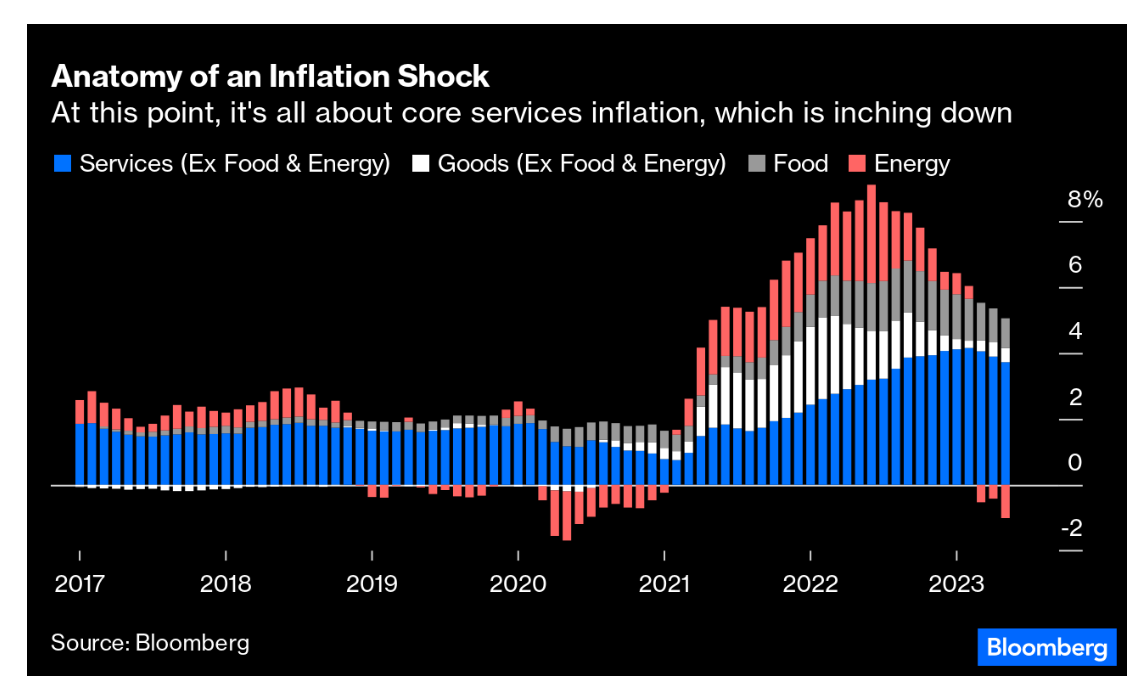
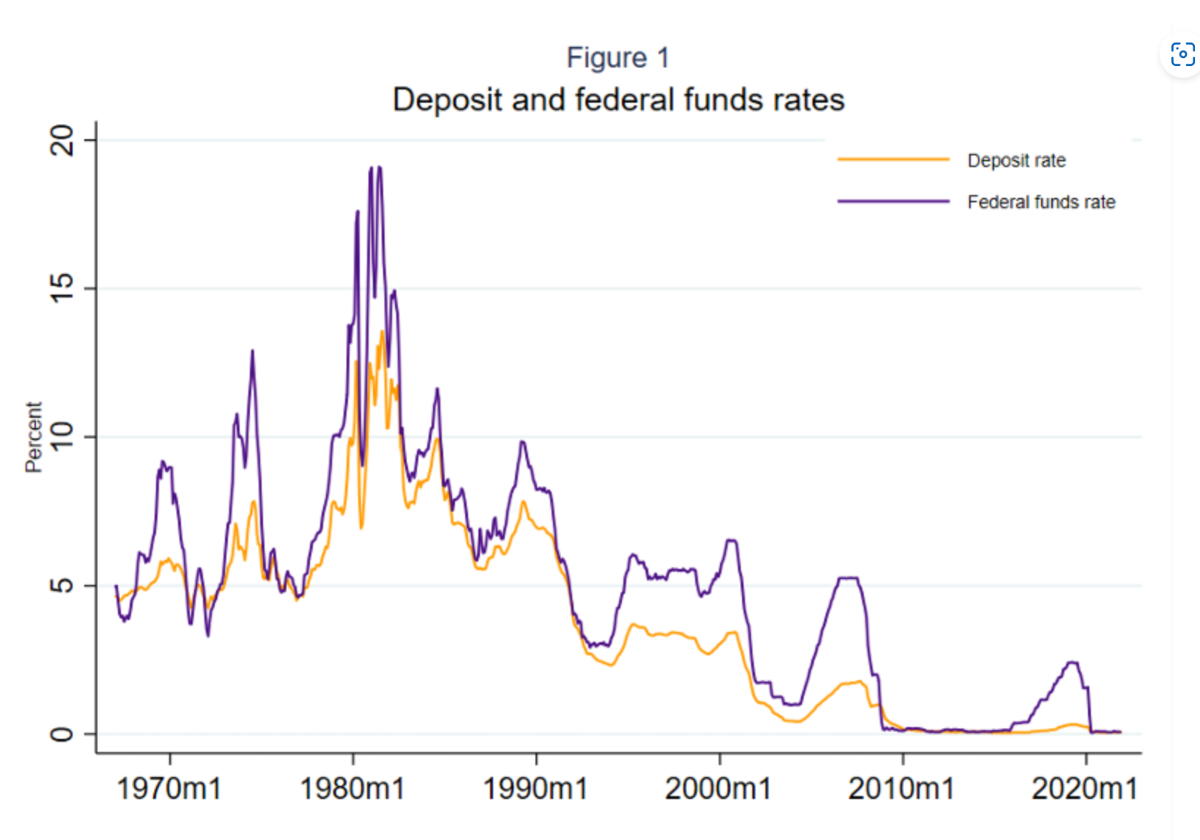
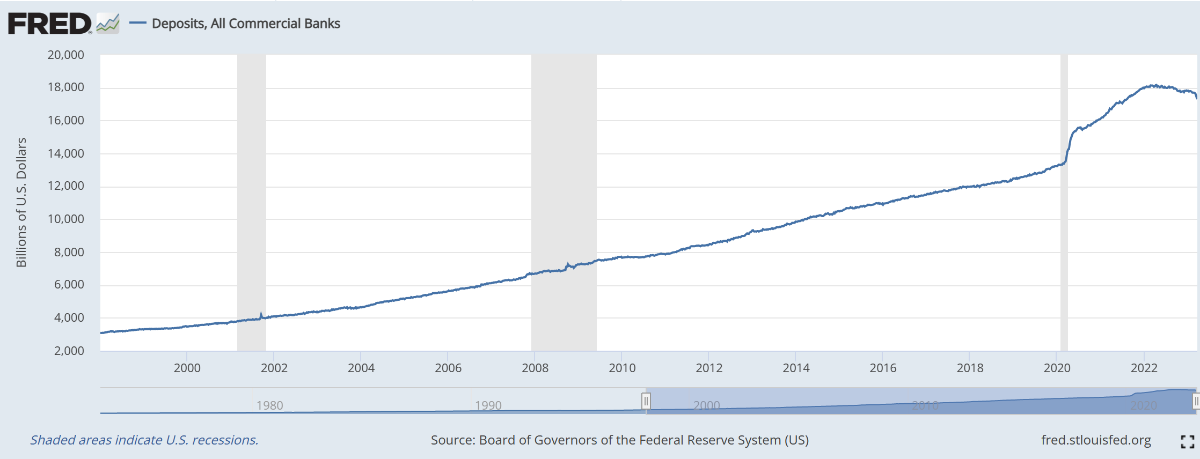
@james22, your references are interesting but it's unclear what you're getting at. If applicable, can you add a sentence or two like if you'd try to explain to a five-year old which is basically my potential level of reasoning? ----- The following is not (necessarily) about doom and gloom and it's impossible (opinion) to forecast the economy but if one uses the 'healthy' balance sheet of main street consumers as an underlying assumption, there are factual aspects that suggest an unsustainable trajectory. Short version: For some time and accelerating peri-covid, money/deposit growth has uncoupled from underlying fundamentals. Real loan growth (as a source of money/deposit growth) has been coming down since the GFC (negative for some months now) and has been supplanted by 1-QE and 2-commercial banks expanding their balance sheets with government debt securities with a pattern, since 2020, that is quite comparable to what happened to finance WW2 (think about that for a minute). The deposit levels have grown (especially the uninsured kind) mostly as a result of the Fed-Treasury coordination, ie they effectively put (printed) the deposits in the 'savings' accounts. ----- Longer version The above is simply what our great wabuffo pictured but with a longer term perspective and dissected into income/wealth groups. There is out there (opinion) some kind of misunderstanding concerning 'savings' even from the stuff coming out of highly educated Fed 'studies'. Because of the way savings is measured, it is felt and often implied that people spending less will then save more, which is obviously true at the individual level, but at the aggregate level, this does not happen. If people spend more, the money does not disappear, it just appears elsewhere as someone else's savings. Anyways. The graph above does not imply that people have been saving more (in the sense of spending less now in order to spend more later; quite the contrary in fact), the graph (once dissected) just shows that money was printed as deposits as a result of non-bank QE and as a result of the effective financing of government debt by commercial banks (asset=government debt, liability created deposit for the private crowd). So, basically, the US government went into debt ++ or 'dis-saved' (in a disproportionate way (opinion)) in order for the mass to 'save' more than needed (opinion) and make them richer. Now if this not a real-life representation of Friedman's helicopter money experiment, i don't know what is. ----- So where did the money/deposit growth come from? QE to non-banks helped garnish higher worth (money-wise) people's 'checking' balances. And commercial banks' financing of government debt filled lower worth (money-wise) (lower 40-60% especially). The excess savings concept has been circulating and the following picture (updated since then) shows the evolution of the excess savings which has started to reverse (not because people have been 'spending' their excess savings but because QE has been reversed and commercial banks' balance sheet expansion has reversed (process only starting). Now, to link with the inequality aspect (and the potentially relevant unsustainable growth aspect): And remember that the 'wealth' created is not from productive loans but from centrally planned measures used in an almost unprecedented way (except for world wars) and the private mass is richer because of borrowed money (not distributed evenly, higher worth holding (directly and indirectly) more government debt as an asset and more money as a deposit asset). ----- People may get tribal with the stimulus check debate so here's an example that may reach some kind of bipartisan nod? The PPP program was used to 'stimulate' the economy and to trickle down to the average worker and common (wo)man. The 800B program was deemed a success. More than 90% of loans were forgiven (remember that those loans were financed with government debt just like stymmie checks etc etc). It's been estimated that 75% of the funds went to the top quintile.. https://www.nber.org/papers/w29669 Personal note: In 2020, for the looking-for-profit private projects that i have going, i was able to qualify for various Canadian 'grants' (different than the PPP stuff in some ways but essentially the same underlying money-creation principles involved). These grants went pretty much to my bottom line (and my pockets!) so perhaps i shouldn't waste my time complaining here but the underlying sustainability is nagging. Especially nagging for the productive part when i think of the time spent recently on the phone (20-30 min) with a tax agency 'director' who audited an aspect of the eligibility, finally concluding (in a separate letter) that i had correctly kept the parental leave absence deduction for a specific month and for a specific employee (total amount: 3.54 $ CDN)!
-
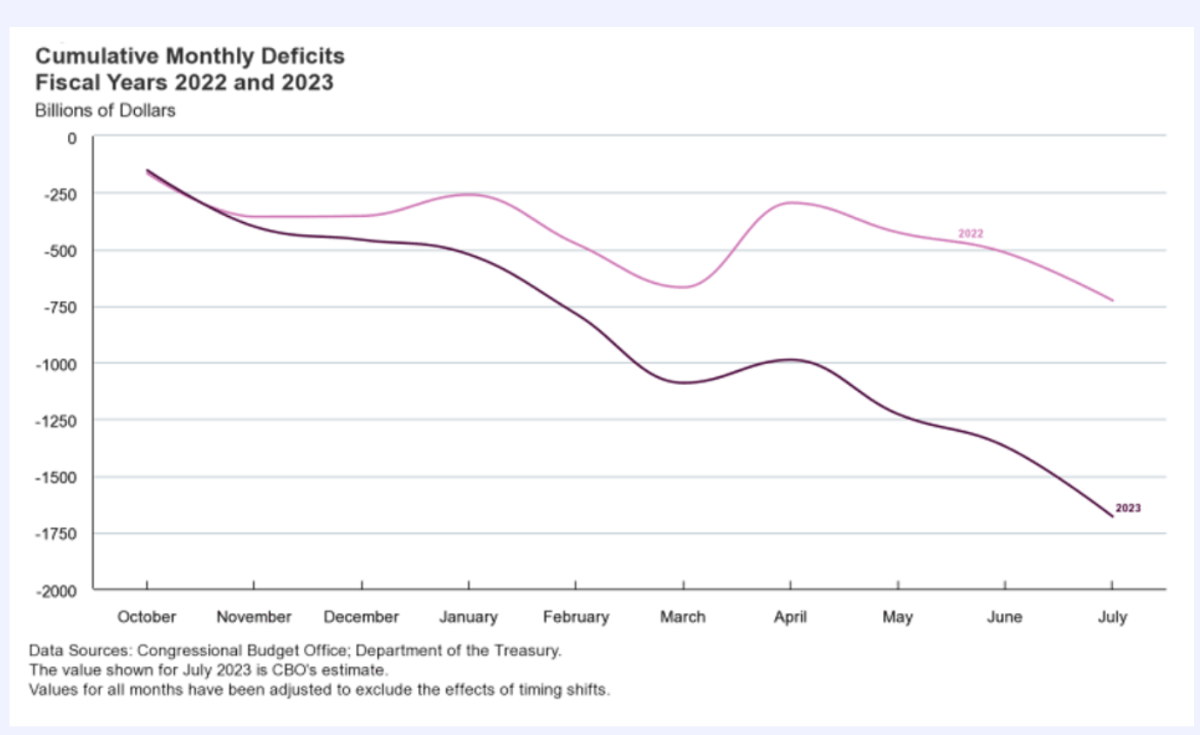
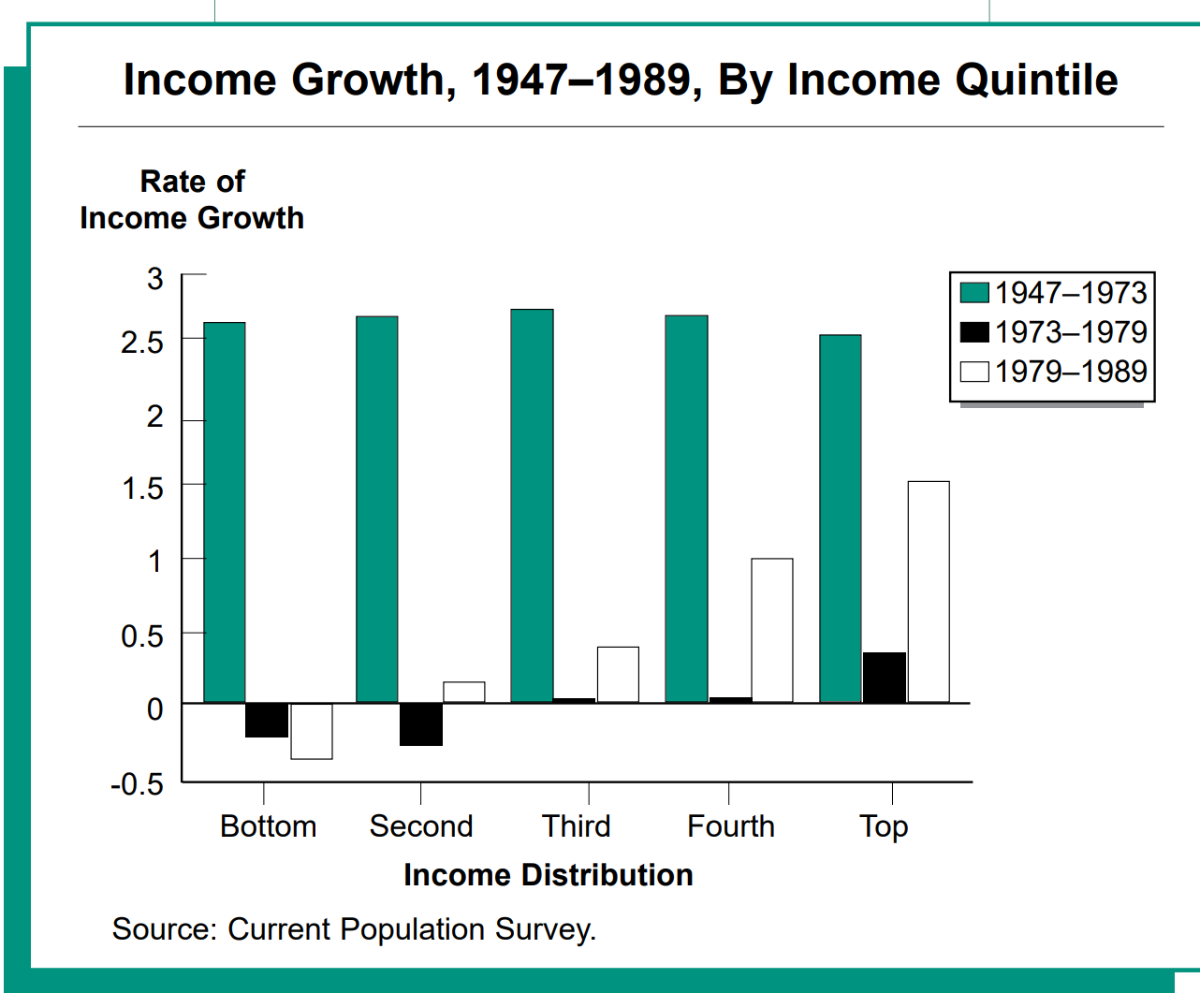
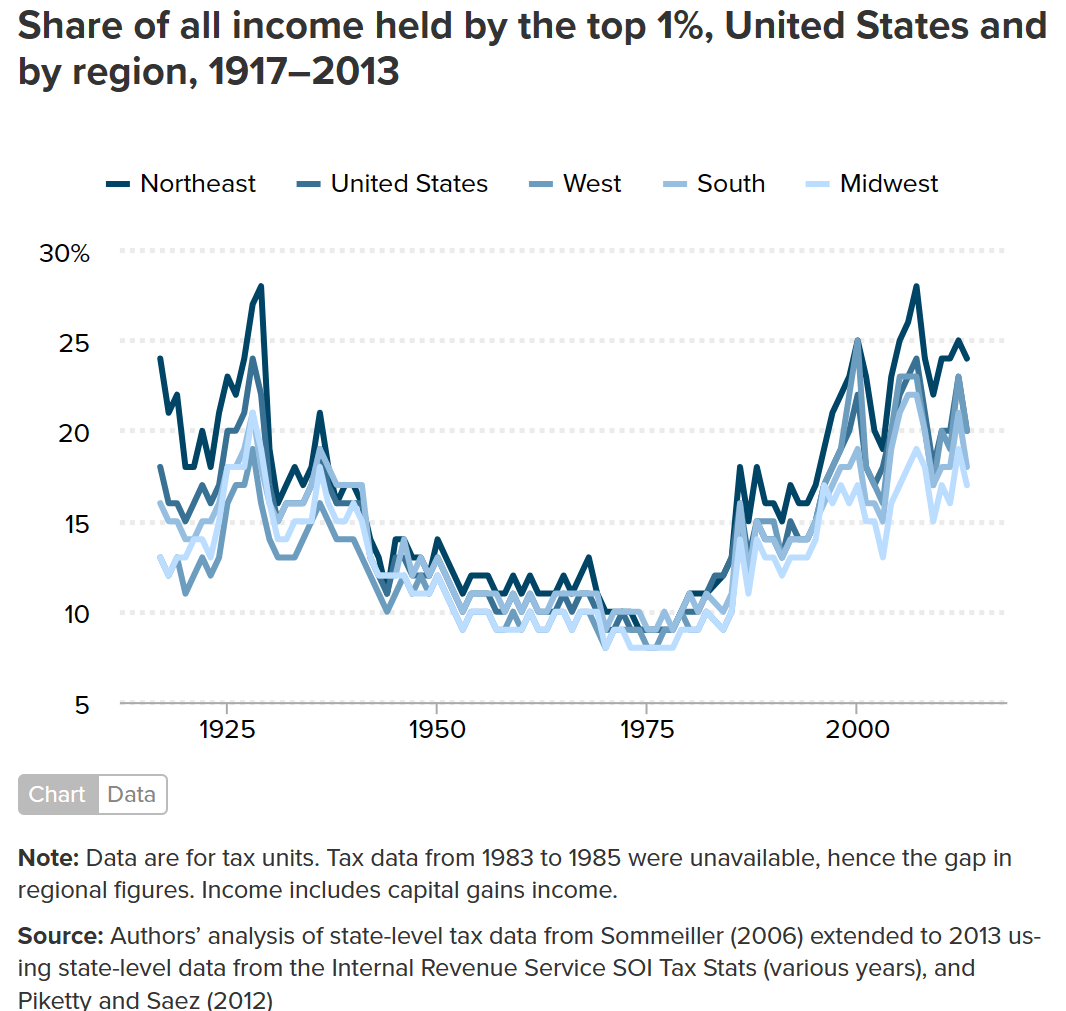
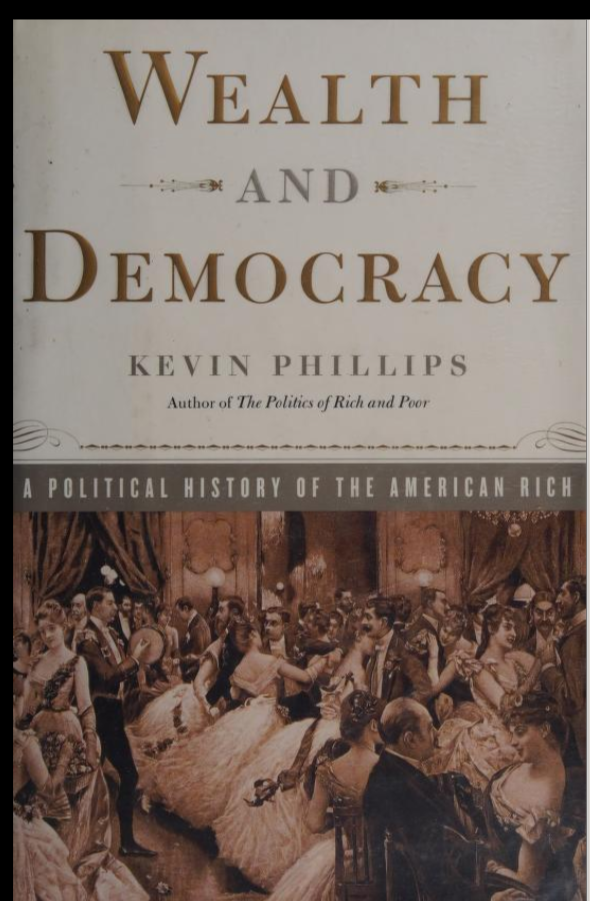
The title of the thread is about a top and a recent sub-topic is the growing difference between the top and bottom (inequality). Is there a link? Is this relevant for a post here? I will venture a yes to both questions. Inequality, like greed, is good but there gets to be a certain point when marginal returns on inequality diminish and even get negative. ----- The trigger for this post was reading some CBO material for fun (!?) quantifying that the expected federal deficit for the next fiscal year was projected to be 6-7% of GDP (incredibly unusual in ‘peace’ time, especially when economy is above its potential and when employment has reached record highs?!) and when recent budgetary details (recent but pretty much a bipartisan thing for some time) included items such as 1-the provision for $80,000 luxury sedans to qualify for $7,500 taxpayer-funded credits and 2-the notion that the Fed no longer provided large remittances from seigniorage to the US Treasury but growing a deferred asset instead. !? ----- Growing inequality is a thing. Numbers can be twisted depending on method, inclusion of transfers etc but, overall, it’s become clear that inequality has been on the rise and significantly so. Data below shows longer term trends since the WW2 up to 1989 and the trend in the last 20-30 years is basically more of the same so that now (level of inequality now) compares to the Gilded Age period (late 20th century) and the Roaring 20s. Comparison by historical analogy is a relatively weak form of analysis and can be countered by rational arguments [take the preceding post from James22 about? the expectation of a rebound in inflation based on a historical comparison (compared to the 70s), apart from basic fact-checking and reference source, Alex Berenson, ouch!] so that key underlying conditions (key ingredients) must match when comparing periods. ----- -During the Gilded Age, tremendous value/wealth was created and inequality widened with large fortunes (and associated power) on top but, for the bottom even including unskilled workers, real wages grew very very significantly. Large-scale industrialization combined with urbanization gave way to an obvious discrepancy concerning the ‘sharing’ of the wealth created but the whole pie was growing. Productivity growth was very significant. The changes were simply happening too fast. The mass formed some kind of homogenous class and, somehow, in the following decades, a better balanced growth was achieved in part due to reasonable ‘populist’ policies and a moderately rational approach from a governance point of view. Of course, wars can ‘help’, especially if on the winning side and with limited domestic damage. Still, the US came out (transformed) of the Gilded Age with still an amazing growth potential, continued to show great productivity progress and thereby was able to integrate a huge influx of immigrants to support the growth. -Another period when inequality reached today’s level was in the Roaring 20s. This was another period when productivity growth was very strong (note: this was a secular trend and, contrary to what is often thought, productivity continued to grow significantly in the 1930s). However, most of the huge wealth created accrued to the top and the wealth divide was compounded by the huge paper wealth that was recorded as a result of rising asset values (ahead of underlying economic activity). As for the period after the Gilded Age, the potential pie continued to grow significantly and another war eventually ‘helped’. Even if the root causes of the Great Depression are still widely debated, inequality in income and wealth was a key ingredient leading to the boom/bust episode. The transition period was relatively long and painful but, after some ‘experiments’ useful mostly to let market forces achieve a more balance growth, the table was set for 30 years of glorious (and balanced) growth which revealed sustainable growth in real earnings for all groups, with an additional huge positive being that private actors started the post-1945 baby boomer era with relatively minuscule debt (the rise in private debt compounded the rise in consumption that happened in the following decades). The war-time debt that the US government accumulated to finance the war became a non-issue mostly because of the overall growth of the economy as a result of the more sustainable and productive nature of the growth with also a small component of financial repression. The now period is now back at a similar level of income inequality. Key differences from the two previous periods are the lagging productivity growth and the significant rise in government debt in relation to underlying fundamentals in peace time. Since 2000, government-sponsored reflation policies have been provided in larger and larger doses and more and more pre-emptively to smooth things up with the latest covid-related episode reaching new heights. Numbers reveal that the fiscal/monetary coordination of money creation ahead of underlying economic activity has greatly contributed in shoring up the balance sheet of lower income/wealth groups but how sustainable is that? As an example of the post-2020 fiscal/monetary coordination of reflation (becoming excess reflation) as a magnified manifestation of the growing assistance done more and more pre-emptively, most of the wealth created was not from productive measures but from paper wealth linked to ultra-easy money (‘revaluations’) and the excess private savings was essentially due to the government issuing debt with the debt securities ending up at the Fed and on commercial banks’ balance sheets and with the printed deposits ending up accounts of all income/wealth groups in a bread and circus fashion. For interest the following book is an interesting read. It was published around the time of the 2000 bu**le, showing that secular timing is not an exact science. The author lays out facts, helps analyzing the inequality issue through an historical lens and mostly stays away from reptilian arguments. ----- Anyways, this too shall pass, somehow. Typically, empires get destroyed when inequality takes over but the US has tended to, somehow, go back to a more sustainable trajectory. Obviously in this kind of cycle, when times are good, the rich get richer faster than the poor (in absolute/relative terms) and when the going gets tough, the rich get poorer faster than the poor. Let the good times roll. The next transition phase may be quite interesting?
-
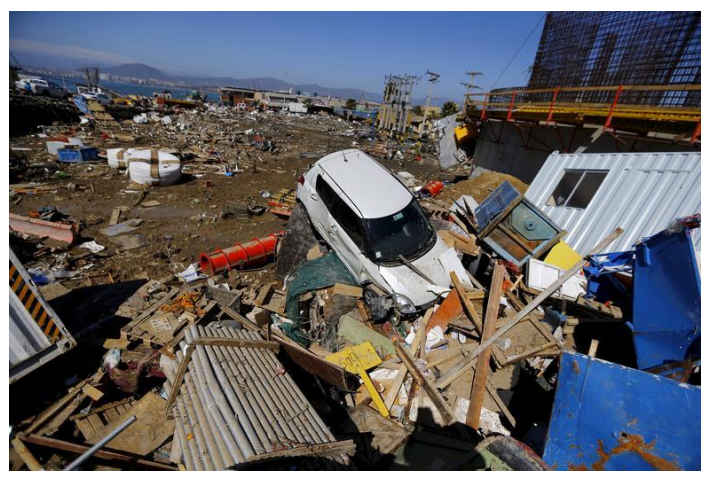
This (new derivative) seems to be related to a World Bank issue (of cat bonds and catastrophe swaps) to help Chile deal with its own issues. The cat swap seems to pay a 4.75% per year risk margin in exchange for payout risk to Chile (through the Bank). Case-Study-Chile-2023-CatBond.pdf (worldbank.org) ----- Personal note. i'm in the middle of renewing various personal insurance contracts including home insurance. During quite a lengthy conversation, i included most things in the home contract tentative agreement but somehow declined the coverage related to direct damage from an earthquake. Now seeing this picture, i'm no longer sure. Also, it reminds me that it can be a pain to hold (re)insurers when the hurricane season is about to start. Think long term, they say.
-
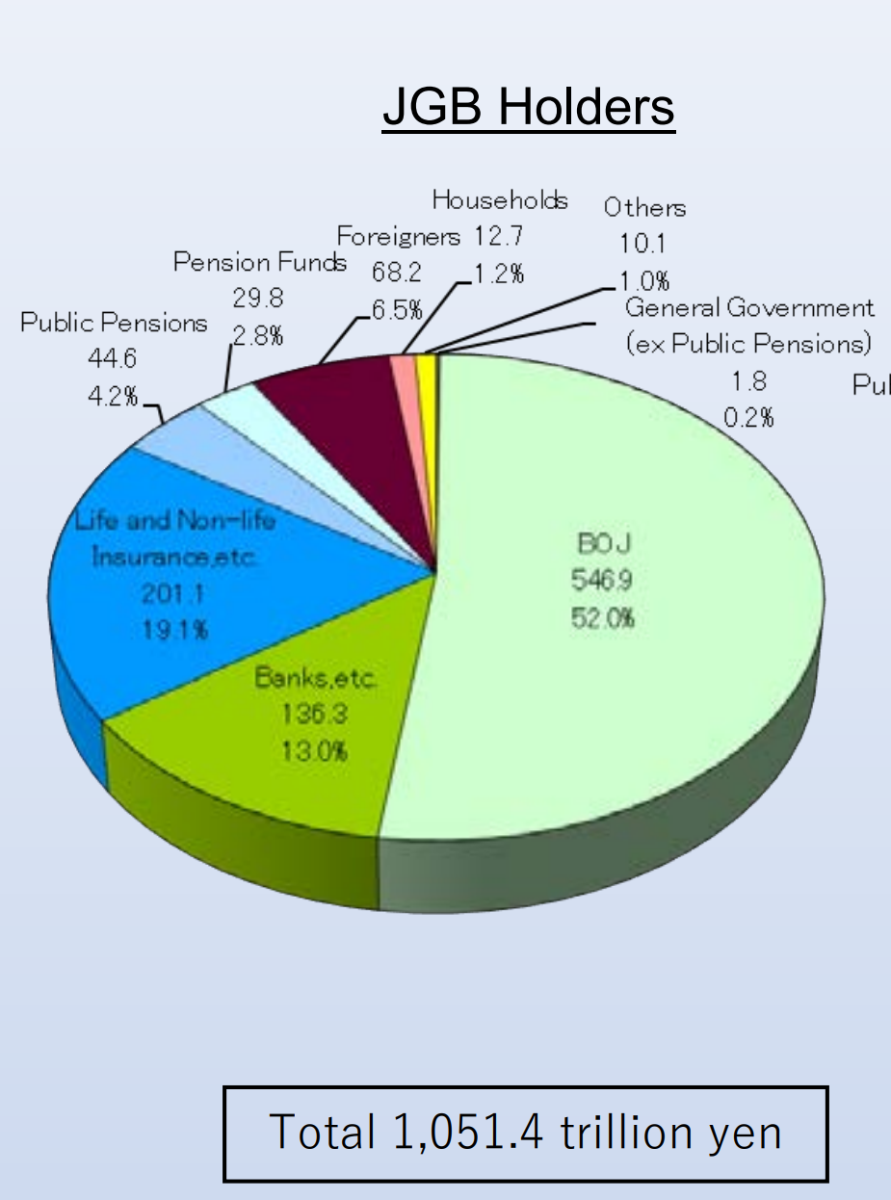
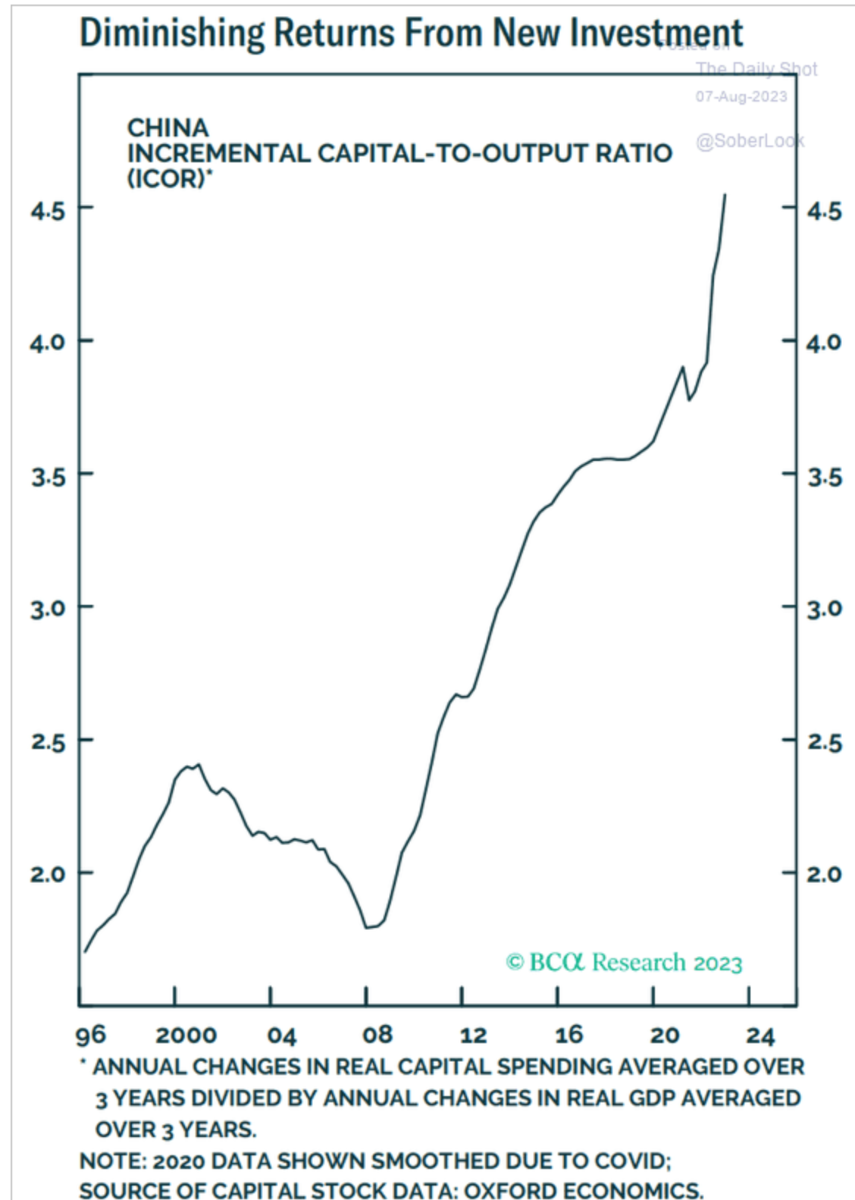
1-Factual aspect for Japan (Japan's course of monetary events is fascinating) From Flow of Funds data released by BOJ, end Q4 2022): Not that it terribly matters (43% vs 52%) and an interim report (end Q1 2023) mentions north of 53% but then it's become hard to guess when non-linear changes will occur (recent trend in exchange rates?) 2-Link to China? The debt intensity concept (more and more debt necessary to 'produce' a unit of GDP) has been developing in developed and developing nations for some time, including in China, in a big way, and, more recently, some sources suggest that progressively higher levels of capital are necessary to 'produce' a unit of GDP:
-
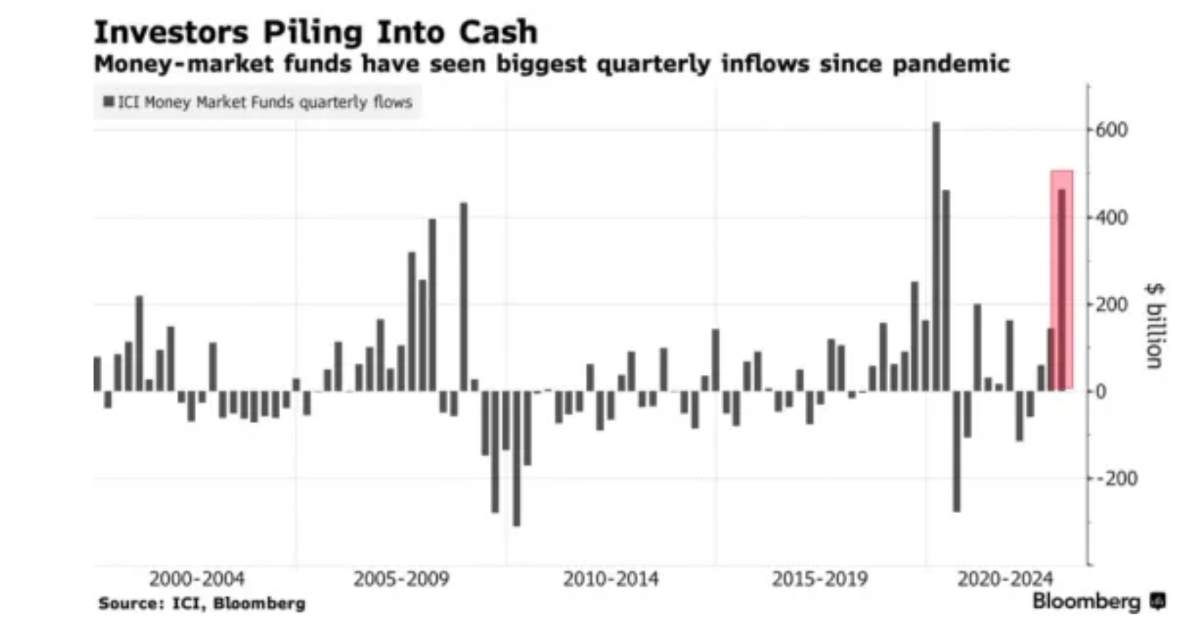
Can you provide an explanation (fundamental or sentimental) for the bubble that you describe? A bubble, if such thing exists, usually means high prices, what is highly priced in MMFs?
-
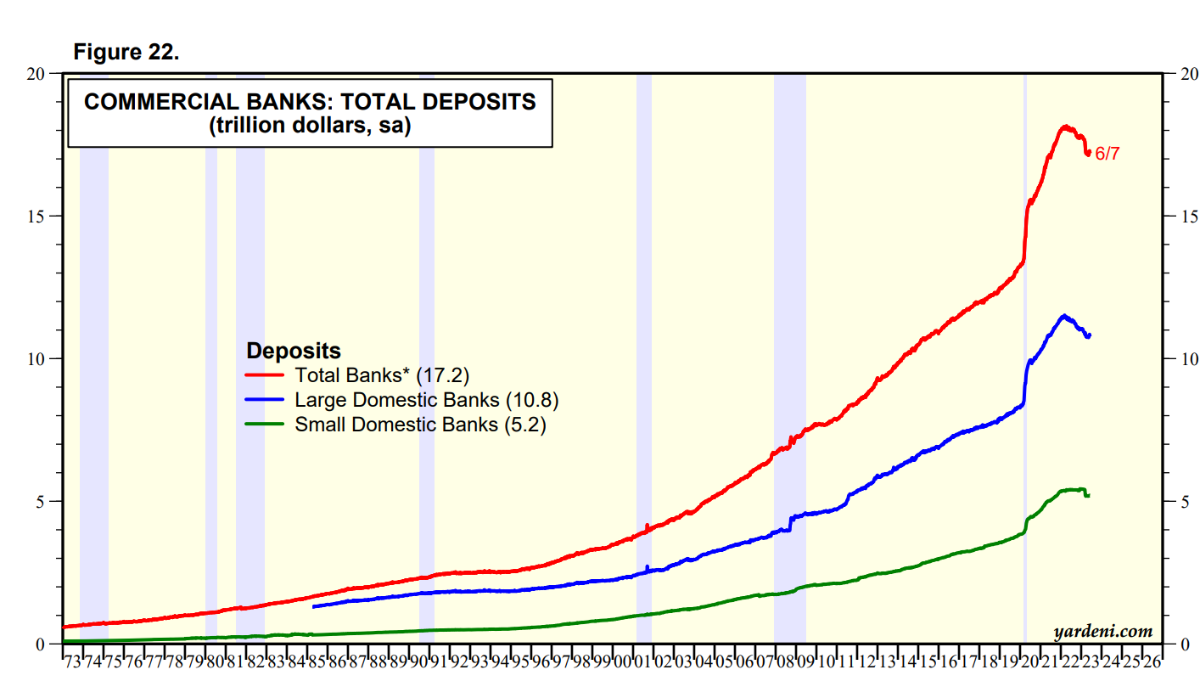
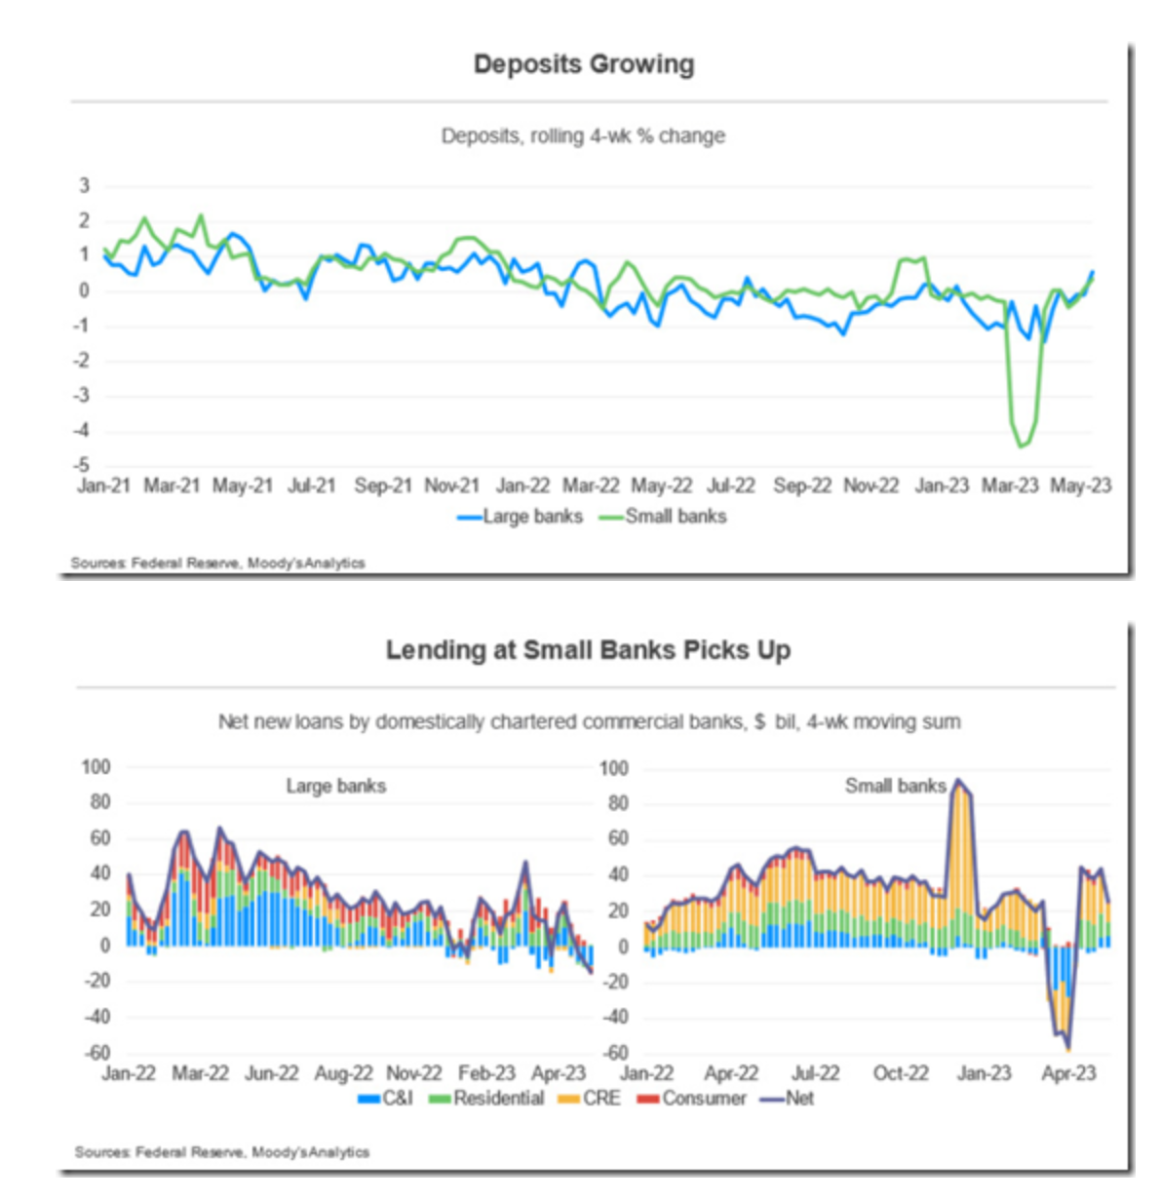
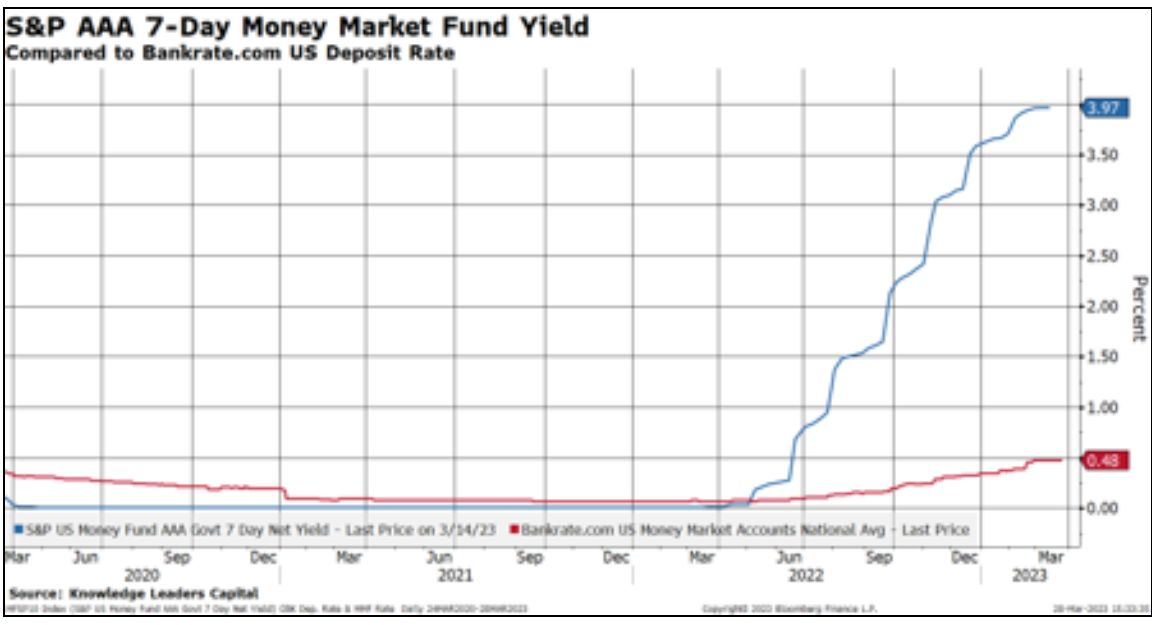
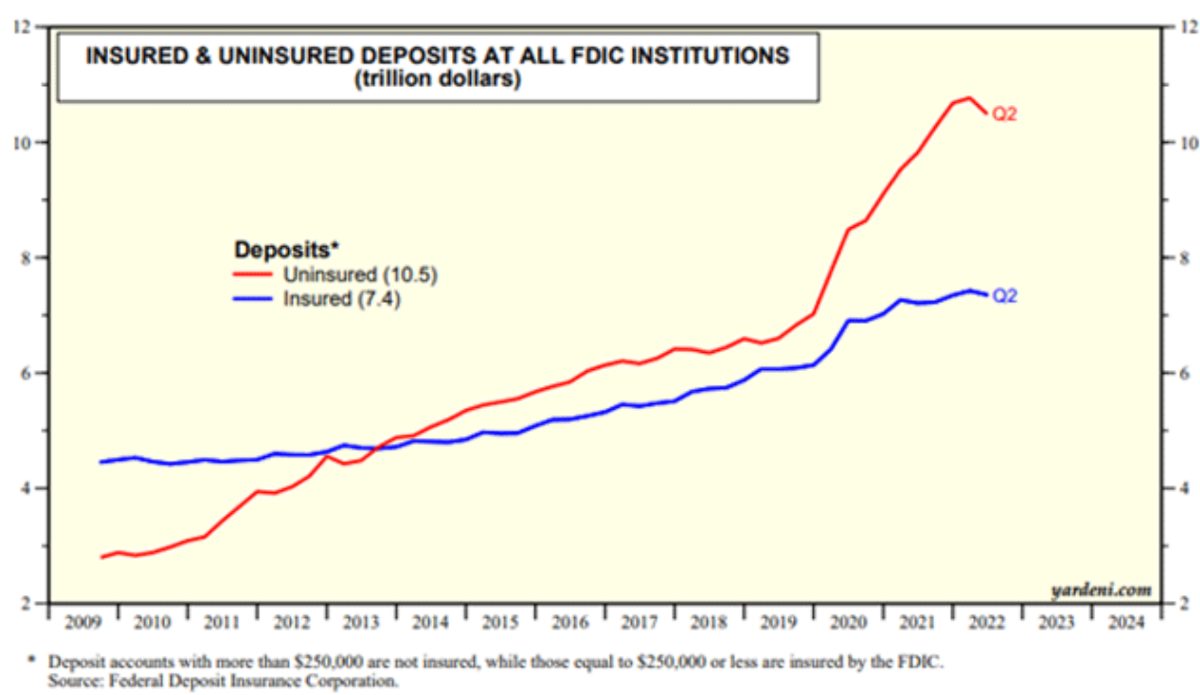
BTW, what wabuffo describes for car loans being moved around is a similar scheme when money is moved to MMFs (also like Apple savings accounts, One savings accounts at Walmart (offer 5% now up to 100k) etc) as these entities don't create deposits/money, they only act as intermediates (flow-through entities). ----- Short version: The Q1 "liquidity crunch" was noise. There is however building evidence (signal) for a credit crunch. If banks are to be held long term, fine but if there is a plan to hold banks for the long term there is a window of opportunity that will be opening. Disclosure: i aim to hold (really hold) 2 or 3 large commercial banks before reaching senility but maybe it's too late. ----- Long version: Thanks to Ed Yardeni: The Q1 'scare' is noise. Of course noise can be useful for trading opportunities. And deposits (especially uninsured ones) remain wildly elevated in the system. FDIC Quarterly Banking Profile - First Quarter 2023 Details from Q1 were reported in headlines as deposits accelerating their 'flights' from US banks but numbers under the hood reveal longer trends related primarily to macro stuff (QE, QT, TGA account, RR window) and, shorter term, some money simply (temporarily through MMFs as conduits) left through the RR window and some money (deposits) was temporarily withdrawn from the reporting when unusual banks were (temporarily) taken over by the FDIC-sponsored transactions for larger TBTF banks. The interesting aspect is that deposits have effectively disconnected from underlying economic activity and the 2020 unusual accentuation of centrally-planned macro stuff goes a long way in explaining the 'transitory' inflation episode. So, 'we' are basically back to 2019 trends (with still some excess money/deposits sloshing around) but banks have started tightening for some time and, if history is any guide, the next few months should reveal lower loan-lease growth etc etc
-
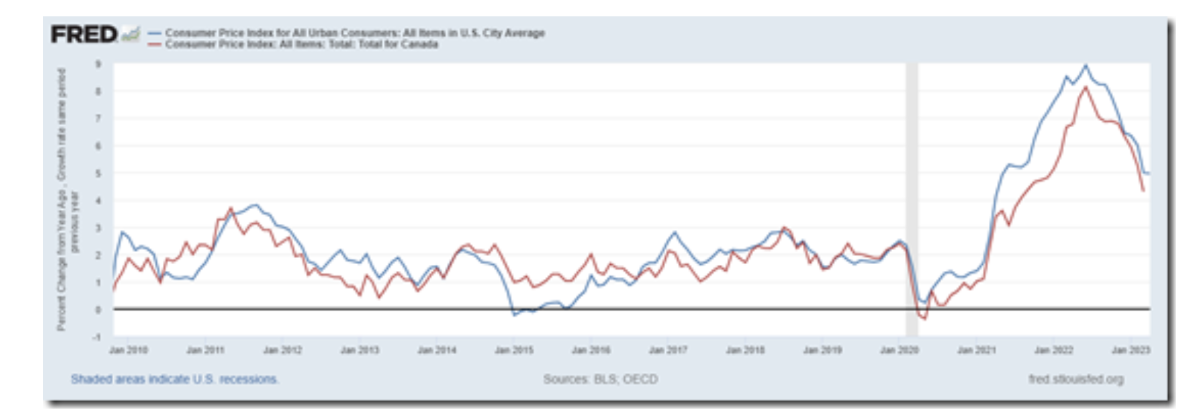
Longerish term, interest rates are tied to inflation rates and inflation rates... So yes, so much for 'independence' and domestic priorities when the recent inflation surge appears to have key underlying ingredients that are shared by the US and Canada as well as other more 'developed' countries. An interesting aspect is that the recently added ingredients are coincident and even backward looking and work with a (few months) lag.
-
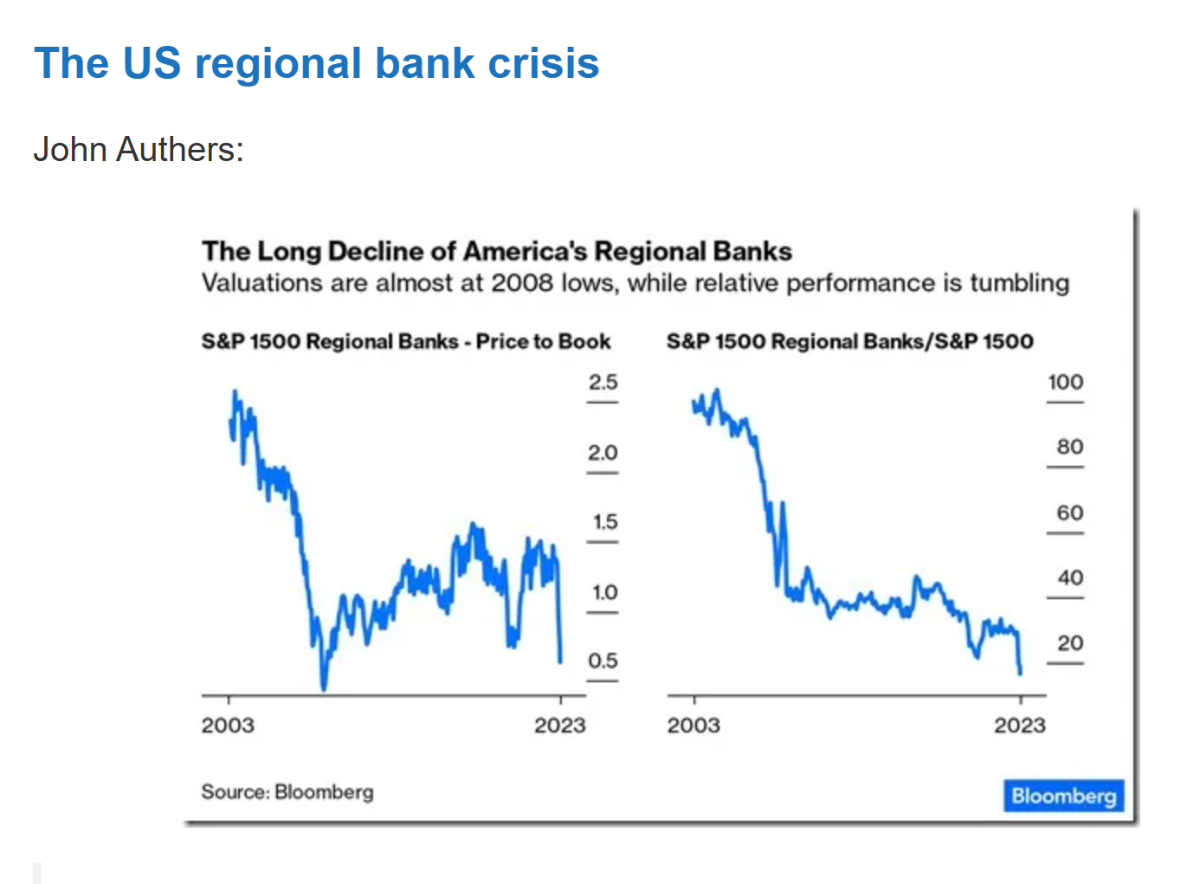
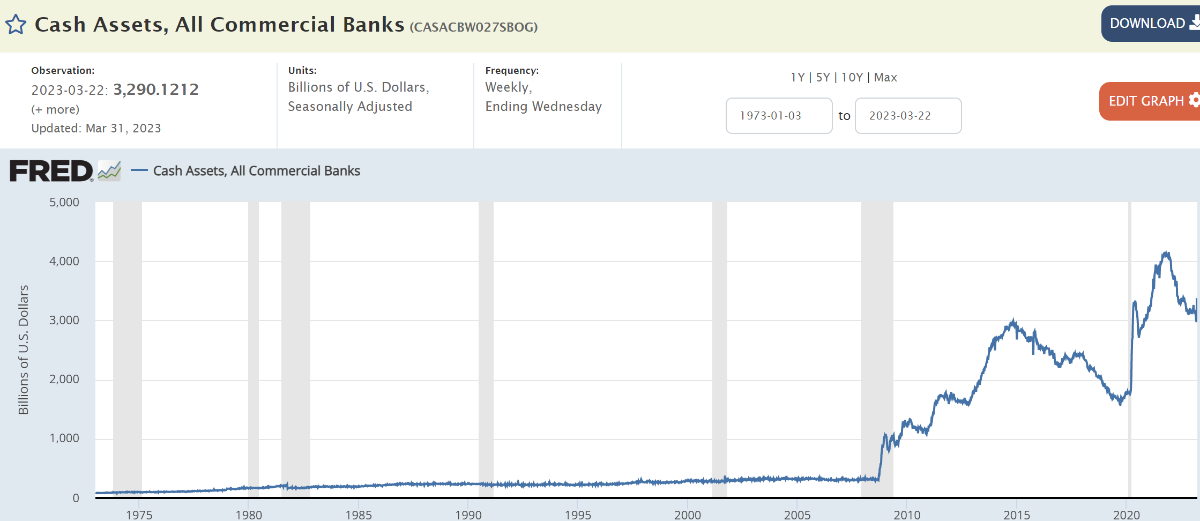
There are secular forces behind lower valuations allocated to smaller banks that are unrelated to the recent ‘liquidity’ issues and, contrary to areas like commodities (lower relative valuations), it is likely that this tendency for low valuations of smaller banks (unless a niche player of some kind) will persist and even accentuate. An interesting aspect is that capital (deposit) movements occurred from a rather select group of banks (unusual interest rate risk, high uninsured deposit ratios, “super-regional” category) to other depository institutions, mostly perceived as ‘safe’ (or too big to fail) and smaller and more regional banks of the main street-type did not feel to liquidity unease. Bank Funding during the Current Monetary Policy Tightening Cycle - Liberty Street Economics (newyorkfed.org) A fascinating aspect is that deposits are still plentiful at banks despite some marginal systemic tightening and, since 2008, deposit growth is no longer tied to run-of-the-mill loan growth, deposit growth at commercial banks is mostly tied to quantitative easing/tightening and the level of securities held by commercial banks (when banks buy a security, including government debt, they do create money with the associated creation of a deposit through balance sheet expansion). This is nicely shown in the following graph (found in a note written by John Hussman, someone who is sometimes rightly criticized but also someone who simply puts ideas out there for the world to think about). What is even more fascinating is that people who write, comment and opine on the web about ‘excess money’ don’t seem to see the ‘excess’ savings as a mirror image of the government-sponsored (Fed-Treasury alliance) MMT-like money creation scheme. Before the last two recessions, ‘savings’ would simply align with ‘loans’ but after the GFC and, especially, after the great virus crisis, ‘excess’ savings is mostly money that governments ended up creating. The Rise and Fall of Pandemic Excess Savings | San Francisco Fed (frbsf.org) The podcast with Sheila Bair (someone who deserves respect IMHO) is interesting but her theory that there was a deposit flight from banks to MMFs and then to the O/N RR window is not significantly supported by data as deposits mostly remained within commercial banks (it is ironic that there is a publicity about a yield ETF during the podcast; when someone puts a deposit into this ETF, where does the money go? The money certainly does not stay there because money held by the ETF earns 0% and not the yield they are advertising!). However Sheila Bair is on to something when she describes the potential need for banks to build more capital…eventually…because, in a way, the Fed is ending up these days with a balance sheet (negative equity really) that is looking similar to recently challenged banks as a result of poor duration risk management. Of course, the Fed can print money, somehow or even technically, but it’s been the expectation of commercial banks that the Fed will come to their rescue whenever needed and this moral hazard is bound to…eventually, mean higher capital requirements (and lower returns on equity) for banks. At least, in terms of risk management (historically US style), banks are not supposed to fall back on excessive and permanent Fed support but are supposed to fall forward (some banks may need temporary support at times). At least that’s what famous financier Denzel Washington suggested in 2011.
-
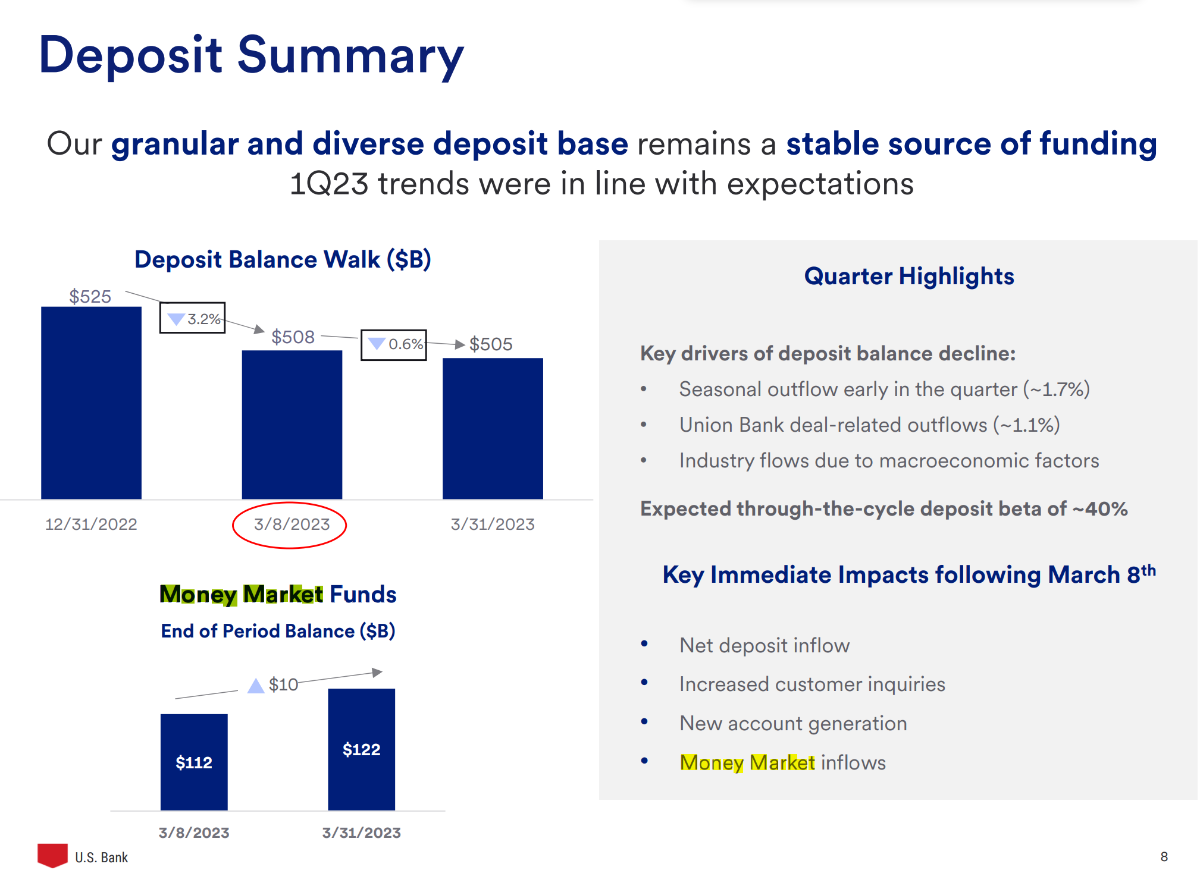
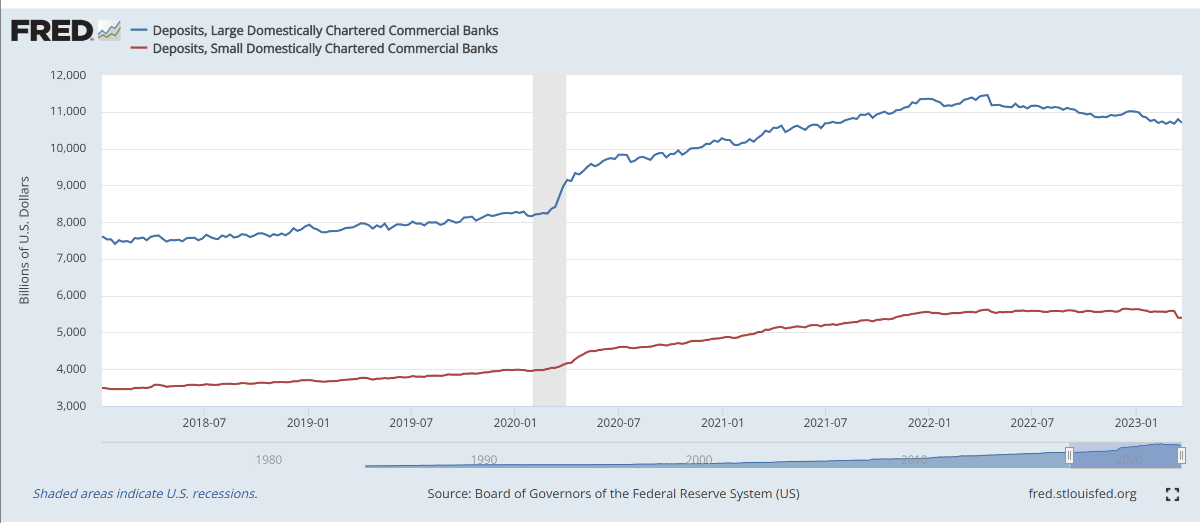
Deposit competition is a thing, especially for some banks. However, overall, there is still an abundance of deposits and outflows in one bank will, almost by definition, mean inflows for others. For that specific aspect, USB does not appear to be in trouble and, in fact, may be considered a relative safe place for deposits. As shown below (from USB disclosures), deposits haven't been running away from USB, especially after the 'turmoil'. Banks overall, for quite a few months now, are seeing deposits decreasing at an annualized rate of 3 to 3.5% (despite still rising loan books, so due to 'macro' factors) and (taking into account the digestion of acquisition) USB's deposit base is still growing or at least remaining stable in this declining environment, especially since early March...and they are showing growth in their own in-house money market funds' assets so... ----- Take the above with a grain of salt (i'm no banking expert) as my main activity today was getting the backyard pool ready for the season (my contrarian side provided satisfaction of doing this activity when it is raining as i sense the pleasure of enjoying the pool later when the sun will be up). Disclosure: i've opportunistically held USB in the past and only follow now on the surface although my timing (and holding period return) was better than the Master on this one: Warren Buffett Buys Banks, Healthcare, and Dow Jones Shares (cnbc.com)
-
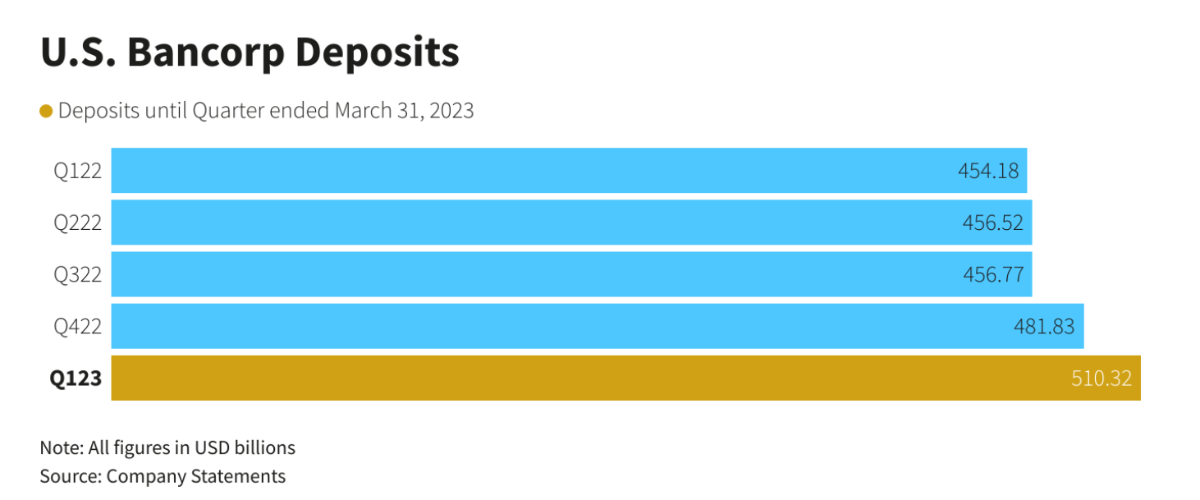
Maybe this belongs to the USB thread but the discussion may/will get going when the asset side will be questioned so the following is about the liability side noise that recently occurred for many US banks including USB. When Q1 results came out, noise was made around the end of quarter total deposits numbers (compared to end of last quarter, down 3.7% from 525B to 505B). In the more detailed (and boring) disclosure, there were mostly technical reasons for this and no fundamental numbers showing some kind of run on deposits in March. In a time when deposits are overall going down in US banks (for reasons completely unrelated to basic banking activity), USB has actually grown its deposit base (even when adjusting for some acquisition activity in late 2022, using average total deposits during quarters):
-
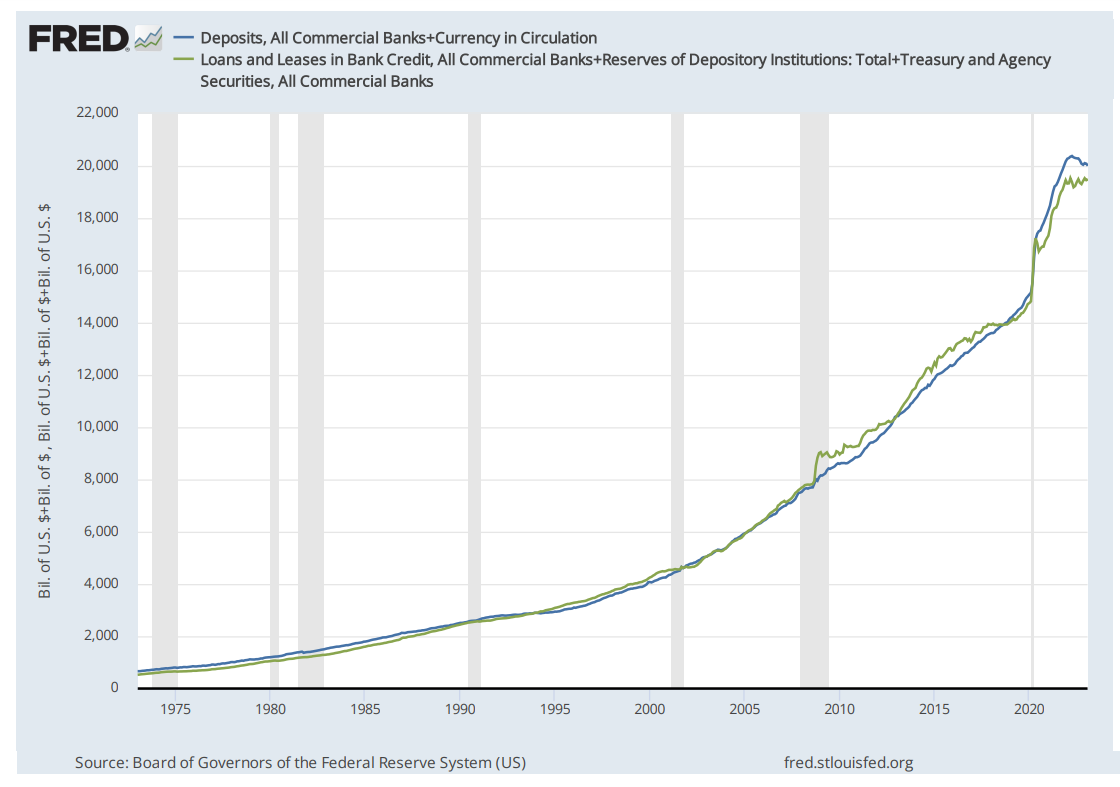
^The 'Panik stage' description needs to be put in context. When the FDIC creates a bridge bank for a failed institution, deposits temporarily get withdrawn from the ordinary Fred numbers shown above. For the 'small' banks, what happened to Signature Bank (89B in deposits) is responsible for much of the (apparent vertical) drop in deposits FDIC: PR-21-2023 3/19/2023 For the 'large' banks, what happened to Silicon Valley Bank (175B in deposits) is not even associated with some kind of vertical drop as the withdrawal of deposits was easily mitigated in the normal course of human events. FDIC: PR-16-2023 3/10/2023 This may change, but in this ample reserves regime, banks (as a group) don't need to compete with deposits as money is (still) coming out of their ears.
-
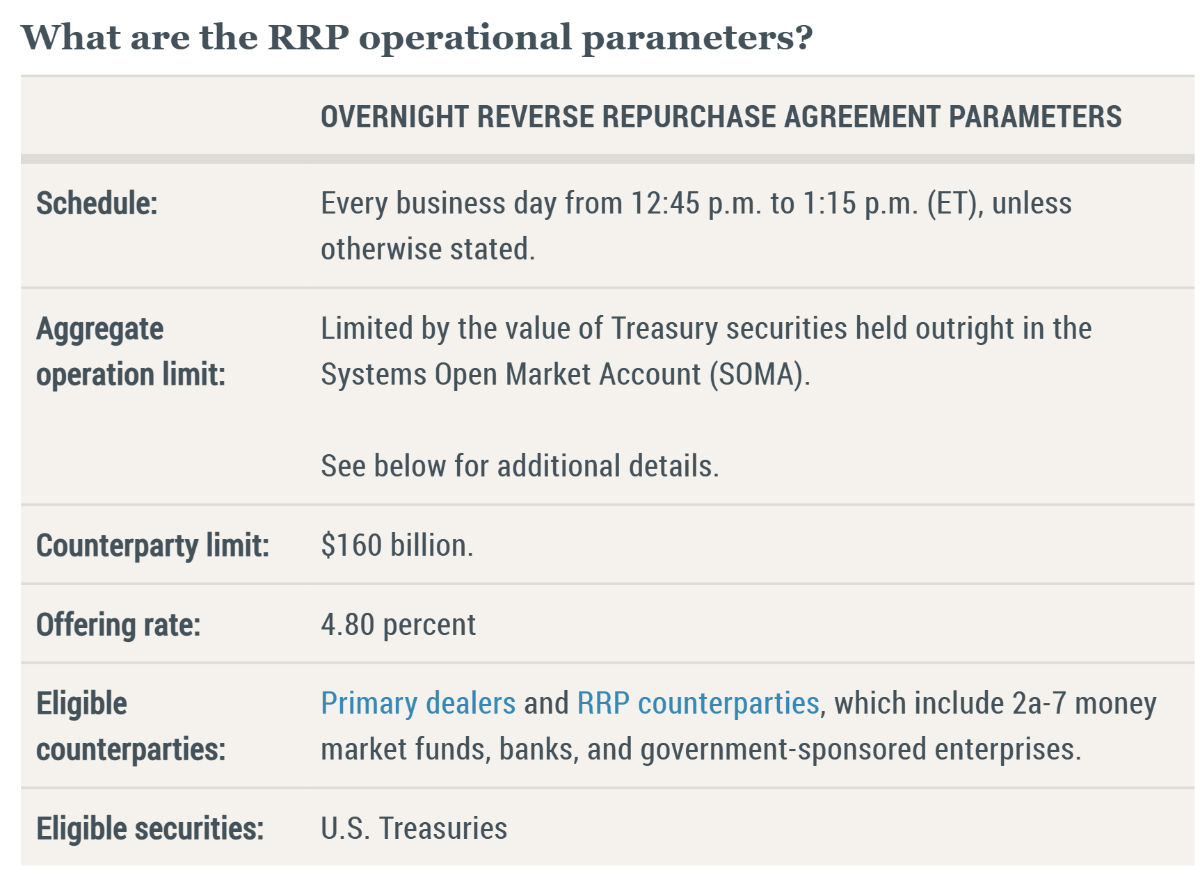
This unusual Fed-Treasury coordination has been tried before (World War 2) and things worked out (easy to say in retrospect). So this too shall pass. But i wonder about the potential unintended consequences of all the extra dollars that need to be held by someone at all times (effect on asset inflation and, more recently, on consumer inflation (MMT-like side effect)). Thank you for the always interesting and helpful perspective. This is an investment board (apologies to John Hjorth for the following (likely?) waste of mental energy) but your 'macro' question is fascinating. Easy answer (technical): The Fed can widen the field of eligible participants and can (did double in 2021) the counterparty limit. Tougher answer: there appears to be no limit (constraints)? ----- This topic reminds me of a personal anecdote. This was my first clinical rotation as a resident in basic surgical training (cardiac surgery) and i was thrown into the action, on call at night, to take care of a bunch of relatively unstable inpatients, mostly post-operative cases. i'd go and assess these people semi-crashing on the ward (failing hearts) and then call my chief resident (one of the few people i'd let crack my chest open, given the right circumstances). Invariably, he advised to give a fluid bolus (long story short, increasing fluids (liquidity) will tend to increase output, at least temporarily). Invariably, a few hours later, the same patient would be crashing again from fluid overload (!) and then my chief would advise to give a diuretic (to get rid of the excess fluid) which almost always worked out in the short term. So he'd join me in the morning for a short round before going to the operating room. To the following question: Aren't we just trying to catch our tails here? came the following answer: Oh! the fundamentals, leave that to the cardiologists, they should be here soon. To the technically capable person that i potentially was, this answer always left me wondering about fundamentals? -----
-
As mentioned before, deposits have been on a down trend for a while (reasons for that unrelated to the recent 'liquidity' issue) and there has been a recent and slight change in this trend, especially for small banks (related to the recent 'liquidity' issue). There is no basis for the assertion that 600B have bled the banking system due to a recognition of MTM and AFS mark-to-market potential losses. If you actually follow the recent money flows (recent blip down for smaller banks outside of recent trend), it looks like most of the money went through MMFs and back at the Fed through the reverse repo window. So when your local bank offers an in-house MMF higher-yielding security for your money, the higher yield is linked to IOER offered by the Fed. So there are ways for money to leave the banking system including the Fed reverse repo window but, using Occam's razor tool, when, in normal circumstances outside of Fed operations, money is moved to an MMF, the MMF can only offer a yield on this money if this money is swapped for a higher yielding security such as a Treasury Bill. If the MMF buys a Treasury Bill, it will send the recently accepted money to the private market participant who held the Bill before. And where will this money go then...it will end up as a commercial bank deposit. ----- Yes, banks have to 'manage' liquidity' and some banks may have to offer higher yields on deposits somehow but, overall, banks haven't been competing for deposits. Because they don't have to. i woundn't mind if wabuffo would contribute here (to tear apart my perspective).
-
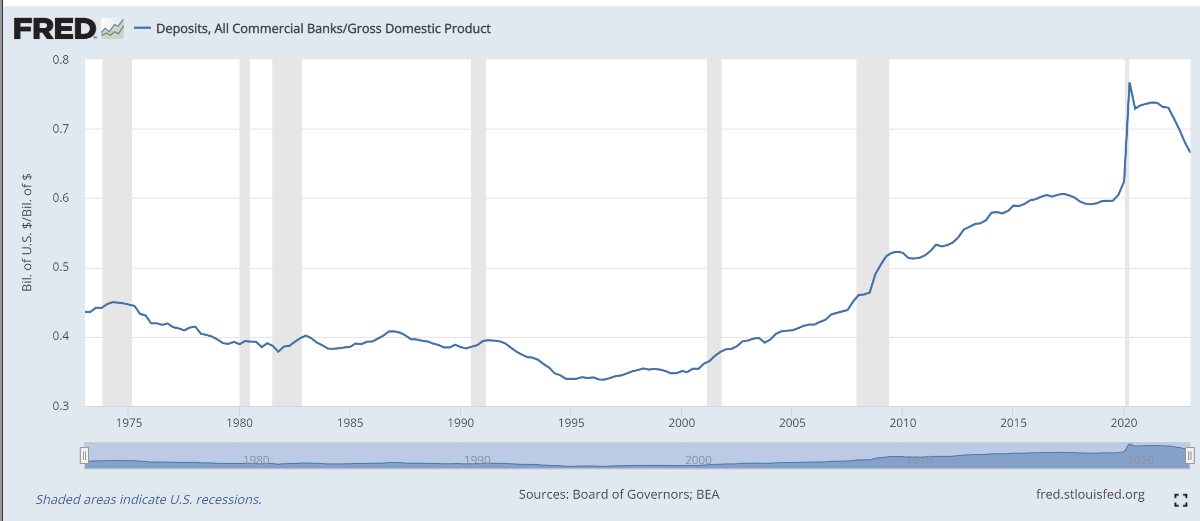
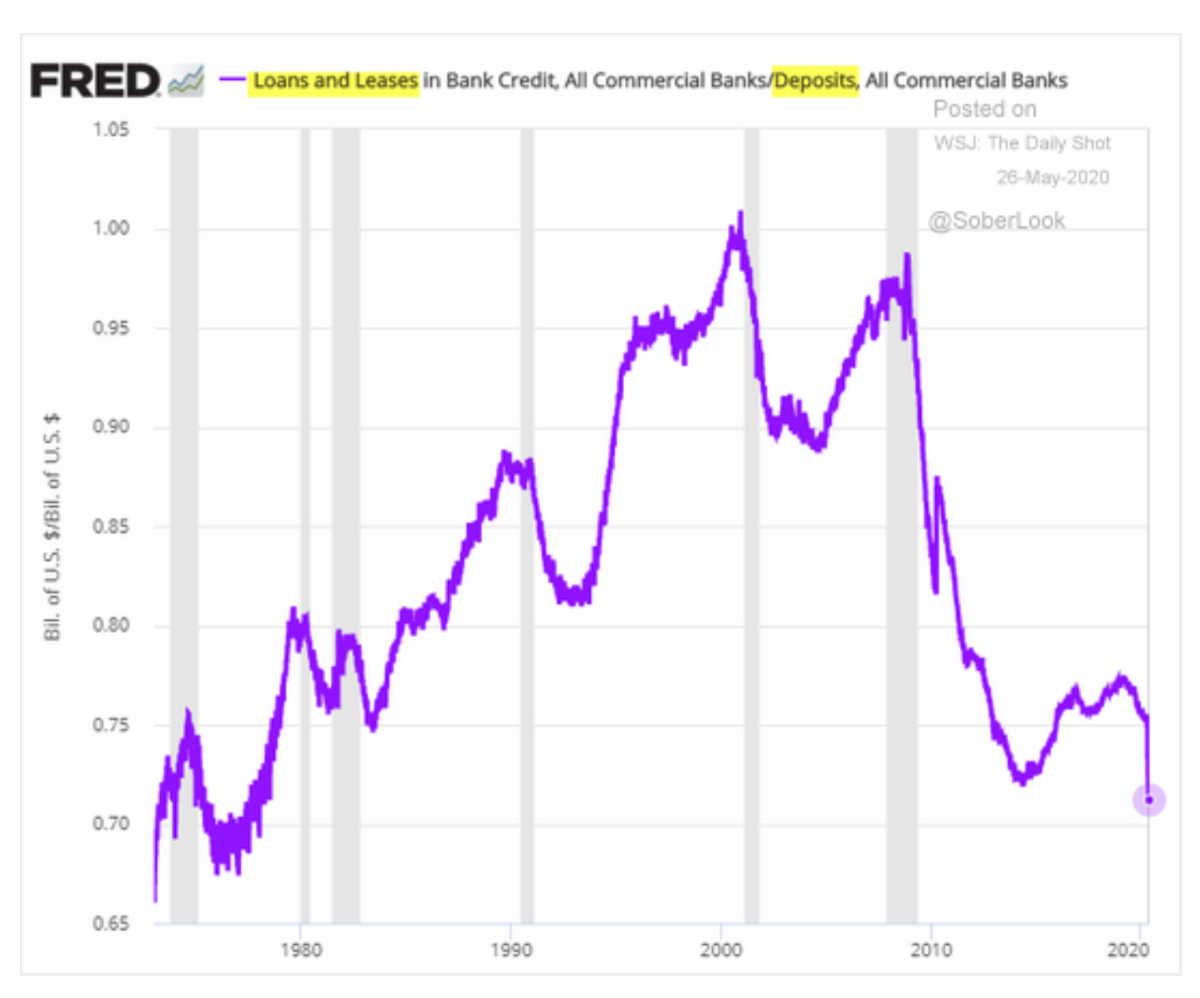
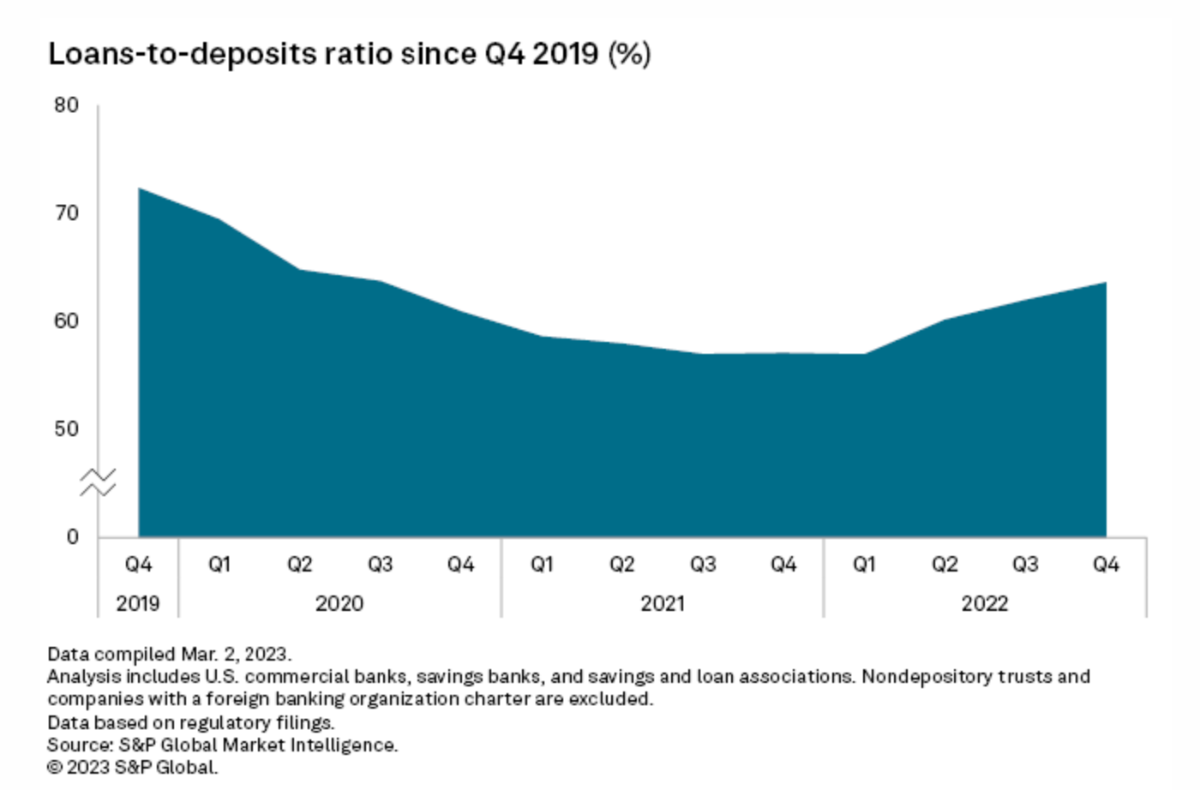
^A ratio's significance is improved if inputs are looked at? The graph does not show the relatively small change in recent trend but the big drivers in the very significant decline of the ratio since 2008 have been QE to non-banks and commercial banks buying securities, both activities increasing deposits (balance sheet expansion). ----- Just for fun, if there is an expectation of a potential run on PNC Bank, where would deposits go? Under mattresses?
-
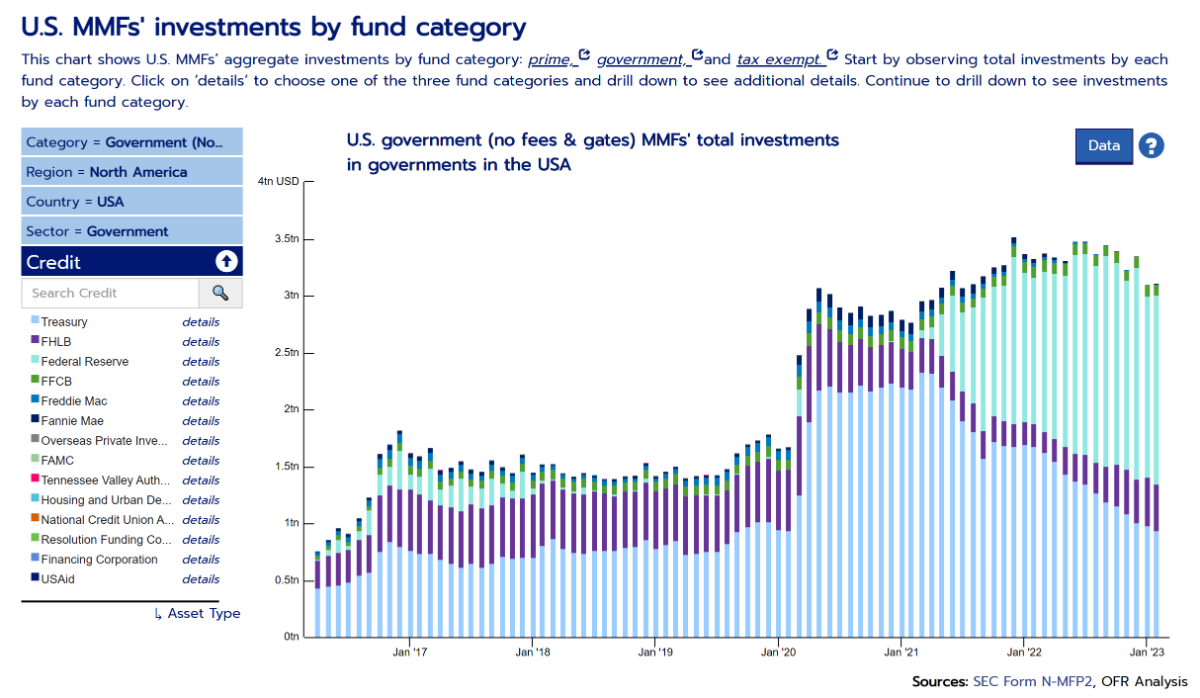
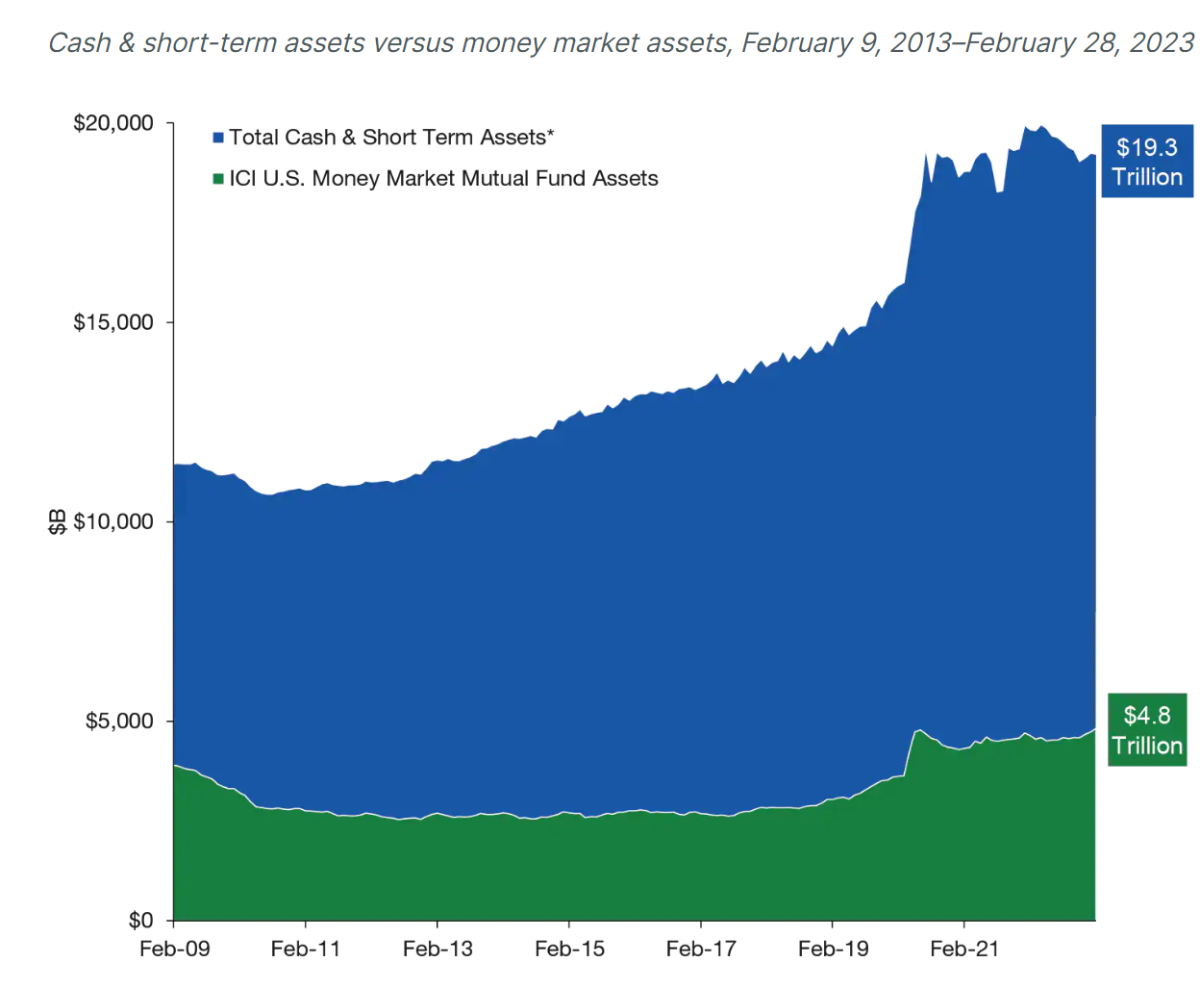
Unless you show otherwise, the following applies for the Fed collateralized lending and income derived from pledged assets: "Unless an Event of Default occurs or the {Fed} Bank expressly directs otherwise, any proceeds, dividend, interest, rent, proceeds of redemption, and/or any other payment received by the Borrower regarding any Collateral may be retained by the Borrower." This was somewhat covered in the above posts but here's some additional perspective with a graph showing where the action has mostly happened in US MMFs: So, in early 2020, excess excessive money went to MMFs (expanding their balance sheets) and the money then was swapped by MMFs for mostly Treasuries (resulting in a swapped money deposit to a private market participant in a commercial bank). Over time, banks started to resist (on top of keeping deposit rates very low) and the 'supply' of Treasuries dwindled so MMFs moved the money to the Fed through the reverse repo window (Fed sort of does the opposite of QE ie it loans a Treasury in exchange for money). And then with the system still awash with excess money and as a result of some duration mismatch and an uneasy market feeling, they set up a facility to exchange money with commercial banks for temporarily duration impaired Treasuries to make it easier during the tightening.
-
Banks, pre-GFC, existed in a tight reserves system and effectively kept cash levels very low because cash was a zero-earning asset. Since then, banks have existed in an ample reserves system. Since 2009, banks have been in no way restricted by cash levels in order to loan. It is ironic that there is a 'panic' now with cash levels overall that remain extremely ample or excessive. Sure, there are a few banks with idiosyncratic exposure (uninsured deposit, wild asset-liability mismatch with duration risk etc) but banks overall have absolutely no need to sell securities and can easily hold them to maturity. There is no fundamental need to throw a temper tantrum because of recent pseudo tightening. Comparing the growth in assets for banks and MMFs is interesting. There was so much money 'injected' into the system in 2020 that banks were drowning in cash and the excessive excess went to MMFs (and back to the Fed, reverse repo direction). That's why banks had no incentive to offer higher rates on deposits. The excess cash will move around but will, in essence, tend to end up in commercial banks.
-
Macro - Corporate Profits as a % of GDP
Cigarbutt replied to Blake Hampton's topic in General Discussion
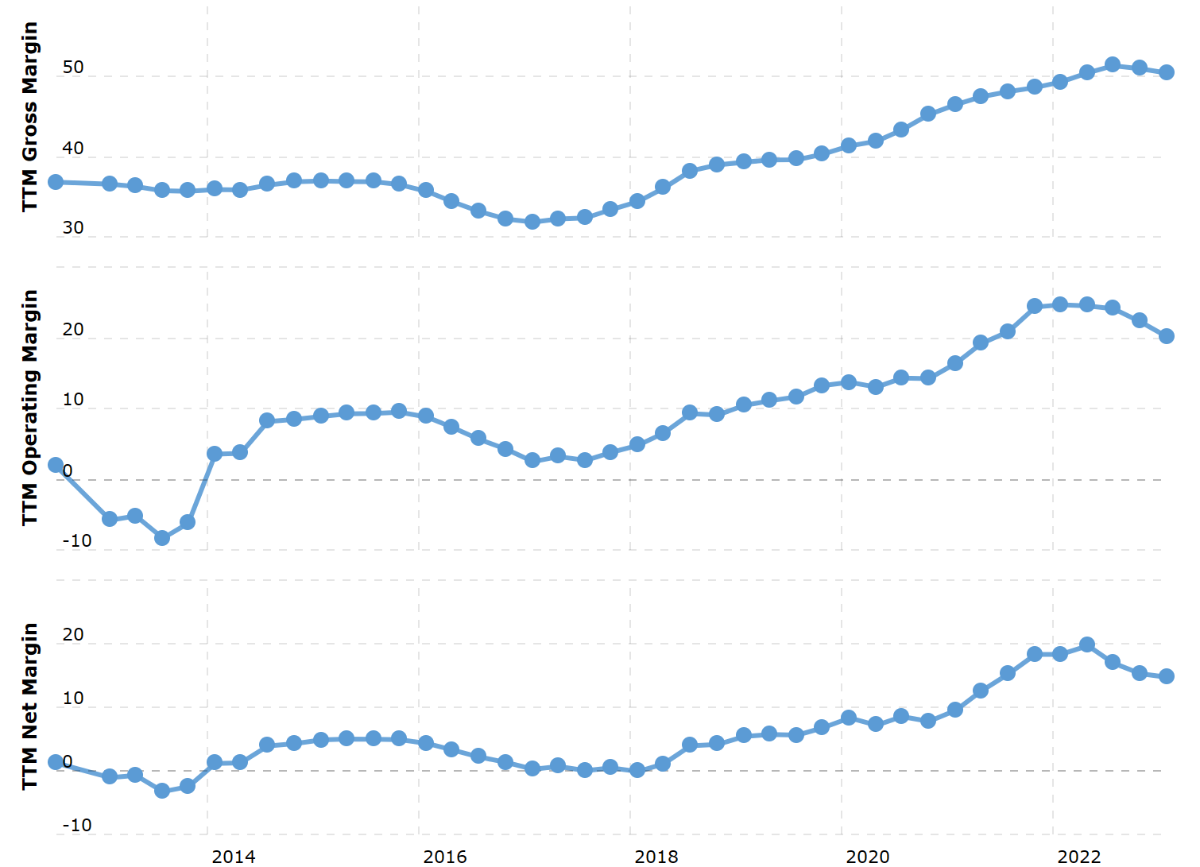
That may be one of the reasons why a top-down approach is difficult to apply in order to appropriate some of those profits at the individual stock holder level. i've been following (with some dismay) Restoration Hardware (RH, a high-end furniture retailer) and seen margins go up and missed the boat in this Great Gatsby economy. i guess it's ok to accept missing some boats. In the past, i've had interesting results (process and outcome) investing in furniture retailers (GBT BMTC group, holding period return helped by increasing margins 1+ but mostly through superior capital allocation and sustained buybacks below intrinsic value and The Brick, when margins went from negative to positive, often a very helpful development, if achieved). And yes, one has to wonder at the possibility of a systemic misallocation of capital but what do i know?
-
^Concerning the idea that deposits have become scarce: Concerning the recent wave (temporary, accrual-wise) of deposit outflows, how is this recent money flow different?
-
^Submitted for: -perspective (versus the deposit 'flight' or 'hemorrhage') -if you like banks (large and small) (and there many reasons not to like them), the recent deposit 'shortage', in itself, is noise. Deposits in the 'system' have been going down for some time mainly because of some Fed tightening with non-banks, commercial banks de-expanding their balance sheets through the sale of securities, including government debt. This trend down has been partly mitigated by the Treasury General Account (TGA) at the Fed going down. Lending by banks has played a role in deposit growth but this effect has been stunted by the other factors. Overall deposits at banks continue to be way more elevated than the long term trend. Also, what happens when cash goes from JPM or a small bank to a money market fund? There may be a short term blip in truly cash assets at MMFs but this cash does not stay there as MMFs need to convert this cash to an interest-bearing security of some kind. In the main, this cash, after MMFs use it to buy a security, goes back to JPM or a small bank. Yes, in a funny twist of financial plumbing and since banks are in no rush to accept more deposits (as they are flush with them), some of the cash accepted by MMFs as temporary deposits does go back to the Fed through the reverse repo window (essentially QT) and there's been some of that but banks remain bloated with deposits overall.