Cigarbutt
-
Posts
3,473 -
Joined
-
Last visited
-
Days Won
1
Content Type
Profiles
Forums
Events
Everything posted by Cigarbutt
-
^Then we're on the same page: Fairfax is borrowing +/- permanent equity capital at an 8-10% cost (with ORH as collateral) in order to buy its own stock, a scenario which assumes that the expected return on the price paid for the buyback will be superior than the 8-10% cost of capital.
-
From an exchange that happened last Feb 15, 2021: You: I think the 516/516 might be the result of a tax structure. Could the deal have been designed to provide a return via dividends instead of capital gains? But yes, in principle I agree OMERS is basically providing debt finance albeit I think they do take equity risk: - I am not sure FFH have to buy back the stake if they don't want to. - The valuation of Brit came down from 2018 ($251.8m for 11.2%) to 2020 ($206.6m for 10.5%). Looking at it another way, by my maths FFH has paid a total of $1.85bn for 100% of Brit (before then selling 14% back to OMERS). I think that's a good chunk more than they originally wanted to pay, for a lower BV since Brit BV has barely grown. Me: i just spend 5-10 minutes on both Brit and FFH reporting and cross-checked a few things. Summary (it's easier to take OMERS' perspective as FFH contributed capital and assigned its own dividends to Brit) (all numbers in USD) Summer 2015: OMERS pay 4.30 per share for 120M shares (29.92% interest), with a shareholders' agreement stipulating an annual dividend at 0.43 per share. Total 516.0M In 2016: OMERS gets 4.30 per share for 13.449M shares, 57.8M In 2018: OMERS gets 4.30 per share for 58.551M shares, 251.8M In 2020: OMERS gets 4.30 per share for the remaining 48.000M shares, 206.4M i think the cumulative dividend has been paid effectively at 0.43 per share per year during the minority ownership. FFH had permission to buy back, on an annual basis and possibly with certain restrictions, the minority interest. So, this type of partnership could be a win-win and has been a reliable source of funds for FFH so far but, so far, the win-win has been met 100% on OMERS' side and remains to be defined on FFH's side and is based on a 10% (+/-) hurdle rate. You: That’s really interesting, thanks. ----- So the arrangement is basically fixed-income-like with a preferred-share-constant-principal-par-value aspect from OMERS' point of financial view. i assume OMERS face(d) counterparty risk and there must (have been) be provisions for some kind of forced redemption or recovery in case of 'default' but the relatively high coupon may mean that they rely more on qualitative factors related to top management (whom they got to know more and more over time) and less on explicit covenants. These deals make a lot of sense for OMERS (their mission, expected returns etc) and it's up to Fairfax to make good on the leveraged funds.
-
We had discussed this a while back and here's an unaudited update. There has been a lot of capital movements so the focus is on pre-tax earnings. Since acquisition in 2015, the return (average net pre-tax earnings over book value) so far from both the underwriting and investment points of view has been very low (about 1-2% CAGR), with an average CR at 105-6%. Of course it's the future that counts and float has grown and there is an interesting new joint venture. Still, it's interesting to remember that, using their own (FFH-OMERS) internal private appraisals which were undoubtedly used to estimate the intangible part of the acquisition, IV growth at Brit was tagged at about 8%.
-
Interesting thought about 'this environment'. In 02/03 2015, FFH issued ten-year notes at 4.95%. In 03 2021, FFH issued ten-year notes at 3.375%. My guess is that the specific credit spread on the OMERS-type credit instruments has not changed. So, an 8-9% 'deal' is within the realm of possibilities.
-
More disclosure is needed but if this is the typical OMERS' kind of deal, the interest rate is 10% and the gradual buyback of the 'non-controlling interest' will be based on today's fair value valuation (whatever inputs used to decide the range in valuation). For Brit (after a dissection of both parent and sub reporting), the OMERS' stake was bought at 4.30 book value per share (essentially based on the contemporaneous visible transaction), and, almost like clockwork (although it doesn't look like it), 0.43 cents per share (per year) was paid to OMERS and the stake was bought back at a constant 4.30 per share. So, this is the (financing) hurdle rate. @gfp The only explanation that seems to make sense is that the net difference has to come from the difference between treasury shares reissued and acquired. Disclosure: in the last few months, i've been 'trading' here (to confess an addiction is apparently the first step) and the near future may provide a window of opportunity.
-
The tax code has become too complex and a messy patchwork of rules and this should be resisted but. It looks like the 'new' rules are simply an explicit description of what was previously implicit in the substance of previously enacted law. It is quite possible that the new text reflects a reaction to we, the people (including sisters and other related parties), having tried to circumvent the intent behind the legislation (to somehow obtain a (n unfair) tax advantage). In the event that the tax agency starts asking questions about related party transactions, if applicable, the idea is to simply demonstrate that the transactions were coincidental and not part of a plan. From a humble and anecdotal perspective, the tax people are not the brightest of the bunch but they are not stupid.
-
There is a conceptual issue here.* Deficit spending has continued to match net government debt issues (it's both a concept and a mathematical demonstration). The rising TGA balance in cash deposited at the Fed was a swap of cash held by private participants who bought the newly issued government debt securities in exchange for cash proceeds which the Treasury temporarily deposited at the Fed (associated with a temporary decrease in bank reserves until the cash is 'created' in private bank accounts (not necessarily the same deposit accounts that funded the debt but overall resulting in no net deposits in the private system)). There may be an element of supply/demand timing but the government debt securities matching the money to be spent (or actually spent) already exist in the system. This is technical but (IMHO) potentially a very important distinction. It is now felt that the government can print money in private accounts without constraints (perhaps à la MMT) but, at least up to now, the Fed money has stayed within the financial plumbing system (matched with debt) and has not reached legal tender. *This post may trigger a certain kind of animated image, which is fine.
-
There is interesting additional disclosure concerning the 'stock positions' historically held by Fairfax and now held by CVC. The notion of an "asset value loan note" is introduced. It seems that CVC is now the indirect 'owner' of the assets but Fairfax remains the owner of the assets' risk. The arrangement is effectively equivalent to a total return swap agreed upon by both parties. Fairfax gets both the upside and the downside (it looks like dividends stay at CVC but it's not clear) of the market price movements. In exchange, Fairfax either pays interest on the 1.3B nominal amount or may have structured the transaction so that the 1.3B is at a premium to where fair value of the assets stood when the deal was negotiated (so the interest would be embedded within the notional amount). So regular quarterly cash flows don't occur in relation to the asset price movement but mark-to-market changes are recognized. Also, it appears Fairfax has the possibility to terminate the contract by somehow exchanging 1.3B of cash for the assets (whatever the value of the assets at that time) but the ultimate maturity is at the end of 2022, unless the maturity is extended. Note: in Q3, this guaranteed amount stood at 1.2B as some of the securities held by CVC and part of this deal were sold. ----- Also related to where Fairfax invests the float and the level of float, from AR 2020: "In the past five years our float [total float] has increased by an average of 7% annually..." and total float per share has just crossed 1000USD per share (25.96B (USD)/25.88M (shares)) and total float per share in 2021 so far has increased by about 8%.
-
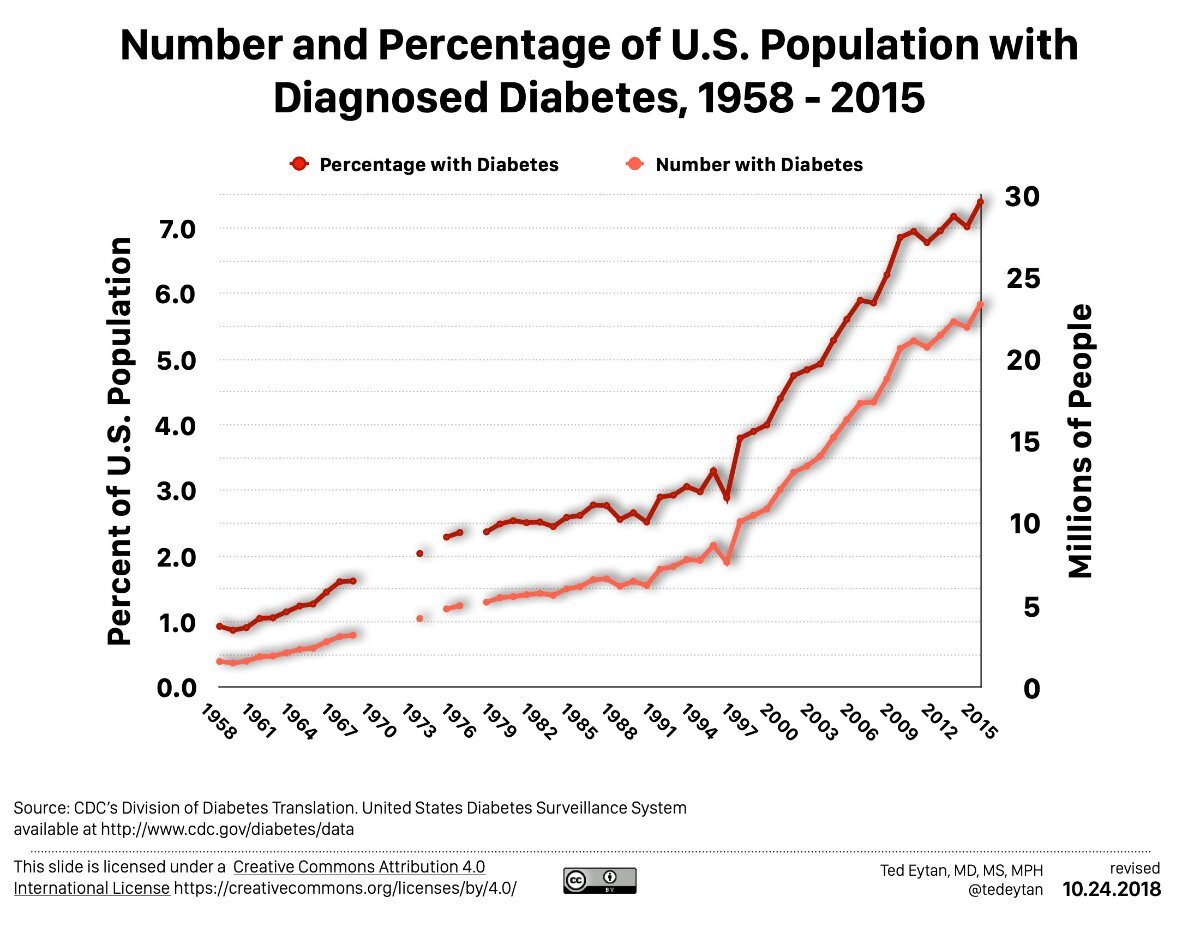
Warning: irrelevant digression (apologies to you Spekulatius for this post related to sustainability and resilience) Disclosure: i'm a fan of Mr. Volcker (long term thinking commitment despite potential short term pain, ability to mix global perspective and technical knowledge/application, ability to steer policy through a combination of consistency in principles and flexibility in means, including the use of constructive strategies to get things done despite various oppositions) and, of course, this opinion is not shared across the board especially recently. That's fine. His legacy (opinion): Longer version: Managing a New Policy Framework: Paul Volcker, the St. Louis Fed, and the 1979-82 War on Inflation (stlouisfed.org) ----- Wildly irrelevant addition. On my desktop this AM a medical article (available upon request) recently published showing that statin use (to lower cholesterol) over the long term was correlated to increased diabetes progression. The authors who are super bright and scientifically sophisticated (although IMO somewhat challenged in multi-disciplinary thinking) explore various metabolic pathways to explain this counter-intuitive finding (similar to the explanation given by high the BMI group "it must be my metabolism", forgetting the massive human trait to prefer easing instead of painful reforms, including for the period since the 1970s). i will now go for my planned outdoor 4-hour high-intensity ride for the sake of sustainability. -----)Back to housing prices and larger square-foot houses protecting smaller households looking for social status and security.

-
Are you simply looking for the following: Cyber Risks In A New Era: Reinsurers Could Unlock The Cyber Insurance Market | S&P Global Ratings (spglobal.com) or something else? If interested in the topic, S&P Global has a "cyber-landing" page: Cyber Risk in a New Era | S&P Global Ratings (spglobal.com) and they did a relevant webinar last fall. Here are the slides: PowerPoint Presentation (spglobal.com) i think you can access the webinar as a replay. Cyber risk is already an about 20-year-old market and trends are only starting to appear and unexpected stochastic-like losses could happen. Do you want to have the winner's curse-first mover "advantage"? -----) Back to FFH 2021
-
Maybe i can help. What is it you're exactly looking for?
-
A friendly reminder that your situation may reflect a form of targeted or custom advertising based on your overall browsing activity, internet searches, online purchases and social media profile. ----- Apologies for the invasion of privacy and -----) back to the Google-is-free and this-site-is-almost-for-free discussion.
-
Value of Solar Farm 20 Years After Construction
Cigarbutt replied to Morgan's topic in General Discussion
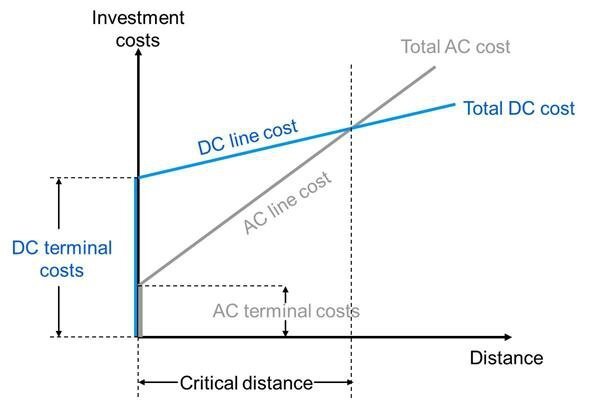
Very interesting indeed. Apologies to the poster who initiated this thread but this post expands on the potential value of long-distance transmission lines which, counter-intuitively on the surface, may be fully compatible with the long term value of solar farms and other sources of distributed energy on a more local level. There has been progress on the DC front and more recent long-distance transmission lines seem to go this way. As an example, the more recent Canada-Massachusetts line that was approved (approved with the transmission through Maine after unusual resistance in New Hampshire) the New-England-Clean-Energy-Connect project, involving new high voltage (DC current) over about 150 miles. i've come around this graph which shows the concept of "critical distance" which, as your article implies, has been coming down. Interestingly, these projects need to coordinate various priorities and the "critical distance" could be replaced to "time it takes for the project to overcome or bypass various multi-jurisdiction political, regulatory or other social issues" versus the initial larger cash outlays that these gigantic projects require. I guess the BHE people estimate this cost when investing in those long-term projects and Mr. Buffett has described the assumption that people tend to be mostly reasonable although he did pull out of a major LNG project some time ago (multi-billion project) and events that unfolded after revealed that he had correctly assessed this cost (too high). i guess people (individually or in crowds) are not always reasonable. But yeah, it's the AC vs DC dilemma again as a standard of transmission and it looks like DC will win this time. This reminds me that, during the most fun times and when stocks (individually or in groups) crater, i get excited and put Hell's Bells on when logging in the buy orders only to listen to Back in Black after. Just in case for clarity, both songs are form AC/DC. Who cares as long as it's powerful.
-
Value of Solar Farm 20 Years After Construction
Cigarbutt replied to Morgan's topic in General Discussion
i'm not sure the following is relevant or necessary but some of the developments for long-distance electricity transmission came from my back yard a long time ago. The 735kW lines are now standard but this wasn't always so obvious, like in the 1950s when the 'norm' was slowly being defined. In my area of North America, energy from hydraulic power is huge and the challenge was to 'transport' the energy over very long distances (from reservoirs to Montreal = about 1300km (700 miles)). CR52 complete versn-hi res.pdf (ieee.org) Yes energy loss (heat and sound) along the way (and energy transition (transition not like the renewable kind but more along the lines that JRM describes) is an issue but it is not a major issue. For those with an unusual interest: Extra-High-Voltage Transmission | 735 kV | Hydro-Québec (hydroquebec.com) For some technical aspects: Lost In Transmission: How Much Electricity Disappears Between A Power Plant And Your Plug? | Inside Energy ----- Who knows about batteries but there is further room to grow along long-distance electricity transmission. In my province, across-borders accords are slowly progressing (slightly easier in New England than in Ontario (CDN neighbor) for various reasons). The company needs an army of negotiators to navigate the different groups involved, including not-in-my-backyard constituents. Berkshire Energy has invested, and will continue to invest, in long-distance transmission infrastructure. For BHE, the idea is to maximize the potential of distributed energy and differential geographical production capabilities: Energy Transmission : Berkshire Hathaway Energy (brkenergy.com) ----- Not that it matters to most on this Board (and there are various reasons for the relative electricity 'cheapness' apart from long-distance transmission technology and hydraulic power capacity) but we are enjoying a relative competitive advantage on that front: But relatively low energy dissipation over long distances does play a role, at least for now and possibly for the foreseeable future.
-
^Thanks to both of you. The perspectives are quite helpful. The add-back/diluted shares approach seems to work relatively well in many situations. The aggregate disconnect may simply be a reflection of an unusual bull market (which may be fundamentally sound and may simply be a prelude to better things to come?). One aspect is how to try to match the share-based expense with the actual cashflows to compensate for the agreement to eventually issue shares. When an asset is bought with investing cash flows, the actual depreciating expense happens in operating earnings after, in a fairly predictable way. When the share-based expense is periodically recognized based on grant-date value (then market price), it's not clear which year financing cash flows should be used: those cash flows concurrent to the grant year or those cash flows when shares are issued upon vesting. i like it when companies buy back shares specifically designated for future issuance related to agreed upon longer term share-based compensation. Over time, aggregate financing cash flows allocated to share buy backs have been increasing, absolutely and relatively and, historically, in a mean reverting way, buyback activity has been pro-cyclical. If one uses the perspective that "Changes in the stock price presumably {and efficiently?} reflect changes in the expected net present value of all future cash flows flowing to the firm's equity", then the NIPA profits need to be adjusted upwards to match the rise in GAAP S&P 500 profits and this would represent, for the 2012-2019 years, about a cumulative 1T amount of profits that the market has recognized (as a measure of future profitability) and that was captured by share-based compensation value upon vesting so that the share-based compensation was not really an expense but more a reflection of better corporate business prospects at large and/or of an unusual collection of circumstances (low interest rates etc) that will continue to support multiples and valuations. The lower NIPA corporate profits, as uncovered by tax paid on capital gains by individual investors, would then simply mean that the employee/management stock was sold to another investor after vesting, with some tax withholding, related to new and better appreciation of flowing future cash flows. But i'm still not clear on how to adjust for this on a forward looking basis, overall. Is it a virtuous or a vicious cycle? On a company by company level at least, it's seems to be easier to figure out if the way the growing pie is 'shared' with employment and management is reasonable or not.
-
^Short version: A similar debate occurred in the late 1990s and early 2000s about share-based compensation and, obviously, there were/are valid and different perspectives but the challenge, again, consists in answering the following question: If share-based compensation is not an expense, then what is it? Longer version: It's a multi-variable question so let's unpack. What this 'idea' is NOT about: -Is share-based compensation right or wrong? -Is share-based compensation an appropriate way to reward employees? -And even: Is the buyback decision a good one (capital allocation and valuation aspects)? If you can spot an investing idea (business prospects and valuation) and if the compensation/repurchase activities make sense, the thinking activity for this is irrelevant and can stop. The issue is that this 'temporary' unrecognized compensation cost has become very large, has been going on for about a decade now and, overall, the buyback activity has essentially (not quite) balanced the share issue from compensation to employees, making this cash outlay, conceptually, an operating expense that is not recognized. In May 2019, Mr. Yardeni released a piece (the drive was political ie don't fight buybacks but the data reported helped with the recognition issue) basically arguing that huge buybacks since 2011 had not really contributed in a big way to the growth of EPS because: "Since the first quarter of 2011, a total of 72 billion shares were repurchased. However, over that very same period, the number of outstanding shares declined by only 22 billion!". Viewed this way, overall, stock buyback activity appears to be matched to share issue related to share-based compensation with the goal to keep share count more or less constant. The issue is that there has been a HUGE growth (absolute and relative) in the difference between grant-date value and vest-date value of share-based compensation. This value can be measured. It's clear who gets the value but it's unclear who pays for it although it has to be the equity holders, somehow. The best analogy or concept i could use to extract the meaning of this disconnect is the use of loyalty points at credit card companies. It is clear that the credit card user (maybe the merchant) is the ultimate payer, in the aggregate, for the use of loyalty points. In the aggregate, you are paying the toaster that, supposedly, you are receiving as a ‘gift’. Credit card companies (and others like airlines) have had the genius to devise this free-product mentality. Whereas there are some people who clearly benefit from the judicious use of loyalty points (i think thepupil and KJP would be such people), this is a zero sum game in the aggregate (clients are ultimately paying for their gifts) and there is a bunch of patsies at the table. Somehow, the corporate world has orchestrated (voluntary, involuntary or whatever), or reacted to, a situation where the full cost (most of it) of share-compensation expense has become huge and is not recognized but is still nevertheless paid by investors who don't see it and who may happen to think that it's a free lunch. If share-based compensation is not an expense, then what is it?
-
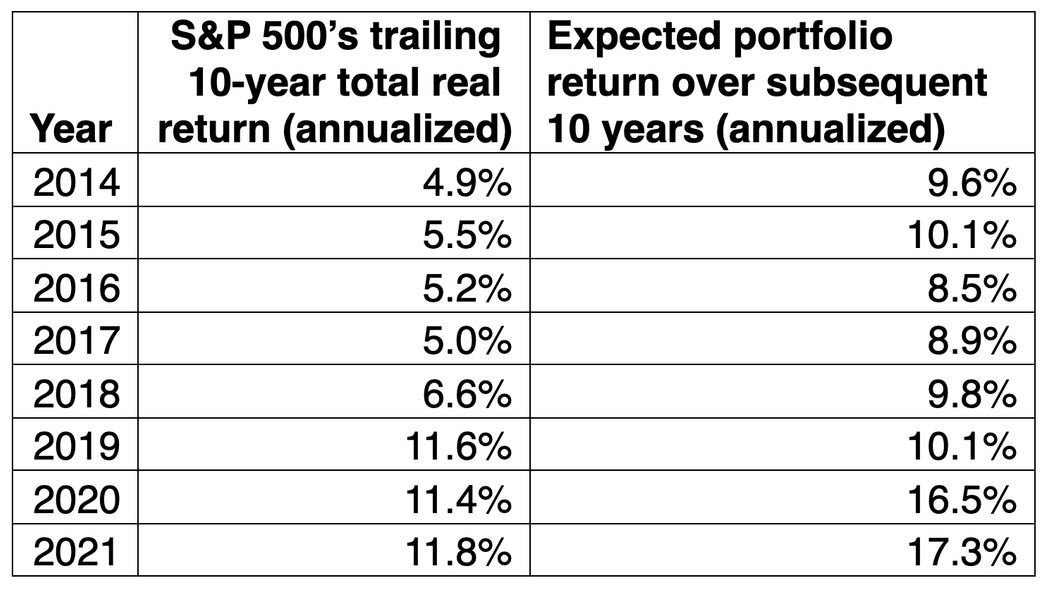
^A few comments about Google (a company about which i cannot form an adequate or relevant opinion concerning business prospects or valuation) and about the potential relevance of reversion to the mean for concepts such as CAPE. After looking at GOOG's annual reports for the idea developed above related to the unrecognized cost of share-based compensation (this is a more difficult task for Google compared to Microsoft for various reasons related to GOOG's policies and disclosures and the company withholds a percentage of vested shares to pay the income tax liability of the 'employee', related to this compensation). Assuming share price remains at around 2700 over the next 4 to 5 years and taking into account that share count has been reduced by only about 0.3-04% per year in the 2015-2020 period, this means that, for the 2015-2019 5yr-period, 75B of compensation costs will not have been recognized, compared to cumulative 114B net income for the same period. It's not 'fair' to compare this way because the 75B unrecognized compensation cost should be matched to the cumulative net income over the 2020-2024 period. However, if net income continues to grow at the same rate, it would be reasonable to expect matching share price growth. For GOOG in the future and only looking at unrecognized share-based compensation arising as a result of RSU granting activity during 2015-2019 period means an incremental 40B of unrecognized compensation cost per 1000$ per share price increase on top of the 75B mentioned above. It's reasonable to suggest that GOOG's net income has, is and will not take into account that reported net income does not factor in a 30-35% reduction in net income per year if unrecognized compensation costs would be recognized. All that to say that GOOG may be a great deal now and massive buybacks may make a ton of sense (i truly don't know). Without a 'moral' or regulatory perspective, it just means that GOOG's PE is not 27-28 but more like 39-40. That's all. ----- The CAPE topic is mostly remotely interesting or relevant but sometimes the math gets challenging (basic math). One of the underlying questions is to what extent reversion to the mean applies or not (range from 0-100%). When factoring in reversion to the mean, especially for segments of the companies followed and even more so for individual names, there are two basic problems: 1-reversion to the mean may NOT (like in never) occur. 2-reversion to the mean may take a long time to manifest, the path to the mean (and beyond) may be irregular and a long muddle-through phase may smooth out potentially interesting fluctuations in price. i think 1- is the possibility that Mr. Shiller described recently versus low interest rates. Even if it's hard to correlate general levels of interest rates to valuation levels in general and returns achieved, it's possible that, for conditions now (ie the last 20 years or so), interest rates and the yield differential with equities may play a fundamental and driving role in valuations. i think some people call this non-stationary of conditions. And with negative interest rates in sight (opinion) who knows? 2- is the reason why people who are right may look like clowns (there's also the possibly that clowns are wrong). One of the defining features of the modern era is that size no longer matters the way it did and one has to decide if that's also reached a non-stationarity situation. Mr. Buffett, early on in his partnership letters, described this potential drag on returns in relation to his own size (portfolio). These days, it seems that even the opposite is true ie as many firms grow larger, they become even more resilient and have somehow developed the capacity to dominate even more. Like ultra low interest rates, the size phenomenon has been quite a game changer for a while now. The size phenomenon is quite an unusual historical development. When i was born and after, people started to question the US' economic ability to grow as it was getting very large. If one looks at real GDP growth over certain time periods (for fun this is compared to real corporate earnings growth {Shiller data}), the size didn't appear to matter for such a long time. 1880-1920 1920-1960 1960-2000 real GDP growth (%) 1.4% 1.8% 2.3% real earnings growth (%) 0.3% 2.0% 2.3% For the 2000-2020 period, real GDP growth came at 1.2% and earnings growth came at 3.4%. Earnings growth are projected to increase by about 50% in the next two years which should help (if it happens) for the irreversion (the word irreversion does not truly exist but irreverence is the closest synonym if mean reversion is a thing to respect) to the mean for PE. Also, it used to be very bad news for large companies entering the Fortune 50 select club: No more, it seems. Reading a very interesting report lately discussing the growth potential of the select few: FANG, FAAMG etc, and applying the underlying assumptions to the greater picture suggested that the revenues only from those few would result in a revenue number larger 100% of GDP in a reasonably foreseeable future. The math eventually gets challenging even if negative interest rates are used. Recently, i also saw this well done survey about expectations (investors with a 10-yr horizon: Using the above numbers for where we're at in 2021 and integrating into quite reasonable assumptions for the real economy and general investment inputs, it is then expected that PEs in 10 years will be at 72. If one integrates the unrecognized compensation cost described above, 'we' should then reasonably expect a true adjusted market PE of 100. The bigger the better? Anyways, in his 1999 general valuation article, Mr. Buffett noted that, for lofty expectations to be met, three things needed to happen: 1-interest rates getting lower (getting lower, they did to the relative dismay of the Fortune article author over time), 2-corporate profit margins as a % of the economy getting larger (getting larger, they did despite the expectations of growing divisiveness if they did) {Note: NIPA corporate profit margins did decline significantly during the 2011-19 period but were still way higher than in 1999}, and 3-if a certain investing mentality persisted. Mr. Buffett is wise and did not make any predictions or forecasts then. He only said that the math was getting challenging and that expectations should be moderated. i wonder these days if it's the math that's getting incredibly challenging or if i'm not one who's mentally challenged.
-
Thanks. That was interesting. Along the same lines, here's a short read on negative interest rates. The piece was written by a bright physicist and, perhaps, this is the most important message. The Incredible Upside-Down Fixed-Income Market (cfainstitute.org)
-
^Shiller PE is only an input among many others. "Sure, when Shiller first published, the index may have been relevant - but that is getting on 20 YEARS ago. Today it is a completely different world." Translation: Shiller PE has reached a permanently elevated plateau and this time is different. Maybe. ^^ i've developed a different perspective (vs share-based compensation) when multiples drop: some of the compensation is lost but much is made up by granting new stock options and awards (at much lower prices). Companies also can use rules that allow them to re grant stock options or awards (replacing the previous batch) without losing the deferred tax asset as a result of the already recognized non-cash expense tied to the previous share-based compensation. i think most people do not realize how this expense has become a huge expense. There is nothing wrong with a large expense if the the future positive cash flows related to this 'investment' are worth it but (opinion) it's weird that a large part of this expense is not reported at the corporate level. The case of Microsoft and the growth in various relevant rates. Microsoft is different from the rest of the S&P 500 or NIPA crowd but it’s a useful example and it’s the one most closely linked to the SaaS theme. The main differentiating factors for Microsoft have been significant increase in sales and margins, especially during the latter part of the 2011-2 to 2019 period, as well as large stock-based compensation packages and buyback programs. Overall, differences tend to cancel out for this analysis versus the typical stock and it’s a relevant and representative example of the NIPA-S&P 500 disconnect in corporate profits over the 2011-2 to 2019 period. Evaluating the unrecognized GAAP cost eventually recognized by NIPA for a specific company requires some work, some estimates and some (retroactive) adjustments. Interestingly, GAAP requires companies to supply the numbers related to the market value of stock awards and options when the vesting date is reached. However, this is not to recognize or report the compensation as a true and full expense. It’s to allow the company to get a tax deduction for the true expense! When the true (but not reported fully) expense is higher than the cumulative non-cash amortized expense estimated upon the grant date, this results in a cash flow tax benefit in the year that stock awards or options vest. As mentioned, NIPA eventually captures this unrecognized cost and revises down prior years’ corporate profit results. So this true cost appears at the aggregate level but is never recognized for the specific company, Microsoft, in this specific example. This corporate cost not captured by the GAAP financial statements can be calculated by using information documented in the footnotes related to stock compensation and taxes, using the reported excess tax benefits per year and the yearly reported difference between the grant-date values of stock compensation and the vest-date values of stock compensation. There are potential sources of error. For example, the person exercising the option or actually obtaining the stock award may hold on for a while and the tax effect may be delayed in its recognition. Credible sources indicate that insiders’ sell/buy ratios have remained high and, looking at DEF 14As serially, it appears that stock compensation, overall, is not held for the long term apart from a core position built early on and rapidly sold when leaving the company. Also, the tax due on the sale of stock compensation may be mitigated by investments in professional sports teams or whatever but I assume that, overall, capital tax gains are rapidly paid by individuals benefiting from stock compensation at sale post vesting. There have been some changes in GAAP stock compensation reporting in 2016 but none of the changes impact materially the conclusions here. For Microsoft, here are the assumptions and method used in order to derive the yearly unrecognized cost related to stock compensation: -MSFT has moved away from options to stock award; stock awards vest after 4 to 5 years. -For years 2011 to 2015, each year’s cost is determined by amortizing over the previous 5 years the “excess” cost determined five years after the said year. For example the cost for the 2011 year results from the addition of the yearly amortized cost determined in 2016 and amortized from 2012 to 2016, and etc for years 2012, 2013, 2014 and 2015. -For the years 2016 to 2019, the same steps and principles are used and it is assumed that stock awards will continue to vest in a similar pattern for years 2021-4 as before ie with an estimation of forfeited numbers of stock awards based on the 2016-2020’s pattern. For year ending June 2021, the share price taken for vest-date value is 244, the mid-price for the year and for years 2022-4, the share price taken for vest-date value is 280 (more or less the share price now). In 2022-4, it’s possible that share price will double or more? but it’s also possible that share price decreases by 70% or more? so who knows? Obviously this assumption could have a significant impact for the last years of the period as the period from 2015 up to now has resulted, so far, in huge unrecognized cost because of the relatively high volume of stock awards in the preceding years granted at a much lower value than what was realized after. Table (all numbers in billions, except D) and E) in %) A) unrec. cost B) net income C) sh.-based comp.expense D) C/(C+A) E) A/B 2011 0.893 23.15 2.17 71% 3.9% 2012 1.197 16.98 2.24 65% 7.1% 2013 1.727 21.86 2.41 58% 7.9% 2014 2.487 22.07 2.45 50% 11.3% 2015 3.261 12.19 2.57 44% 26.8% 2016 5.410 20.54 2.67 33% 26.3% 2017 8.249 25.49 3.27 28% 32.4% 2018 10.651 16.57 3.94 27% 64.3% 2019 11.941 39.24 4.65 28% 30.4% Comments: -A/B seems to compare apples to oranges tax-wise (pre-tax expense versus after-tax net income) but remember that GAAP rules allow the company to obtain the excess tax benefits in the year stock-based compensation reaches the vesting (or service) date for this unrecognized cost even if the actual excess cost is not recognized as an expense. -In 2018, there were accounting changes and the impact of the Tax Act and net income was impacted by 13.7B so the adjusted A/B ratio is 35.2%. -The table confirms that the unrecognized GAAP compensation cost (but eventually captured by NIPA) became very significant during the 2011-2 to 2019 period as the value eventually realized by stock awards granted at relatively low prices and then exercised 4 or 5 years later, when prices were much higher, was very much higher than the fair value estimated upon grant. For example, those who were recipients of the granted stock awards (83M shares) during the 2016 year at an average price of 41.51 and who did not forfeit these awards (my estimate is that about holders of 16M of those shares did forfeit) did very very well, even after tax. That’s fine and this post is not about a moral position on this. It’s just that financial statements should normally reflect, in a transparent way, the full cost of employee compensation. -For the last 5 years of the period (2015-9), total net income, as reported, is 114.0B and the so far estimated unrecognized compensation cost is 39.5B (43.4B if the last share price last Friday is used on vest date ie 289.67 concerning years 2017, 2018 and 2019). This means that cumulative reported net income for those five years is not 114.0B but more likely around 71-75B. -For the years 2016 to 2019 and likely up to now, it’s reasonable to suggest that, for Microsoft, net income should be reduced by about a third or more in order to obtain the true core earnings, taking into account the unrecognized stock-based compensation costs. -During the 2011-2 to 2019 period, EPS (as reported) compounded (per year) at 10.0%, share-based compensation as reported at also 10.0% and unrecognized compensation cost, as estimated, at 23.5%. -On a net basis, for the same period, shares outstanding, diluted, compounded (per year) at -1.3% for the period and only at -1.0 to -1.1% during the latter part of the period, indicating that previous MSFT shareholders were, in large part and through financing cash flows, on the other side of the trade when the NIPA/S&P 500 corporate profits disconnect reached high levels and, essentially, buying shares at market prices way higher than grant-date value previously allocated from the market price contemporary to the stock awarded 4 to 5 years before. In other words, for example, MSFT is buying back stock now, in parallel to just vested stock, at around 280-290 in parallel to awarded and granted stock 4 to 5 years ago at 41.51 to 55.64. Now, that doesn’t necessarily mean that MSFT is doing a bad deal when buying back its stock these days but if the primary motivation to buy back stock is to keep share count more or less constant, then one has to wonder about the value proposition. -It’s also interesting to note that, for the same period, insiders’ percentage of stock ownership went from 10.42% to insignificant (1.39% in 2019 to below 0.05% in 2020) as Mr. Ballmer disappeared in 2014 and Mr. Gates decreased his personal holdings progressively. So, looking also at the present management team and the pattern of stock ownership over time, it’s reasonable to suggest that the huge stock-based compensation allocated during the last ten years was not a buy and hold for the long term type of decision. For the 4 years 2011-2014, average cash flows allocated to buybacks were 7.3B per year or 24% of average cash flows from operations. For the 5 years 2015-2019, average cash flows allocated to buybacks were 14.5B per year or 37% of average cash flows from operations. -For Microsoft, today’s PE of 39 is, in fact, more like 58-59. Not bad for a “SaaS” company’s market cap of 2.18T. -Doing this exercise for a sample of other companies (SaaS and non-SaaS) yields results that strongly suggest that the NIPA-S&P 500 corporate profits’ disconnect is essentially a story of unrecognized share-based compensation costs over the period.
-
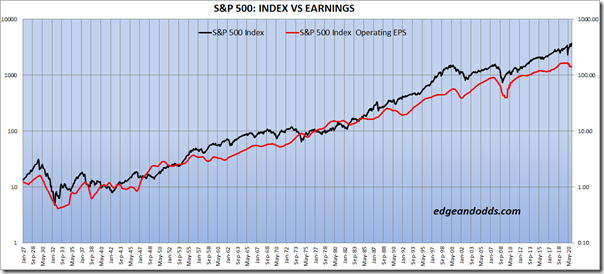
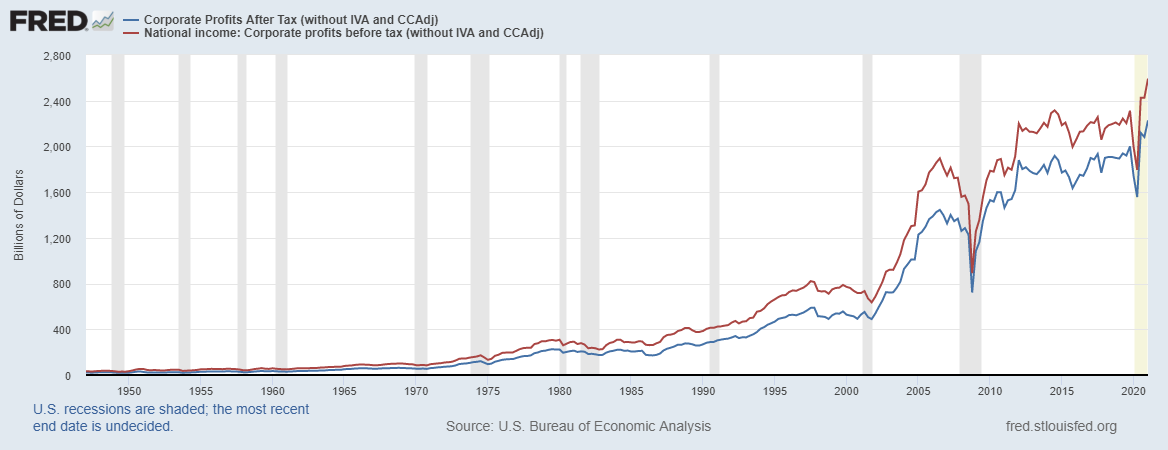
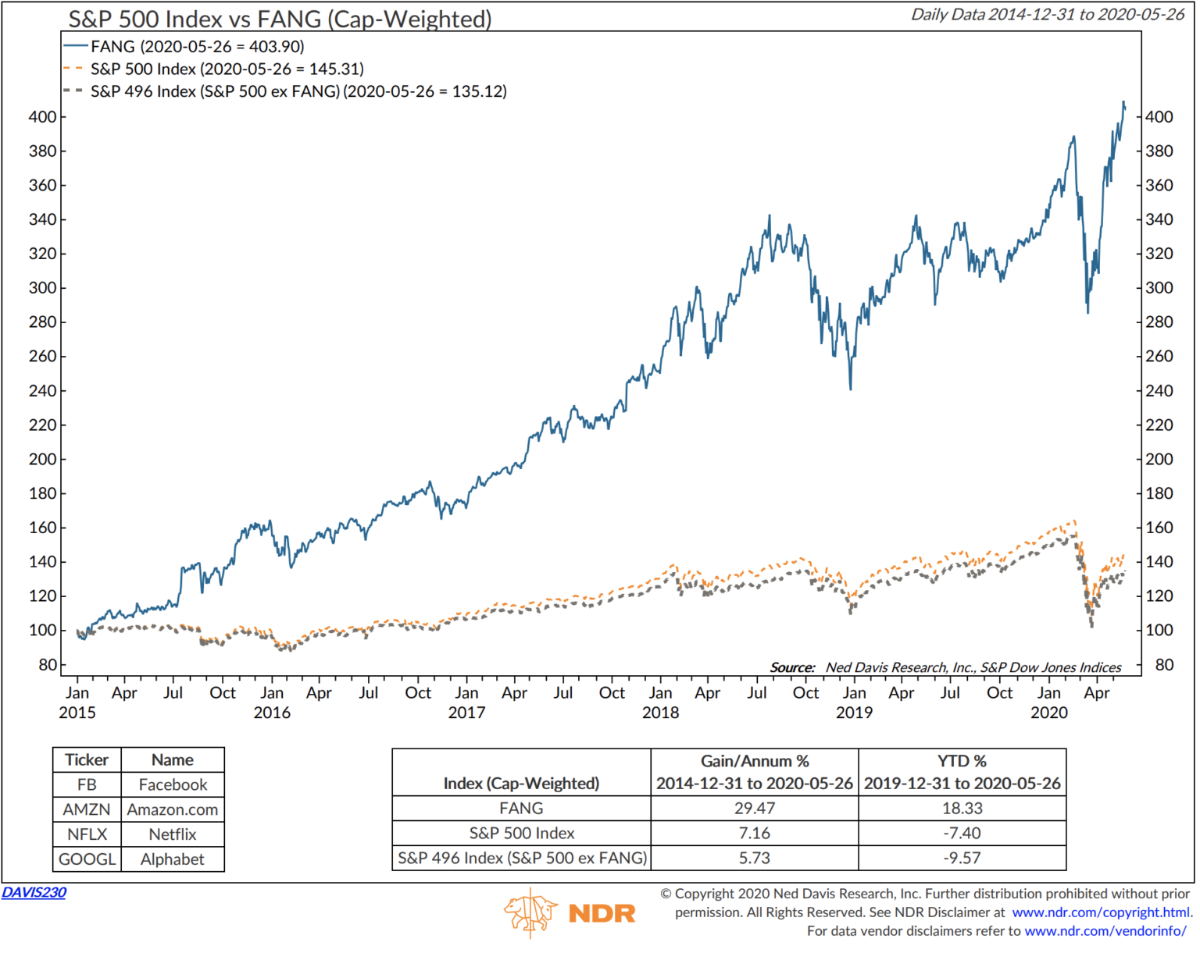
It’s risky to enter a discussion where the title contains « prediction » and « peak » and where a humble attempt at fundamental analysis may be interpreted as an attempt to spoil the fun. The idea here revolves around the link between earnings and the multiple that should be attributed to such earnings based on expectations of both components and to see if there is any relevance with the CAPE topic. And it’s particularly tricky when the line of thinking challenges previous long term trends that appear to aim for infinity, and beyond. Short version: NIPA profits show core corporate profits and take into account the full cost of stock-based compensation which GAAP does not, suggesting that present-day ‘traditional’ value measures such as PE and CAPE ratios based on reported earnings are, in fact, materially higher than officially reported. ----- Optional section and longer version: The sub-topic of interest here, for the market as a whole and also for individual stock picking, is the ‘quality’ of those reported earnings in the sense of their connection to true core earning power and more to the point the apparent disconnect that has built up between NIPA profits and the stock market GAAP reported earnings. This topic is neither exactly mainstream nor exciting, at least on the surface. Also, when occasionally mentioned by some, the subject tends to be accompanied by superficial analysis and the disconnect tends to be attributed to the notion that there are now a few dominant growth companies that benefit from intangibles, brands and economies of scale that skew profitability results and to the associated notion that there should be an appropriate multiple applied to such great prospects. This is a kind of topic where digging into numbers reveals very different conclusions. In the late 1990s, i looked into Microsoft and Intel and some related others and figured out they were out of my league (the main reason related to an inability to properly understand the business but there were issues with stock-based compensation). That’s too bad because, eventually, Microsoft’s stock price chart became parabolic. That’s OK and I’m happy for those truly enjoying the more recent ride. In those early days, when options were not really expensed, especially during the vesting period, i learned a few nuggets of investment knowledge going through the mechanics of stock compensation accounting. This was a time when, in some companies especially of the dot-com flavor, a large percentage of free cash flows was allocated to buyback activity and through detailed dissection of footnotes and retrospective feeding into missing financial elements, i was able to figure out that the eventual cost of stock options given to management ended up, at least for a while and especially during the parabolic phase, way higher than what GAAP allowed or forced to reveal. i recently learned that the NIPA-GAAP reporting disconnect was also a correlated element then and there may be relevance for today. Over the years, i’ve often done this type of work on specific issues when stock-based compensation and buyback activity were significant components and the disconnect between the periodic amortized cost of the reported “fair value” of this compensation can be way less than the ultimate true intrinsic value of the harvest. Of course, there are times when the ultimate value is ‘deserved’ (IMO not often, small characters). This post has likely reached a stage where absolutely nobody is reading but, to make sure, here’s a short review of the potential significance of this NIPA disconnect and the potential link to present-day CAPE. NIPA corporate profits correspond to profits reported by all corporations (public and private; large and small). The numbers are reported using a basic method which includes some estimation and sampling and then, in the following years, numbers are adjusted when data crystallizes towards the true numbers (at least to adequately reflect what NIPA is supposed to measure). It’s the type of stuff that eventually feeds into GDP numbers etc. Compared to GAAP reporting (S&P 500, Russell 3000 or whatever), the NIPA corporate universe is different because it includes also private and smaller businesses. Also, the data collection methods as well as the measuring methods are different. For example, during downturns, GAAP reporting will tend to under shoot and then to go back to the NIPA trend during the recovery but, over time, the long-term trends are (and should be) broadly similar, especially when comparing S&P 500 operating earnings and NIPA national profits after tax (with some typical adjustments: “without IVA and CCAdj”). That very tight correlation manifested itself up until the late 1990s. Then there have been two potentially unexplained periods (the topic of this post) of significant disconnect, one around the dot-com bu**le and another since around 2012. Why (and the potential utility for the whole market assessment or of specific issues) is the topic at hand. GAAP has specific rules and one could argue that there is a growing amount of management discretion and that’s something to consider. Also, it is being increasingly suggested that GAAP has become a poor tool to measure and report the growing importance of ‘intangibles’ but that’s another story. NIPA profits reported over time, similar to a depreciation concept and tax accounting, are characterized by temporary differences that get resolved over time, such as, for example, when they eventually factor in the tax assessment results that are eventually ‘discovered’ (in the sense of price discovery) in order to actualize results of previous years. They typically report revisions on prior years’ results during the summer (this summer should be very interesting) and sometimes revisions are quite large. In general, in the last few years, revisions have resulted in a significant decrease in reported corporate profits (lower ++ in 2019, higher + in 2020). So, the last reported years up to two to three years are less reliable. NIPA profits can also be characterized by permanent differences which is potentially interesting because it likely primarily reflects the permanent difference resulting from the NIPA recognition of stock-based compensation that is never fully recognized by GAAP. There are many lesser issues (pension adjustments etc) which may produce permanent differences but those have not been historically associated with material differences. Another source of permanent difference are large write-downs that tend to get reported in GAAP (not NIPA) during major economic downturns. This was especially significant during the GFC but this aspect is not relevant for the 2011-9 period or not likely relevant for the more recent sharp down-up viral-related events. The major source of permanent difference is related to stock-based compensation. A foray into stock compensation accounting since they have been expensed reveals that GAAP accounting for about the last 15 years requires to estimate the fair value of the stock options allocated upon grant and to allocate this value over the vesting time period, irrespective of the ultimate value realized. Similar principles apply for stock awards (fair value calculated at grant date and then expensed over vesting or service period). The ultimate value could be less than initially estimated for example because more people leave the company than planned giving rise to an unusual level of options forfeited. This is usually accounted for, from the start and adjusted afterwards. The ultimate value could be less or more, depending on the actual evolution of the underlying stock price (and on the timing of the owner’s sale of the stock) and this is where NIPA profits come in handy. Because the NIPA corporate profits method eventually integrates tax data and the value eventually realized by holders through tax data, the ultimate value realized is captured and this helps to determine who benefits from this value and who pays for it. Lately (since about 2011-2012, ie after the noise related to the post 2007-9 recovery), the GAAP profits have diverged from NIPA profits and although there may be several explanations, most likely and by far, i think this means that reported GAAP earnings have overstated core underlying earnings as stock prices have done unusually well and as NIPA has been showing the eventual value realized from stock options (and stock awards) and how this should be deducted as an additional items in operating expenses of prior years. Note that the full realization of this disconnect takes time. Here’s the standard reported NIPA profits chart on which is overlaid the equivalent pre-tax numbers. This shows that, for the 2011-9 period, corporate profits have not increased much and, in fact, have been quite flat for many sub-periods during 2011-9 (especially pre-tax). One has to juxtapose the GAAP corporate profits in order to detect any meaningful deviation and then the challenge is to go for explanations and see if it matters (for the ‘market’ and also for some specific corporate equity securities). Historically and typically, NIPA profits are about twice the S&P 500 profits. I’ve made simple graphs on paper combining the two curves over the relevant periods but here are two helpful graphs for which deserved criticism is warranted but they show a few notable findings. With the two curves juxtaposed, we see that the two lines have been very tightly correlated up to the mid 80s (and also tightly correlated up to the late 90s). The data also depicts an explanation for what could be identified as a cause for a deviation during the dot-com phase with the value of stock compensation mis-measured and under-reported during the build-up and the NIPA profits eventually revealing the true value of management’s stock compensation. A similar and likely larger phenomenon with a similar origin has been building up more recently. The top graph also shows the potential impact of revisions for the most recent years. The graphs above stop in 2019. Both GAAP and NIPA curves have been quite noisy during the 2020 exogenous downturn, during the centrally mandated artificial life support and during the reflated ‘recovery’ in 2021. Let’s keep the focus on the period from 2011-2 to end of 2019 for now. Numbers Note: numbers for NIPA and S&P 500 GAAP are not the same; they are used for % change for the period. NIPA for the year is the sum of the 4 last quarters (after tax). GAAP are EPS operating earnings (after tax) as reported by Standard and Poors. End 2011 End 2012 End 2019 %change 11-19 %change 12-19 NIPA profits 1537.5 1821.5 1938.68 +26.1 +6.4 GAAP 96.44 96.82 157.12 +62.9 +62.3 Note: NIPA pre-tax for the 2011-19 period: +23.1%, for the 2012-19 period: +3.8% Note: In order to quantify the difference between NIPA and S&P 500 corporate profits, what to choose for the starting year after the GFC recovery (to avoid the noise described above during downturns and recoveries)? i think it’s reasonable to take an average of profits of the two years (2011 and 2012) as starting points for the period ending at end of 2019, which comes to a 47.2% difference in growth between NIPA and GAAP profits. Note that revisions will be made for the more recent NIPA years and it’s possible or even likely that it will be established that more recent NIPA profits will even be lower if the underlying thesis of this post applies, given the relatively strong rise in share prices in 2019 and 2020. Those who follow federal income tax receipts will note that end of year receipts (received in July 2020 for the 2019 year and in May 2021 for the 2020 year) were quite large and likely correlated strongly to significant capital gains (some of which related to stock-compensation exercise). So the 47.2% number is likely a conservative number. Conclusion IMO, most of this (47.2%) difference comes from the value of options and stock awards that have not been fully recognized (as a cost of doing business) yet (and never will be under present rules) in the GAAP numbers. Note that there has been noise in 2020 and 2021 and earnings plunged, recovered and more. Also, stock-compensation has mostly continued and buyback plans are back in vogue. Assuming the Q1 2021 S&P numbers are annualized for the entire 2021 year, year-end S&P operating earnings will have increased by 20.7% versus 2019 year-end numbers. Based on the inputs described in this post and others, I think it’s reasonable to assume that NIPA-S&P 500 disconnect has remained the same and possibly increased some more. This means that, when assessing the market, for the period from 2011-2 to 2019 at least, it can be suggested that something like 47.2% of earnings are earnings above the NIPA corporate profit baseline and are basically earnings without taking into account unrecognized costs ie not true earnings. The relevant PE or CAPE numbers need to be adjusted to reflect this aspect. Using basing math results in the necessary reduction of 29% in GAAP earnings which results in a 1.41x adjusting factor for the adjusted PEs versus reported PEs. So this can be reasonably done for CAPE since the method involves adjusted earnings over a ten-year period very similar to the 2011-2019 period in duration and timing. The last reading for CAPE has been reported at 38.7 which means the adjusted for stock comp CAPE would be at 58. However, the CAPE ratio is based on 10 years and the disconnect has likely been building up gradually over the period and 58 is likely too high a number. Anyway this is sliced or adjusted, the CAPE adjusted for the disconnect has reached a level likely around 45 to 50, a level never reached before in the US and relatively comparable to what happened in Japan in the late 80s, taking into account accounting adjustments (whatever that means for the US now). Potential limitations The first objection is that the NIPA world is different (different companies, different sizes, different measurement methods etc) from the S&P 500 world. Maybe, but even if true, this did not seem to cause permanent, unexplained and irreversible deviations before, when stock options were not a significant and relevant variable. Overall, the critical variable strongly appears to be the unrecognized stock-based compensation because there are no clear reasons as to why NIPA profits should suddenly, significantly and persistently deviate from the S&P 500 earnings and the stock-based compensation variable can strongly explain (timing, extent etc) the deviation based on observed inputs for many companies and in the aggregate. This assessment relies on a difference-in-differences principles method based on top to bottom consistent and rational connections. Even if parts of the S&P 500 have, for whatever reason apart from the unrecognized stock compensation issue, diverged from the rest of the S&P 500 or from the larger world of investments, a fact remains that overall corporate profitability growth has been very poor and if there is any small segment that has done better, this means that the remaining larger segment has done worse than poorly. A second objection is that the S&P 500 may contain a large fraction of companies which have a large component of foreign revenues and profits. Again maybe, but even if true, from official data, the increase in foreign profits (FRED corporate profits after tax, rest of the world) for the relevant period come to about 100B, an amount which is relatively significant in itself, but even if allocated entirely to the S&P 500 companies, would not materially explain, by itself, the growing deviation between NIPA and GAAP profits. Also note that foreign profits have been tightly correlated to foreign exports and the US entered an export recession starting in 2019 and which is still going on at this point. A third objection is related to variable levels of corporate share compensation and share buyback activity. Again, while the level of such activity may vary and may be relatively concentrated in some sectors, the 47.2% calculated above is an average number for the market as a whole. Some companies will be more involved and others, less. A fourth objection is related to the notion that there are a few large corporations which are dominant, have high margins and which are heavily involved in stock compensation and buyback. While this is true, compared to the dot-com period for example, share-based compensation is now widespread and, since the GFC, very high levels of corporate buyback activity have occurred widely. To illustrate this aspect, look at the differentiated market performance of the S&P 500 with and without its star or dominant performers. Also, comparing the top 50 with the S&P 500: https://www.spglobal.com/spdji/en/indices/equity/sp-500-top-50/#overview Looking at this aspect from many angles and using many inputs, it’s possible that the S&P 500 group increased net profit margins for the relevant period by 1 to 3% versus the rest of the NIPA corporate world (thereby slightly increasing the gap that existed before between larger and smaller companies) but this number is very small versus the 47.2% estimate. Also, despite huge buyback activity over the relevant period, overall, share count has been decreasing by less than 1% a year, a number that, even if compounded over the period, is small versus the 47.2% estimate. The cost of business related to management compensation has not been completely recognized and this aspect essentially explains the NIPA-S&P 500 profit disconnect. If you have companies in your portfolio with convertible debentures or such that need to be marked-to-market every quarter, just look at the huge impact that small change in assumptions make and the huge impact of rising share prices during the phase where conversion has not occurred. Even if you happen to think that this whole thing is bogus, it may be a useful exercise to try to determine the true cost of stock-based compensation in the companies making up your portfolios. It’s been an eye-opener for me at least. That’s what NIPA profits reporting accomplishes at the aggregate corporate level and the full cost of stock-based compensation can be evaluated for individual companies, even if not recognized, using GAAP reporting requirements in the footnotes. But then again, some will say who cares? Some would say it doesn’t matter since this not-yet-recorded compensation expense is paid by new shareholders joining on board along the way. To this objection, I would say not quite because i’m not sure if this cost has been truly integrated into valuations, along the way. Also, if the company buys back its shares on the open market and sits on the other side of the trade, calendar year free cash flows are used and, conceptually, the full price of this prior years’ compensation is assumed by the company itself, while bypassing the income statement, so already-on-board shareholders also shoulder these costs. If stock compensation management expenses are not expenses, then what are they? For example, the stock compensation packages are huge at Facebook and Microsoft but their share count has been decreasing very slowly lately, despite very significant buyback activity. Some management use the stock compensation to actually increase their equity stake in their respective companies but, in the main, equity obtained through compensation schemes are simply opportunistically sold with a short term orientation. I wonder if this will not be looked at by regulators, eventually. In these types of scenarios, typically, these deficiencies are remediated after the fact. And then what if this is already priced in by the market. Then fine. The only thing is that the PEs (as a rough guide to valuation) need to be adjusted to reflect these unrecognized costs. Using a rough one-third of earnings as unrecognized costs over total earnings including unrecognized costs (relatively conservative for the two examples), the PE for Facebook goes from 30, as reported, to 45, as real, and the PE for Microsoft goes from 39 to 58. I don’t know how to value both companies but for those who do, the stock compensation costs need to be recognized somehow. Also, PEs of 45 to 58 also result in earnings yields higher than the 10-yr Treasury, if that’s felt to be the relevant benchmark… Maybe, the fundamentals warrant these true earnings multiples and history may eventually confirm that present prospects are truly outstanding but present (and adjusted) valuation levels are similar to the Nifty Fifty period (for the some of the leading issues) and to the very late 1980s in Japan (the whole market). In Japan, the outcome showed eventually that the lofty expectations were absolutely unrealistic. However, basic empathy requires to consider the Japan environment from the late 80s perspective which was quite optimistic about the future. The Japanese market was surfing on a wave which saw Japanese stocks return 23% per year over two decades (and an increasing trend for returns) and people simply expected more of the same. Their own late-80s PEs were quoted to be in the 60 range but an interesting feature was that accounting peculiarities of the Japanese-GAAP-equivalent made their PEs look higher than they really were, perhaps around 25% higher…Anyways their lofty valuation levels based on rear-view-mirror analysis met, head-on, with fundamentals that turned out to be unusually poor and enduring. Ouch! For the Nifty-Fifty stocks, the historical record showed that the optimistic expectations were, at least partly warranted, for many of those stocks, but it took more than twenty years for the high-flying PE stocks to surpass the performance of stocks which had lower valuation multiples and one had to go through a few very miserable years (including the brutal 1974-5 years; these were inflation years, ouch!). Mr. Munger has talked about this period and how he had a hard time (he was not into the Nifty-Fifty frenzy but the whole market swooned), especially considering the other people’s money component. Examples of Nifty-Fifty stocks that ‘deserved’ to be held for the long term whatever their price (this does not apply to many of them though) were (with high-water PEs and percentage decline in the nasty 70s): American Express-38 -75%, Anheuser-Busch-32 -70%, Coca-Cola-46 -78%, Disney-71 -86%, McDonald’s-71 -72%. A lot has been said about Mr. Buffett and the timing issue during that period and some think that he rolled over cash and bond holdings to equities during the 1974-5 downfall but that does not quite fit the reality. In general, during the corrective phase, the top 25 Nifty-Fifty stocks declined by 67% and the rest of the S&P 500 stocks declined by 29%. Entering the 1974 period, Mr. Buffett (through BRK) was highly invested in stocks that were not part of the Nifty ones (they were largely safe and even bond-like equities), waited for the recovery to sell them but took advantage of the 1974-5 period to back up the truck for some opportunistic equity opportunities using available liquidities. And the rest is history which often rhymes (He did eventually invest in KO). Another consideration is that what has been happening in 2019, 2020 and 2021, related to this specific unrecognized stock-compensation issue, will likely be characterized (eventually recognized) by more of the same and more. Final point This unrecognized cost ties in well with what bizaro mentioned above about wage costs eating away at margins. If you simply look at GAAP profit margins these days for the period preceding the covid noise (and the associated corporate welfare, oups i mean corporate subsidies), you see a high and rising net margin trajectory which hides the gradually increasing rising trend in general wages (going from 2 to 4% per year, with no link to the 2016-20 term). If you add to that the presently unrecognized cost related to stock compensation (part of general wages but unrecognized), since 2012, you see a declining line, meaning that operating profits are going down in correlation to true and full operating costs and this divergence has been rewarded with higher multiples. Is that justified by low interest rates? A final consideration is that increasing share of free cash flows used for buyback is happening during a period of decreasing operating and net margins with higher use of corporate leverage and lower rates of capex investments, all aspects raising sustainability and resilience issues. Take-home messages -There is something weird going on in the cost recognition of stock-based compensation expense. -The cost has been recently unrecognized and is giving rise to a large, growing and looking-quasi-permanent disconnect between basic core corporate profits and reported profits. -This aspect (that needs to be adjusted) combined to general valuation levels means that we are going through one of the highest valuation period ever based on the multiple paid on core underlying earnings. -This analysis has no value for prediction but consideration should be given to hold lower valuation securities or cash for optionality and self-administered intrinsic cognitive tests should be done using various stress tests in order to evaluate the meaning of long-term holding strategies. -An interesting exercise for your favorite stocks, if applicable, is to actually go through the calculations necessary to estimate the true cost of the stock-based compensation arrangements (options and stock awards).
-
^After wabuffo, i would say Mr. Pozsar is the person to turn to for an interesting and valuable perspective about these matters. His notes are short and he uses helpful analogies (ie toilet tank mechanism analogy). His perspective was helpful when there was a repo 'crisis' in September 2019 (repo rates were shooting higher then, when it was realized that there was a level of excess reserves that was not, in fact, excessive, under present regulatory and capital restraints). So much for tightening and the i- could-stop-any-time-i-like mentality. His most recent take (and short term technical outlook vs debt ceiling discussions and all) is included here: https://plus.credit-suisse.com/rpc4/ravDocView?docid=V7r9LA2AN-Vvd1 Mr. Pozsar describes a situation where basically all the cash that was 'spent' from the account held by the Treasury at the Fed has been rotated to the RRP facility (through money market funds). He expects the RRP to continue to build up. It appears that the Treasury will aim for about 450B in the account for the summer transition, a level higher than prescribed but apparently justified because of 'extraordinary' circumstances. If you think it's possible to determine if the level of traffic at the Times Square intersection is a good indicator of the New York economy, then you may think that it's helpful to look into issues related to the central financial plumbing but it's mostly technical stuff, a topic for which Mr. Pozsar's provides a useful perspective. The underlying fundamental assumption though is that market participants will cooperate in good times and collaborate in less good times. The momentum trend for now is for the Fed to continue to provide, ad hoc, more temporary technical adjustments that tend to get larger over time (as a % of the real private economy) and that tend to become permanent.
-
Mr. Weschler, in his response to the ProPublica 'investigation', summarized well a reasonable and balanced way to improve the equity outcome for all, concerning this specific aspect (intent of the underlying legislation): "In closing, although I have been an enormous beneficiary of the IRA mechanism, I personally do not feel the tax shield afforded me by my IRA is necessarily good tax policy. To this end, I am openly supportive of modifying the benefit afforded to retirement accounts once they exceed a certain threshold." For the Roth-IRA equivalent in Canada (TFSAs), there is no effective cap but the CRA (IRS-equivalent) appears to be more pro-active (for better or for worse) and they seem to base their audit efforts and legal actions on $ thresholds. Based on a few relevant inputs, once in the audit phase, the CRA looks at the composition of the portfolio, at the frequency of 'trading' and a good defense is to show investment-based decisions in tax-deferred accounts that are proportional to what happens in non tax-deferred accounts. Rules could be clarified though instead of waiting for case law to develop and retroactive changes raise fairness issues as well. A simple cap or a simple cap-equivalent seem to be the most effective way to deal with this. In Canada, the tax-deferred education funds (RESPs) do not have hard caps but have effective functional caps because of the finite life of the programs. If you end up with excess funds (more money than was necessary to pay for higher education), you have three choices: 1-use available room elsewhere to move the funds to another form of registered tax-deferred accounts (based on available contribution limits per year so no compounding possible), 2-transfer the excess funds to an education institution as a donation (not tax deductible) or 3- retire the funds as ordinary income taxed at 70 to 75%. The rules are somewhat cumbersome overall and you have to think like a defined benefit pension plan with fairly unknown assumptions but i think most dedicated participants 'get' it.
-
@LongHaul i'm happy to hear that. i understand that you show a healthy suspicion (disdain?) of experts. i also saw this interview on CNN: https://www.cnn.com/videos/tv/2021/05/21/amanpour-kahneman-noise.cnn This is early Sunday morning and here are a few additional points (some of which investment and noise related (and some not) and it may interest you? Recently (i got this through a Morninstar article), i spent about 5 minutes on a study (if it interests you, i could give you a link but i wouldn't bother since the study has significant limitations) which is relevant to the link between noise and investment decisions. The study was made in Taiwan (where retail investing is very significant) and the authors were able to show an increased level of buying activity in momentum stocks (through local brokerage houses) in the days following a specific event which was the occurrence of the public announcement of a local lottery win. It's possible that "feeling lucky" makes one feel like a real winner. This seems like a slippery and noisy slope. Some time ago, you mentioned a book which i had read before and which i did not find particularly useful but the topic is fascinating: Fear. And there may be a link about noise. Fear can be noisy (and ridiculed) but it's an emotion wired deep within our brain that has contributed to the survival of the species. For somebody heavily 'biased' to rational thinking, how do you decrease noise but preserve the basic fear instinct that can be fundamentally useful (even for survival, financial or otherwise). When in training in the 80s, it was required to go through a few weeks of psychiatry in the real world. As you may know, psychiatry is a very noisy specialty, a weakness which has been very partially addressed by devising a series of committee-type "DSM" diagnostic manuals with lists of specific criteria. The real difficulty is that those underlying criteria (fatigue etc) are very subjective. By combining very specific criteria into a constellation of symptoms, the noise is reduced, at least partly. The main lesson that i got from this experience was how to integrate fear into the algorithm concerning a specific situation. There was a rule that, when alone with a psychiatry patient (psychiatry patients can be, at times, dangerous), one had to sit between the door and the patient (to be able to flee or call for help in the event of threat). There's been some work to quantify fear or to find alternative and more objective measures of fear (including AI stuff) but this is an area where fundamental human intuition cannot be replaced. The best, by far, indicator of fear (as a threat to one's security or survival) is an intrinsic feeling that is difficult to describe but that is also unmistakable (if you're appropriately alert to it). When deeply felt, at least keep a clear path to the door (or the exit). It's the same with the fear and greed thing and capital markets that Mr. Buffett describes. Edit (final comment): This is an area where you may want to have a higher relative rate of false positives (margin of safety) but, obviously, that's an individual responsibility and the decision outcome may be correlated to the level of one's predisposition in "feeling lucky".
-
^Since the early 2002-4 hard market, i've used MarketScout and have found the tool useful for a general idea of the coincident market. For example, in 2002-4, it helped to map out what kind of growth (from the point of view of both price and number of policies) in NPW FFH would report. Market Barometers – MarketScout They think the hard market is moderating. ----- Even if these measures are coincident and relevant, they still don't provide clear answers about the softness of the past (Mr. Stephen Catlin whose opinion needs to be respected, for example, suspects that a lot of swimmers have been naked (in some significant areas) and that the tide has not quite receded yet) and about the surprises of the future. ----- An area of the market which may reflect the unusual risk appetite arising as a side effect of 0% interest rates is the catastrophe bond market (and the rest of the ILS market). Catastrophe bond hard market continued to weaken in Q2: Lane Financial - Artemis.bm The rates obtained likely point to relatively low returns going forward and leave little margin of safety (it's the insurance industry after all and we're talking catastrophes). ----- Conclusion: this is not shaping up to be the mother of all hard markets.
-
@Munger_Disciple Here's more reasoned content then: ---) Your conclusion is wrong. -i started out (the investing thing) wanting to have core holdings (index-like) and a few marginal relative winners and ended up (because of intrinsic and extrinsic circumstances, most of which outside my control) being unusually contrarian, concentrated and opportunistic which makes my participation useless at least 99% of the times here but i'm trying to improve. -i think this site should move more towards a VIC-style (focus on individual names, impersonal and factual analysis etc) of content but then you'd lose the meeting place aspect. It's a tough act to balance. -i tend to be a real jerk in real life but, contrary to most, anonymous participation in on-line discussions has a moderating effect on me. i've discovered that i even enjoy discussions in forums (elsewhere) where inputs are superficial in content, low in analytical power and littered with inappropriate statements. Humans are fascinating. -There is a topic (relevant to bubbles, macro and individual names) i've been working on and i may share some of the conclusions. ----) Back to: Are we in (one of the most interesting periods in history for investing) a bubble?