Cigarbutt
-
Posts
3,473 -
Joined
-
Last visited
-
Days Won
1
Content Type
Profiles
Forums
Events
Everything posted by Cigarbutt
-
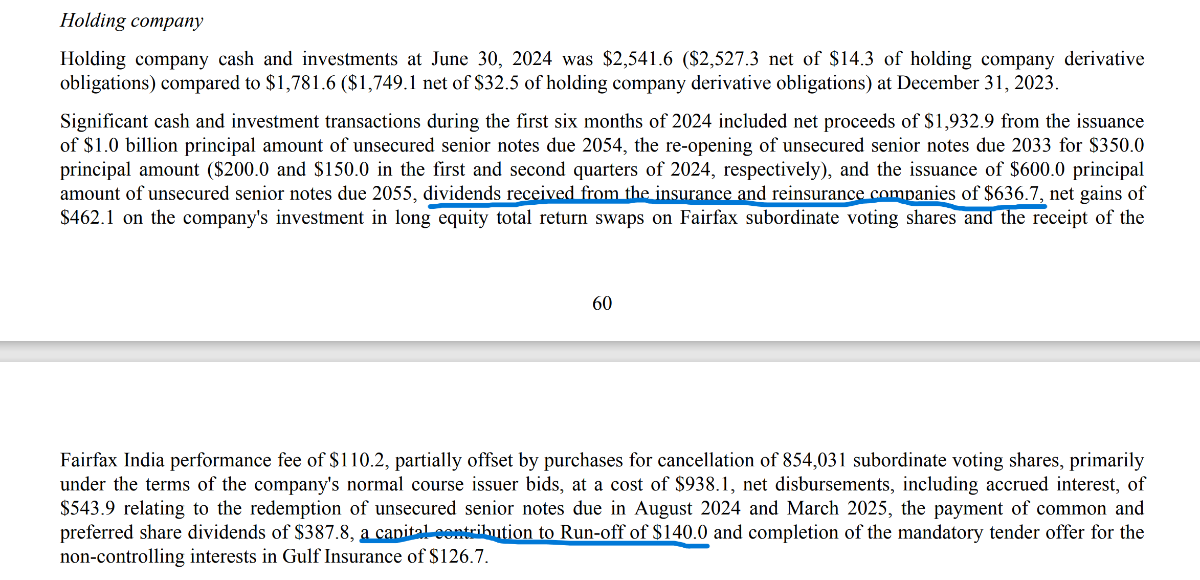
It's too early to tell the % dividend on preferred equity issued. On the initial capital (375M received), already the following dividends have been paid: 18.7M in 2022, 40.6M in 2023 and 12.9M in 1st 6 months of 2024 to which one may need to add a dividend paid to Class A shares (Omers) during the fall of 2024 and another 8M (?) upon repurchase (383M) of the minority interest last December. We'll know more with Brit's 2024 annual filings. At any rate, this was a good deal (for both FFH and Omers) even if dividends paid have a relative tax disadvantage versus straight debt.
-
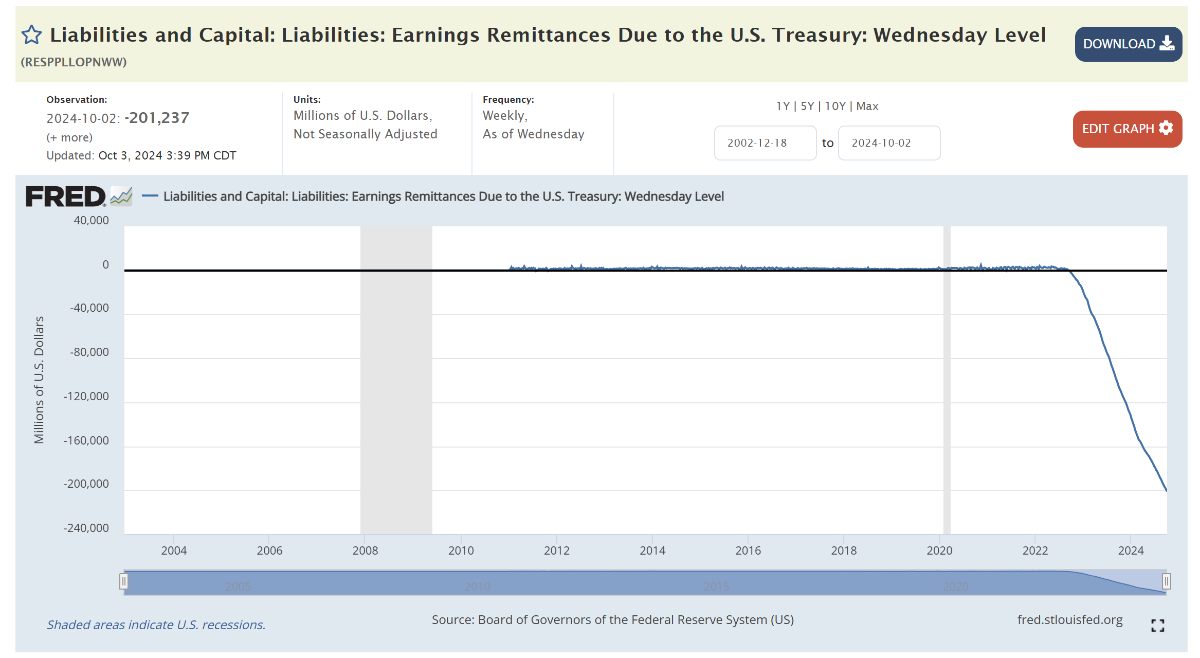
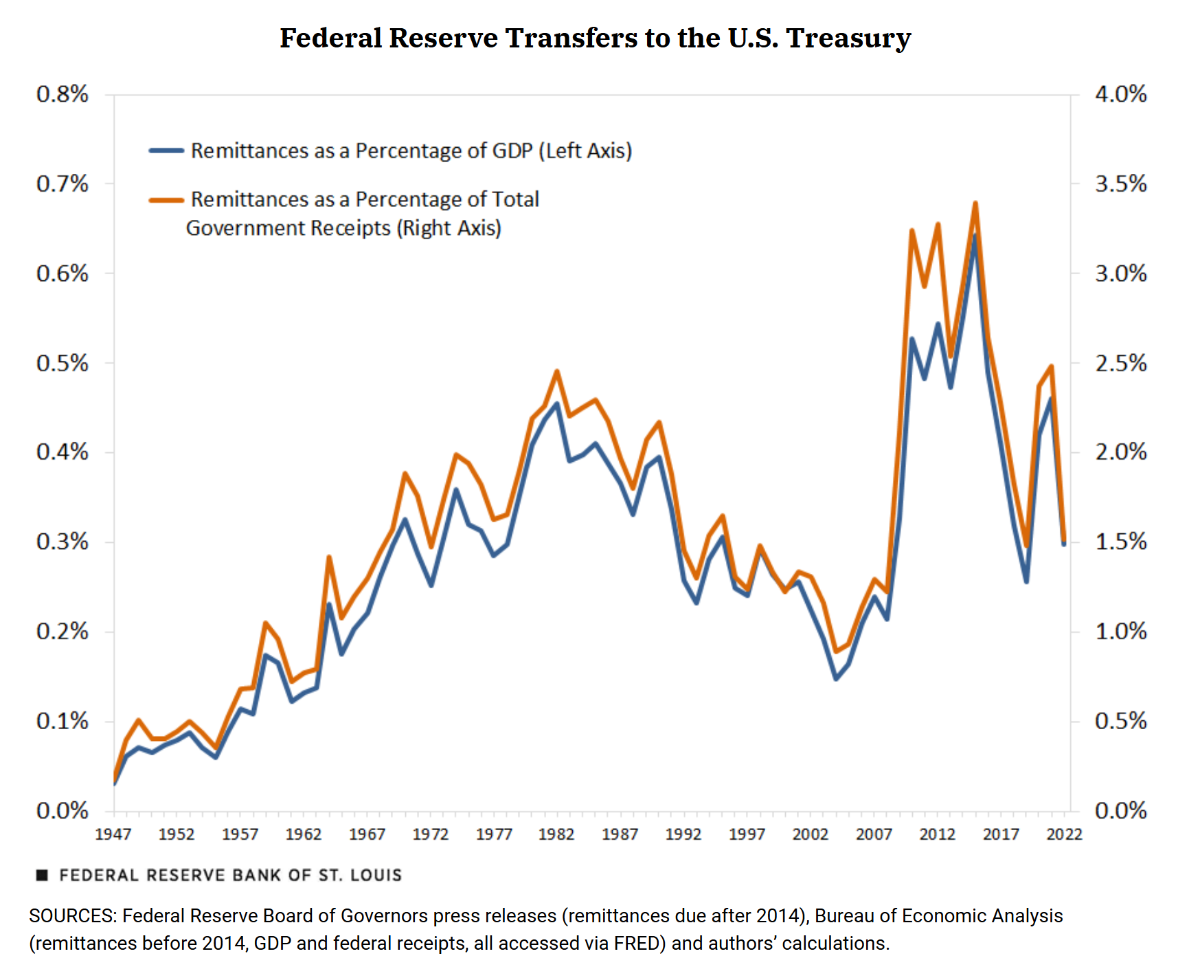
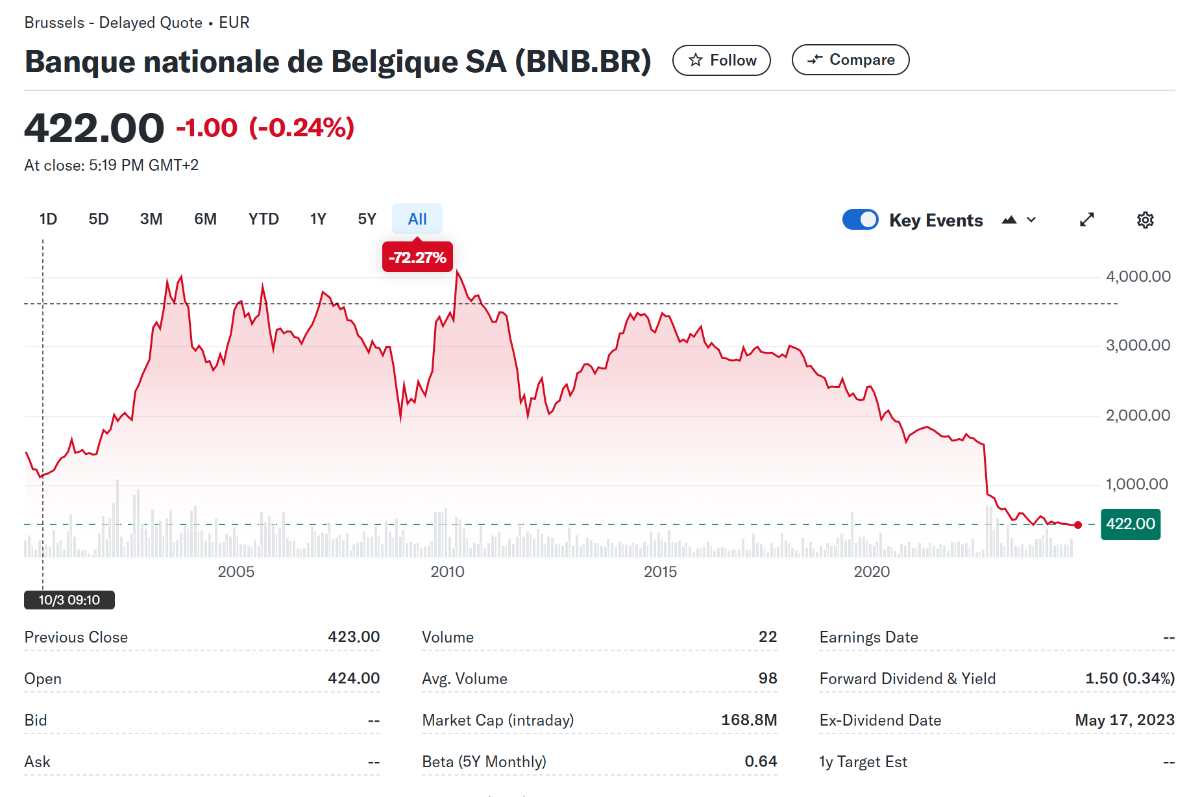
From a certain perspective, the change in trend appears significant. However, in the grand scheme of things, on a relative basis, the remittances are not that significant: and they are the ultimate referee for capital rules, including for themselves. ----- Still if you are an investor, in the typical sense, into such entity, the operating income and dividend capacity have decreased due to the asset-liability mismatch. The Belgian central bank (as a satellite-like branch from the ECB) can be owned by private investors and, from that specific point of view, the value, as derived from the 'market', has declined. Too much?

-
For anyone interested: Powering Intelligence: Analyzing Artificial Intelligence and Data Center Energy Consumption (epri.com) There is a downloadable report.
-
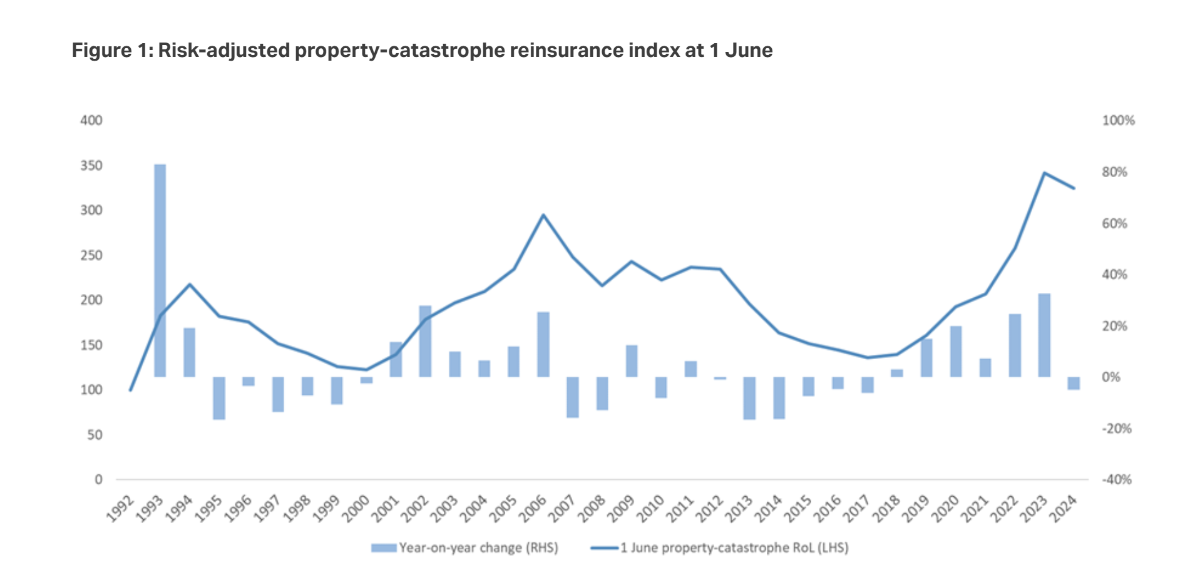
Ok, i will try to address this. Interesting article with an interesting view point. An unusually bad cat year would indeed hurt the bottom line but would also create an opportunity for opportunistic capital. Cat underwriting results make sense over the long term so another perspective is to ask is: is present policy pricing adequate? Cat risk has tended to remain at the primary insurers' level and underwriting in this area has been relatively poor. Reinsurers have remained disciplined for pricing it seems and underwriting results in the cat area have been relatively good. Discipline appears to be maintained: https://www.insurancebusinessmag.com/ca/news/reinsurance/reinsurance-price-reductions-nonsense-says-munich-re-ceo-505748.aspx For FFH, it appears that they have adjusted downwards their exposure to cat risk and have relevant and material exposure at the reinsurance level which could be adequately priced for results over the long term.
-
The likelihood that the author of the text is correct is extremely high. But always is a strong word.
-
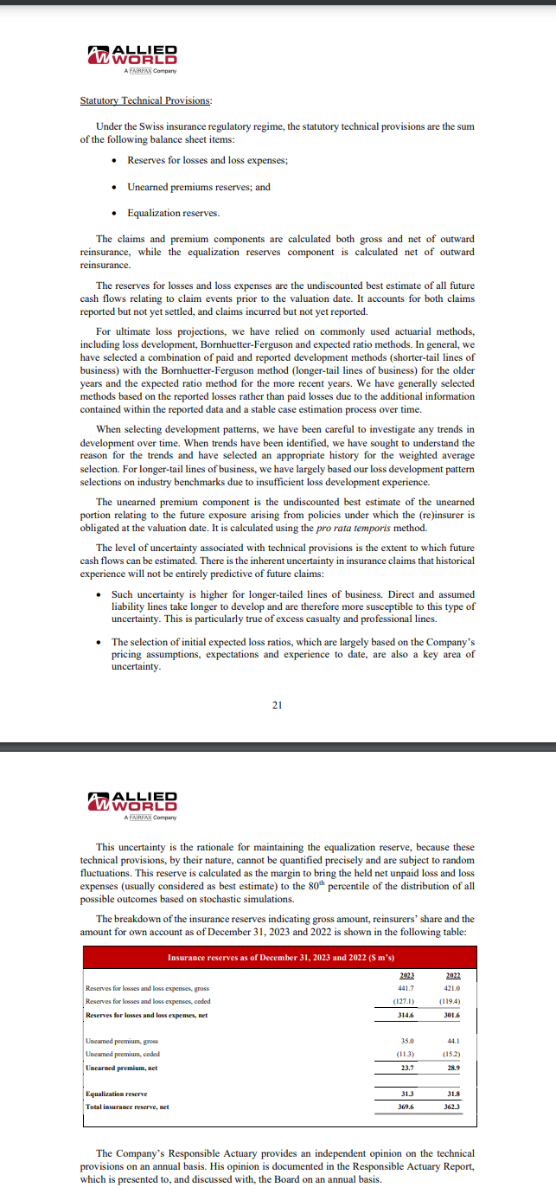
Yes and Allied World seems to have a similar approach, using another word for the margin of safety: "equalization reserve" Apologies for the small print, original can be found at: pages 22-23 (pdf document), annual report 2023 https://alliedworldinsurance.com/wp-content/uploads/sites/2/2024/04/AWAC_AG_SFCR_for_year-ended_31_December_2023_incl-Appendix.pdf FFH do seem to have a decentralized approach for conservative reserving across the subs but there seems to be a consistent and effective message somehow from head office. These examples help to understand how (culture) insurance subs recognize reserves on their balance sheets and how they "release" them. FFH, overall, has been consistent on this front for a while and, although difficult to be precise because it's hard to compare different apples, appears to have been able to differentiate themselves positively from relevant peers. Their reserving has been conservative for at least ten years and it is as if they have built some kind of cookie jar. The cookie jar term is not used pejoratively here (ie not to manage earnings) but simply to express that if you build a margin of safety cookie jar and remain consistent, your numbers will tend to consistently look better in retrospect, a feature which tends to be associated with resilience in the insurance world. ----- Of course, in relation to this thread, conservative reserving is super important for 'catastrophes, hurricanes, storms etc but (absolute and relative) market exposure at reasonable prices and a long term view are essential given the larger variability (good and bad) in results.
-
Ok, here are the key aspects which i think are relevant. But first, one would need to know what @SafetyinNumbers really meant by "reserves released in Q3". Of course, if @SafetyinNumbers meant higher underwriting profit in Q3 due to lower hurricane activity in Q3, then i agree but it's a different topic. Reserve release means anything that will reduce the insurance reserve liability. The first cause would be in the normal course of business when money (from float asset) is paid to pay claims. Then the decrease in assets matches the decrease in liabilities and there is no profit from the reserve release. Then, in Q3, with lower hurricane activity, one would expect lower reserve release. The second cause would be in the realization that reserves held for the current year and, especially, previous years (catastrophe insurance is very long tail and has a significant "yet to be reported" component) were in fact too high and reserve development over many years confirm a significant enough net trend to result in a reserve redundancy that is significant enough to be reversed (decreased liability, without an effect on float assets, so then a profit from the reserve release). Also, many policies are multi-year and the risk is spread in layers and it may take a while to figure out which (re)insurer is paying what to whom. On top of that, regulators (and most actuaries) would be reluctant to consider an unusually favorable development over one quarter for such uncertain lines of business as a sufficient reason to significantly lower overall catastrophe reserves for all other previous relevant quarters.
-
If...not really as catastrophe reserves' annual reassessments which typically happens in Q3 and Q4 are based on multiple years and cat risk has a stochastic (random) component which requires more prudence in reinterpreting trends. If anything and if recurrent, what happens in Q3 2024 may have some effect at the margin of the deficiency/redundancy spectrum.
-
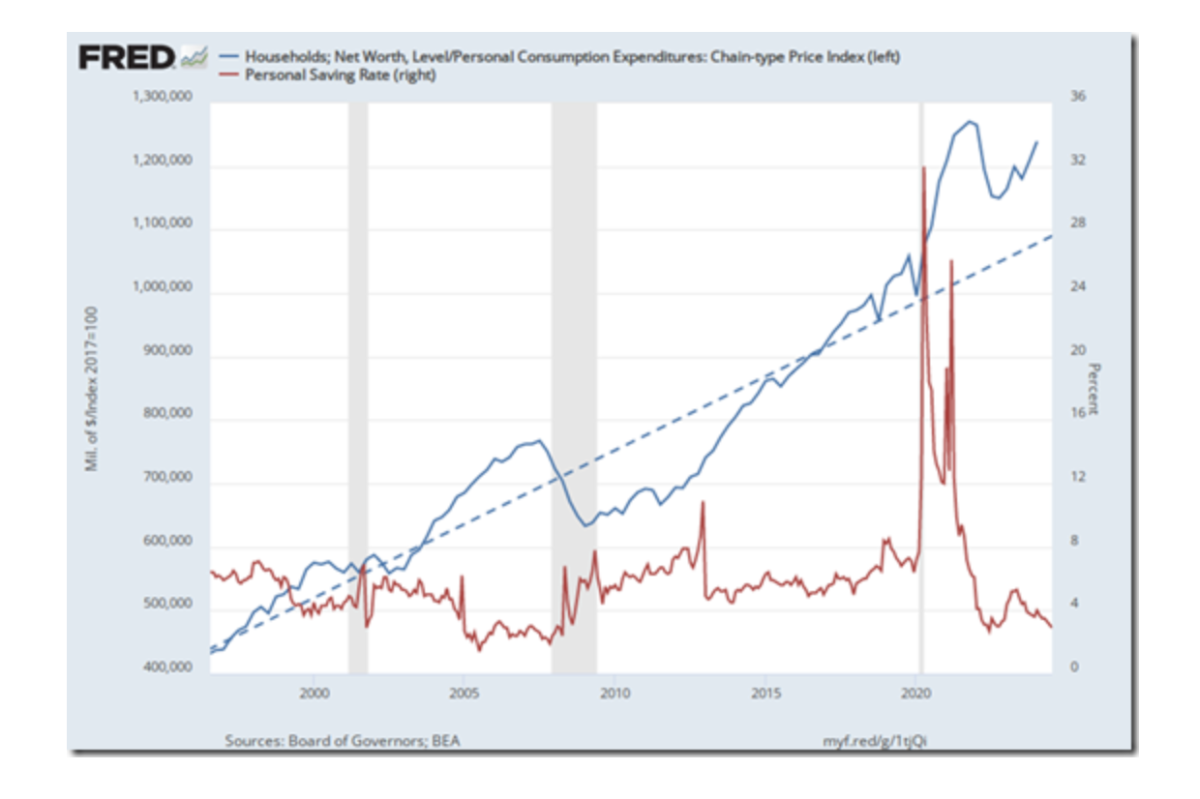
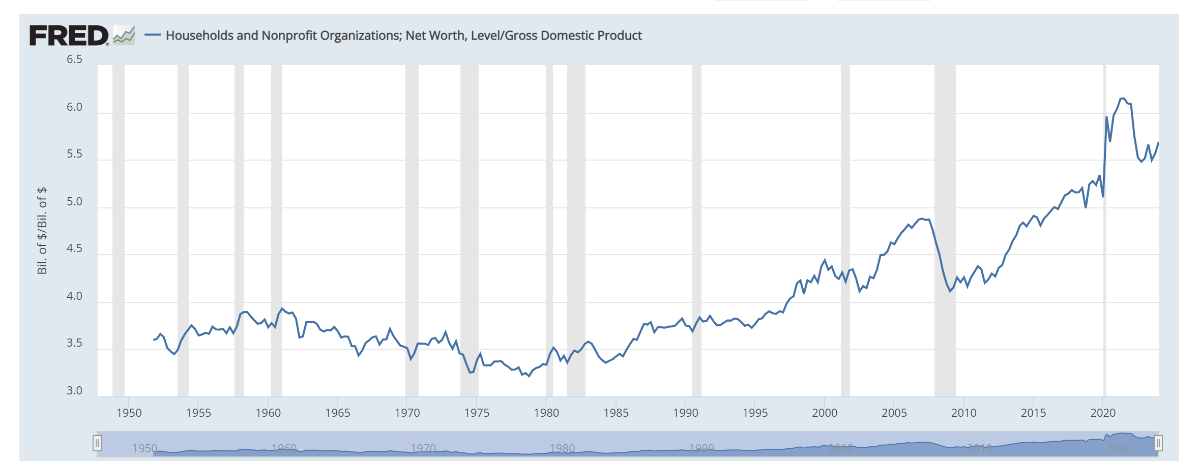
The topic here then is -Is the saving rate going down? -Is the saving rate inversely correlated to some kind of wealth effect? -Is there a cause and effect and in which direction? Look at more recent trends and forget about the covid noise. -In the years leading to the early 2000 dotcom era, many in my anecdotal crowd were doing well with rising internet stock values and didn't seem to save as much as a result. This seems to match the data at the aggregate level. -In the years leading to the late 2000 real estate era, many in my anecdotal crowd were doing well with rising real estate values and didn't seem to save as much as a result. This seems to match the data at the aggregate level. -In the last few years, many in my anecdotal crowd have been doing well with rising real estate and stock values and don't seem to save as much as a result. This seems to match the data at the aggregate level. Based on the above, i would suggest that rising household net worth above trend has been interpreted by the crowd as a sufficient store of value that, at least partially, replaces the need to save.
-
Yes, there is always something to do and those 'sentiment' indicators have poor foresight value, especially short-term, but still this noise may reflect general valuation levels. -Conceptual aspect It is often interpreted that these changing allocation parameters directly result from people moving from one asset class to another. In the aggregate, however, this is not reflecting reality. When Blake buys a stock from Joe, Joe exchanges the stock for cash coming from Blake. The rising allocation to stocks reflects, mostly, rising relative valuation levels. The word mostly is used because, for some years now, as a result of net QE (although not money printing really) and as a result of commercial banks holding larger levels of government debt compared to GDP (true money printing), more 'money' is in circulation compared to underlying economic activity. Correcting for this feature, the allocation to stocks and real estate is even higher that the WSJ article suggests. Anyways, on a net basis, this has been going on for a while and has been inversely correlated to gradually decreasing, overall, personal saving rate.
-
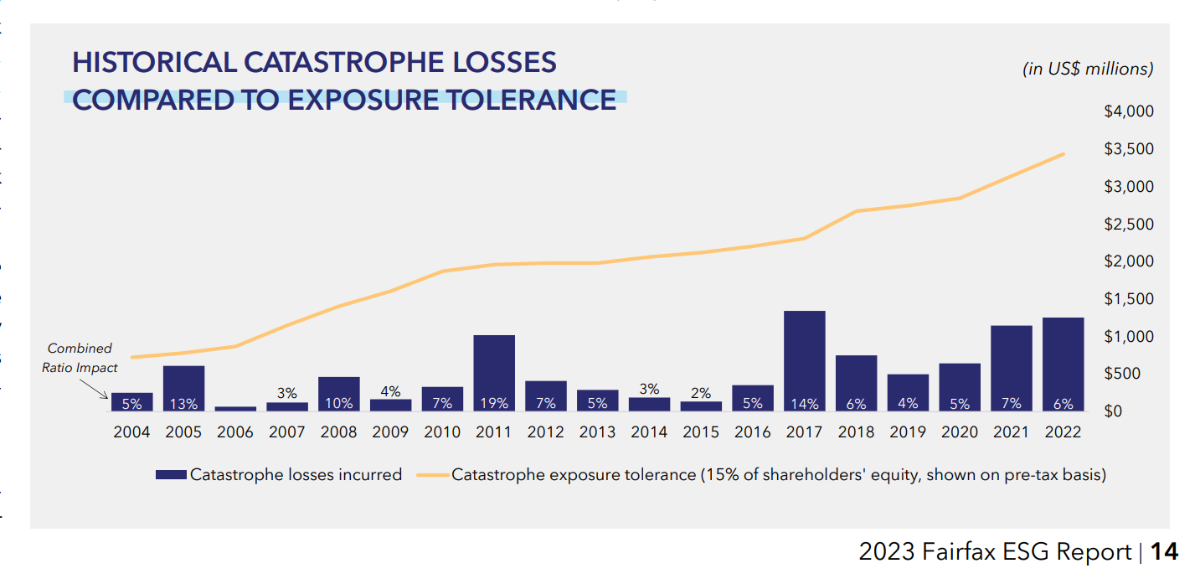
^Just to add, increasing expected costs are based on past historical experience and of course the future could vary (outliers, changing trends). From the report above and other references, the underlying drivers of previous trends have been: -cost inflation -climate volatility (...) -and (often underrecognized?) the growing concentration of 'inflated' asset values in at-risk areas (urban and wildland-urban interface)
-
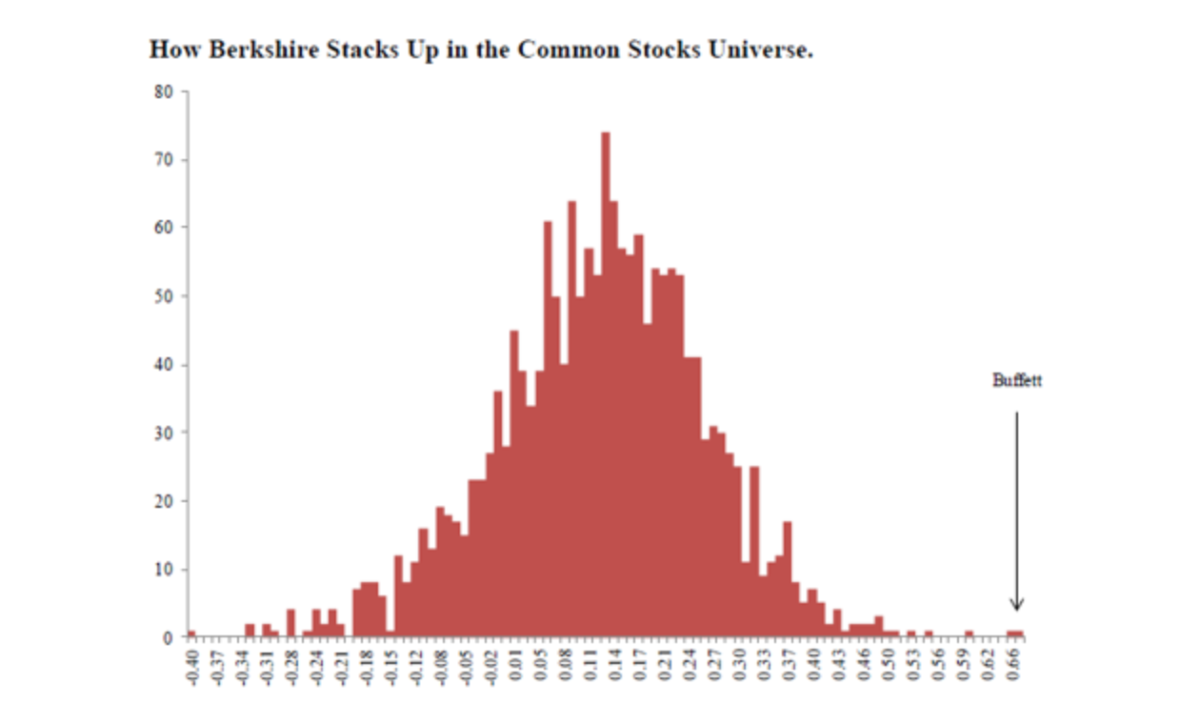
Do you mean to say that Mr. Buffett is into market timing?
-
The closest one can see from the outside that would look like that internal table is the following: which can be found in the "ESG" report, with the next actualized version including 2023 likely coming to their website sometimes this fall. Opinion: Catastrophe exposure is what it is but FFH has become less exposed to the risk/reward.
-
Rate the overall quality of the management team at Fairfax
Cigarbutt replied to Viking's topic in Fairfax Financial
-Where rates may be headed? -How to deal with them? -
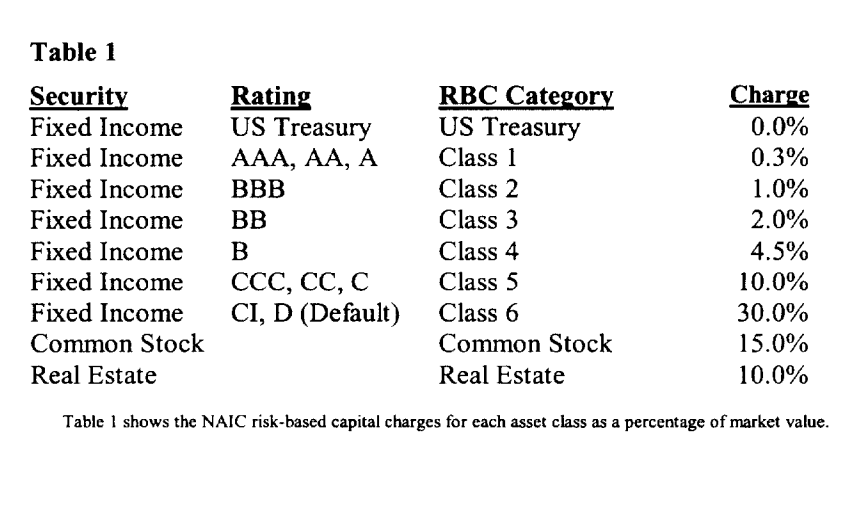
The rating agency is rather oblivious to the potential higher return of holding equity (tied to slow-growing retained earnings and the related % "coupon") but is concerned about the higher risk, with the concern resulting in a higher risk-based capital haircut (charge), equity versus investment-grade corporate bonds. At this point, FFH insurance subs are in an excess capital position and moving capital around and related investment decisions are part of the opportunistic capital allocation process. The following table will give you an idea of the potential charge although these tables are only a guide and an unusually large investment with 100% control may give rise to an additional "concentration" charge. i seem to remember a video where both Mr. Buffett and Mr. Munger voiced some kind of amusement when a rating agency alluded to the possibility of a 100% haircut on the BNSF investment (which used to be 100% held within NICO). ----- For the zzz investment, one has to understand the economics of the retail mattress industry or one has to outsource the analysis and the thinking to Hamblin-Watsa..
-
What is a Yen carry trade? Do you think Mr. Buffett is involved in a Yen carry trade?
-
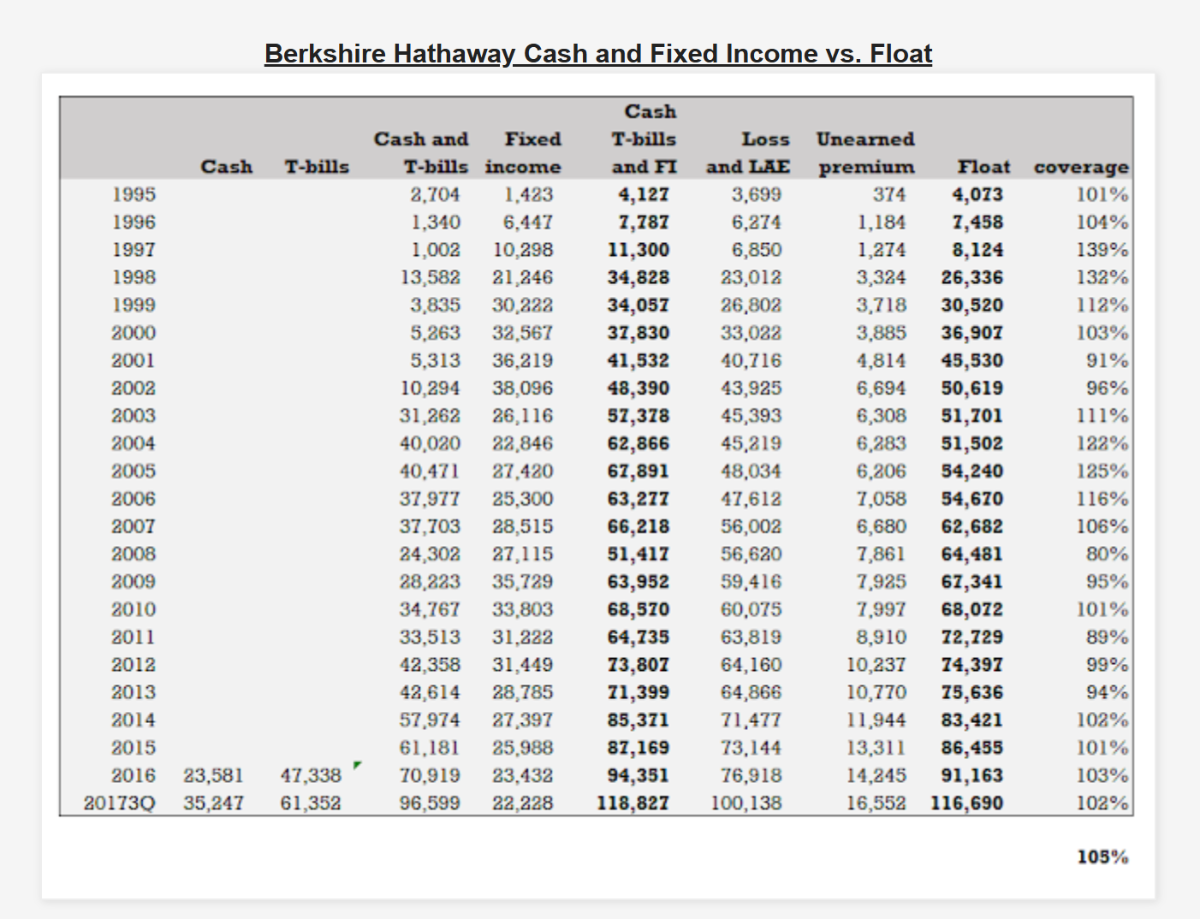
Limitations related to below: -What do i know? -Mr. Buffett's investing area of present interest is different from mine -There may be idiosyncratic reasons not visible now etc... -But Using a conceptual thinking frame suggested by Brooklyn Investor: 2017 105 2018 101 2019 106 2020 109 2021 108 2022 88 2023 106 The average (1995-2023) is still 105 and the standard deviation is 13 (12.6), so as of end of Q2 2024, the ratio (1.62) is about 4.5 x SD from mean. There are reasons for some variation and it's possibly only some kind of correlation and not a conscious effort to time markets but it's interesting nonetheless.. ----- Of course, i have no clue what's going on and can only admire breathtaking moves such as what is being accomplished now; it's a feeling similar to watching some of the Paris Olympics competitions, ie one can vaguely grasp the value of amazing performances without really understanding how this can be achieved. But history shows that luck is not the main factor.
-
You had to make it to page 60. This is also where you can 'see' the net cash movement from the FFH common share TRS.
-
What if -"everyone knows that capital light lite outperform" -"everyone" (the market) determines the multiple to pay for better things to come Then -Isn't this initially priced in by "everyone"?
-
This thread could be a really interesting topic to constructively (and objectively) discuss.
-
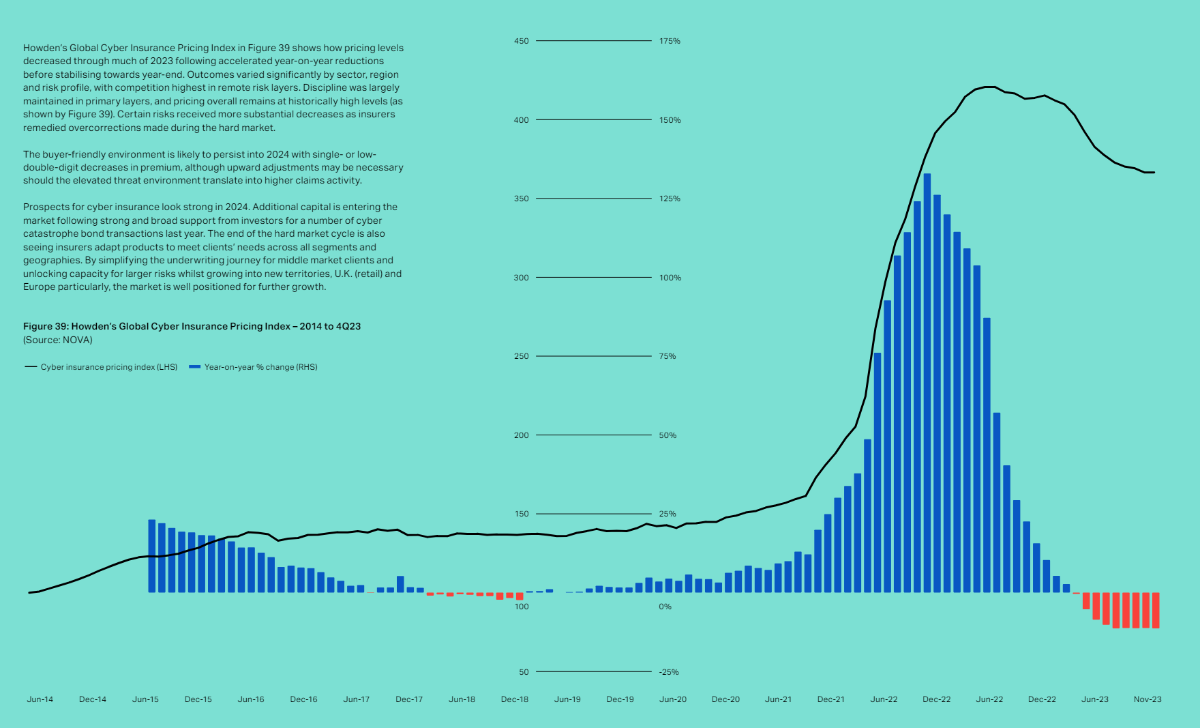
People who seem to follow the industry comment that, even if pricing has gone down slightly, contract and term conditions have remained tight, which is a subjective input that remains to be seen. Anyways, historical perspective may be helpful:
-
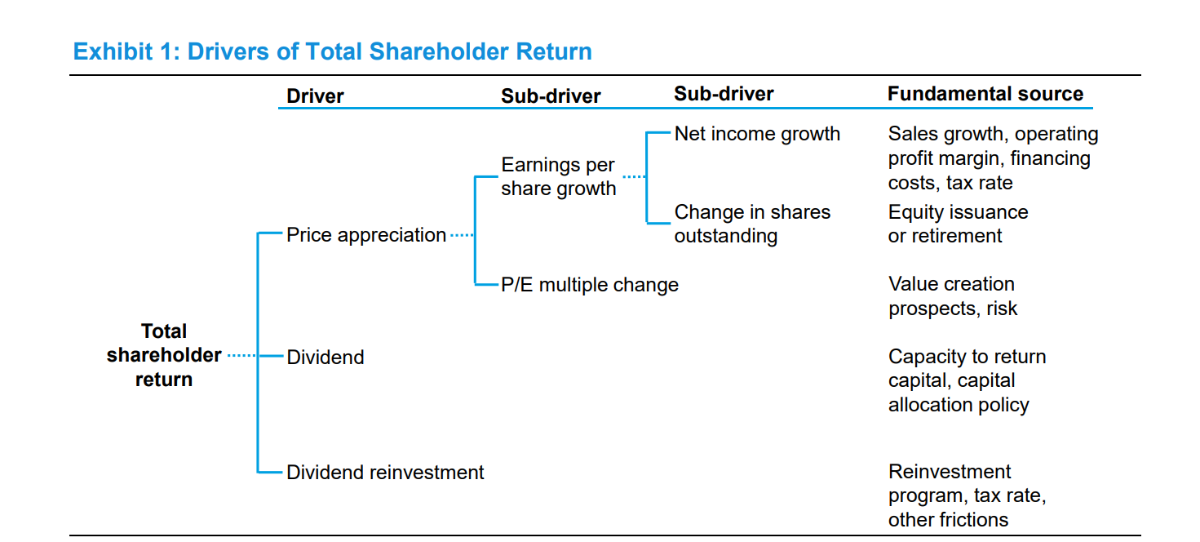
The initial thought behind this illustration came a long time ago and a good example (relevant example from a long long time ago for me) with a specific investment can be found in the following, pages 328-333. The View from Burgundy – A Quarter-century of Investing (Second Edition) (burgundyasset.com) The illustration can be found in (more theoretical and less practical but the underlying math is well explored): article_totalshareholderreturns.pdf (morganstanley.com)
-
Over time, for various holdings, especially when held over longer periods, as part of a retrospective learning experience, when holdings were sold, i have used a simple equation that separates the various components of the return. Reading your post, i'm puzzled by the basic math and wonder if i've been stupid all this time. Assumption presently held: The change in shares outstanding reflects the net effect of equity issuance and buybacks over the relevant period. Please help with the basic math (or with a more 'obvious' explanation).
-
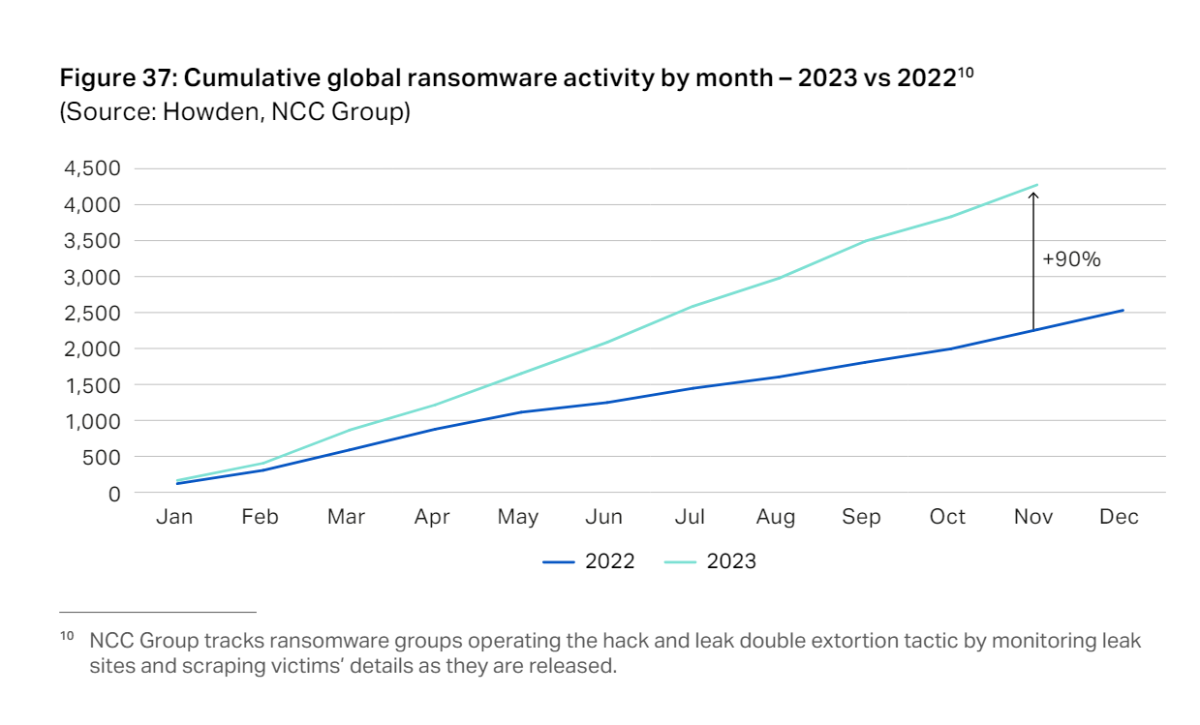
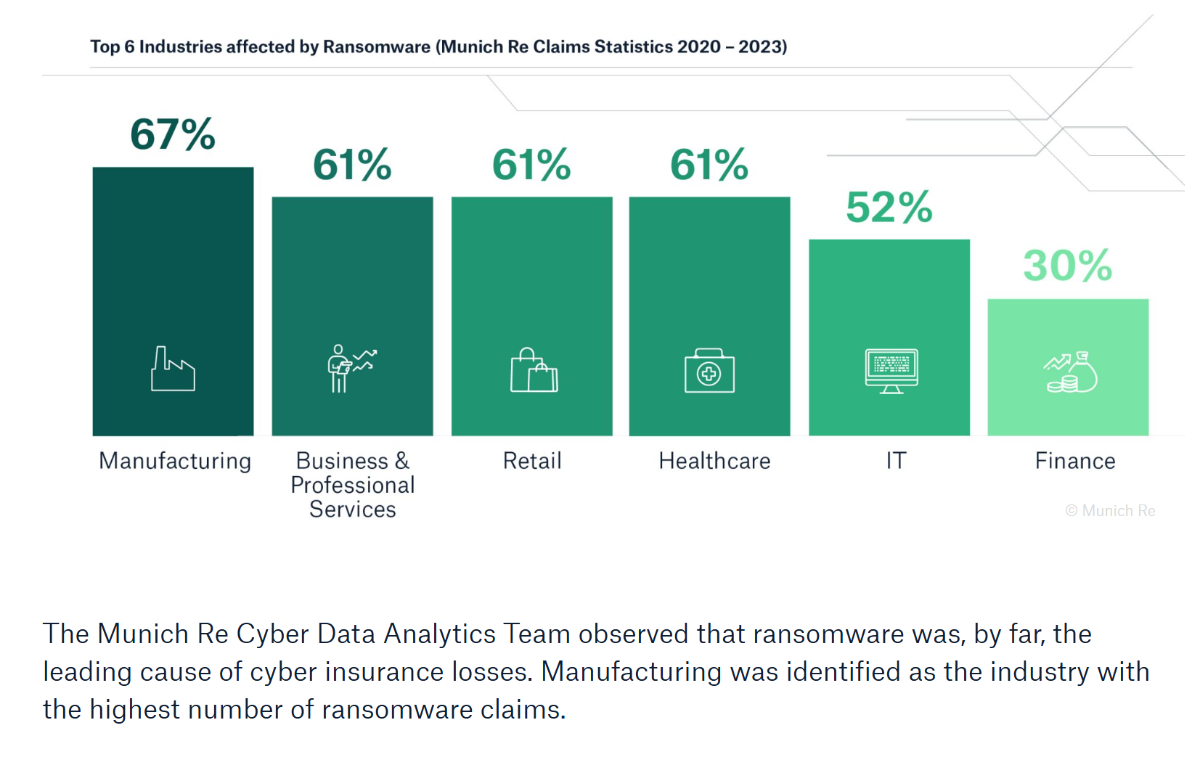
It's an interesting market but it's hard to put bounds (especially upper bounds, of the aggregating type) concerning future development. The market has hardened in a very unusual way, attracting a lot of capital but the market has softened ++ (price and contract terms) so who knows (with accuracy)? Early to tell and maybe not significant but (anecdotally) there have been people around me (personal and commercial) who had to deal with security breaches (privacy violations and ransomware) with varying levels of consequences and for those who follow these developments, some ransomware activity appears to be on the rise:
-
78% of Americans live paycheck to paycheck
Cigarbutt replied to Blake Hampton's topic in General Discussion
No, it doesn't appear that population growth in my city played a material part in the relative price increase vs median incomes. Interesting you mention a bricklayer. One of my nephews (to whom i'm relatively close) is a bricklayer and is not doing too badly i guess but he does strongly feel that "the system is rigged" (his words not mine)..