Cigarbutt
-
Posts
3,371 -
Joined
-
Last visited
Content Type
Profiles
Forums
Events
Everything posted by Cigarbutt
-
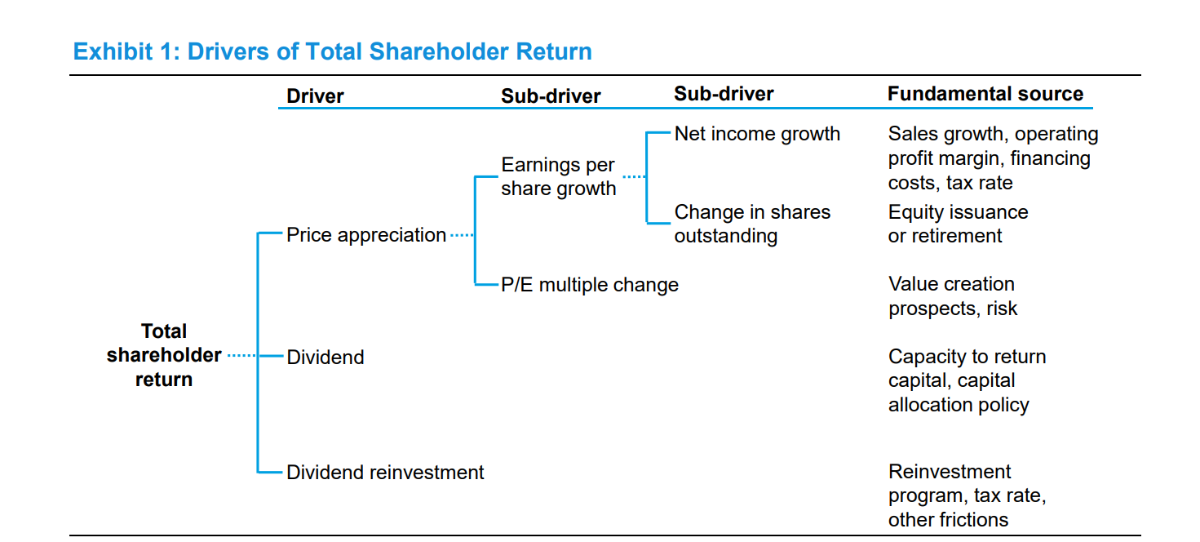
Over time, for various holdings, especially when held over longer periods, as part of a retrospective learning experience, when holdings were sold, i have used a simple equation that separates the various components of the return. Reading your post, i'm puzzled by the basic math and wonder if i've been stupid all this time. Assumption presently held: The change in shares outstanding reflects the net effect of equity issuance and buybacks over the relevant period. Please help with the basic math (or with a more 'obvious' explanation).

-
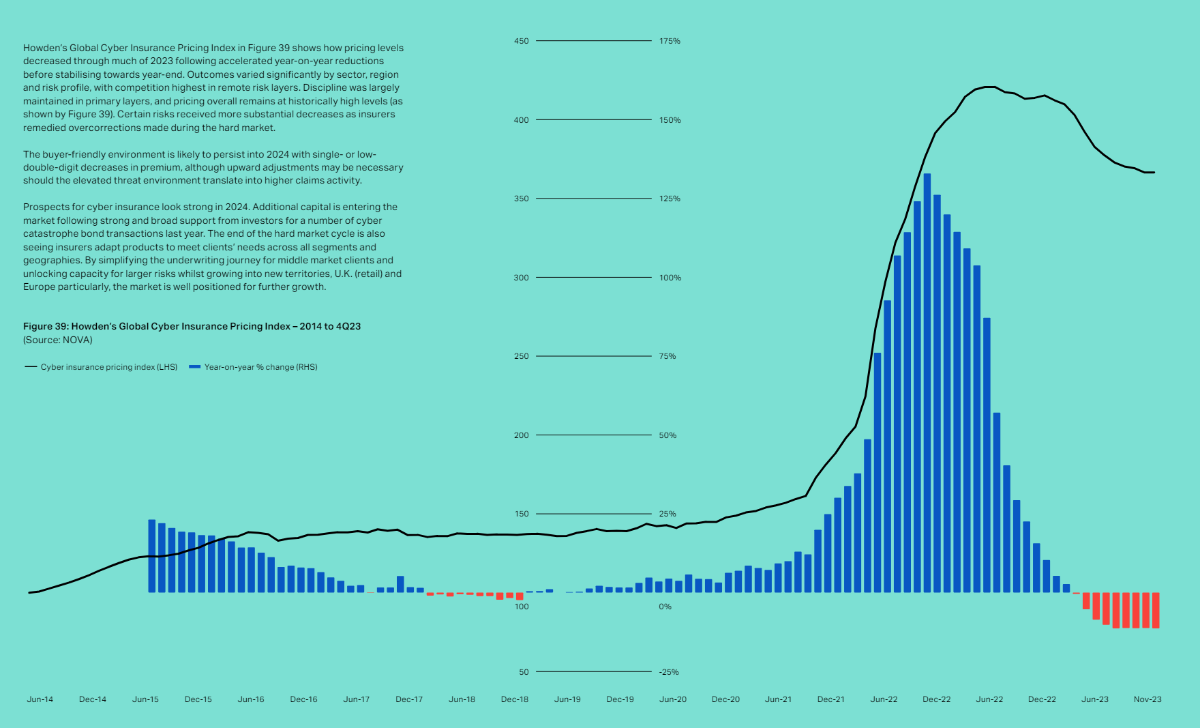
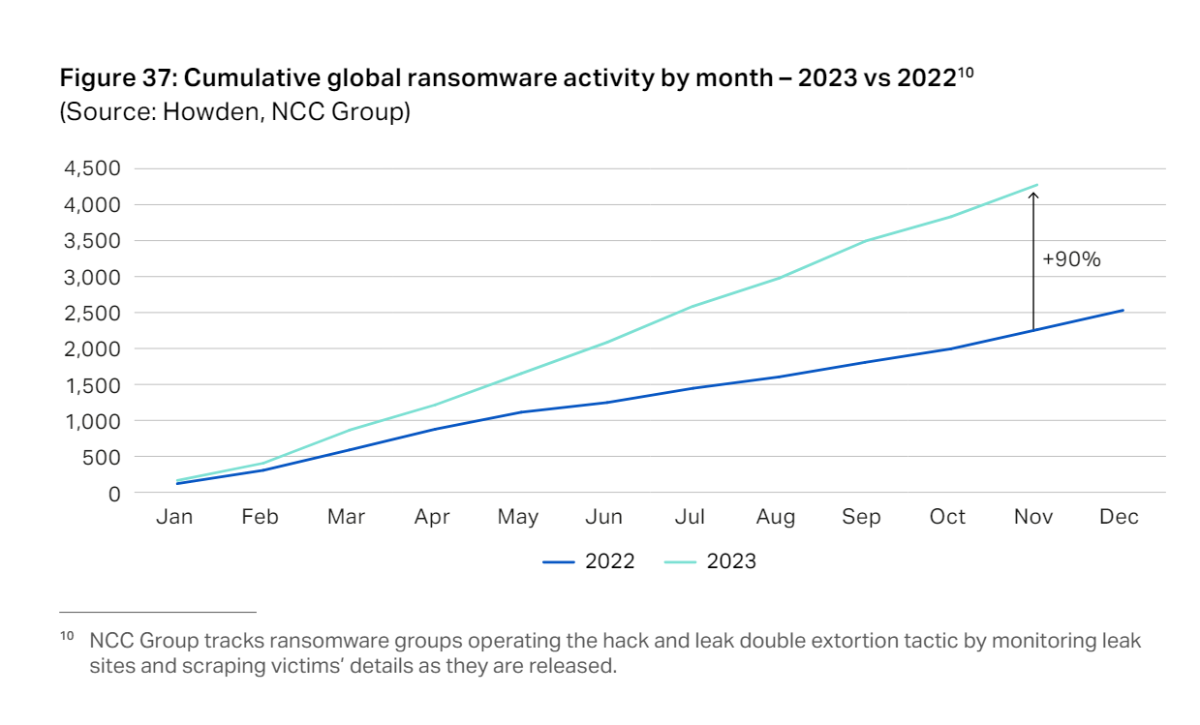
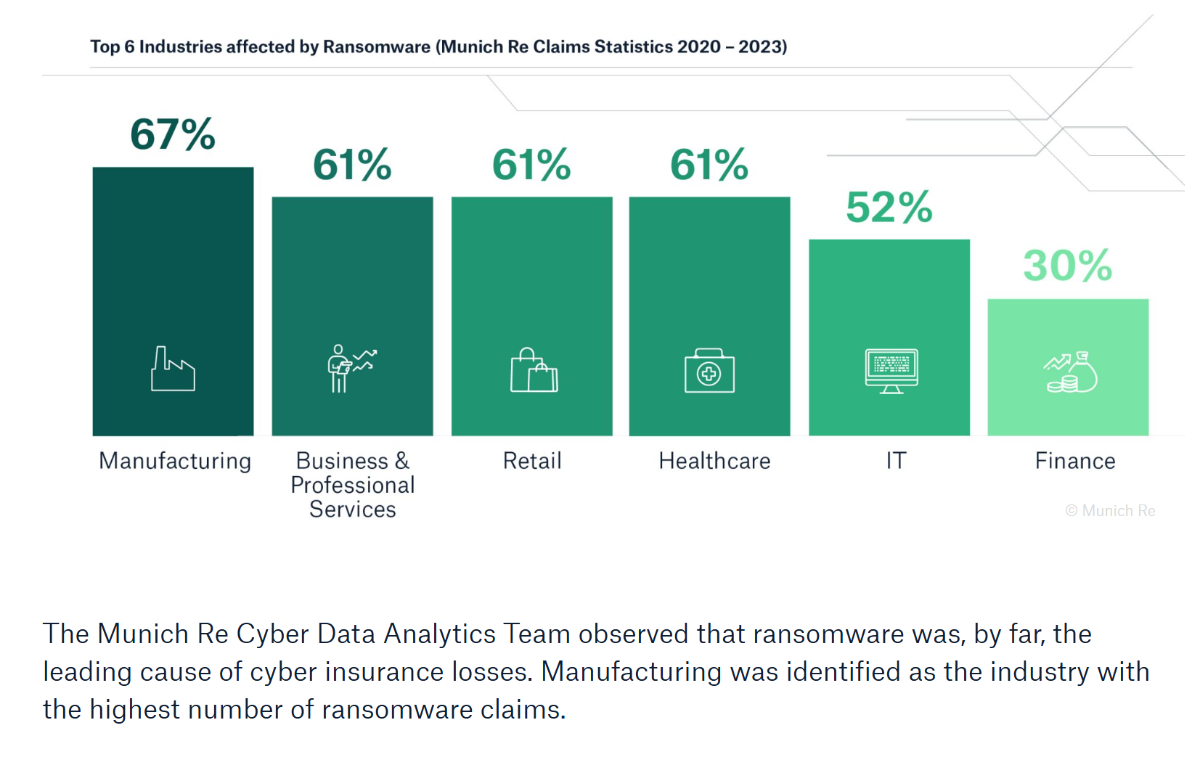
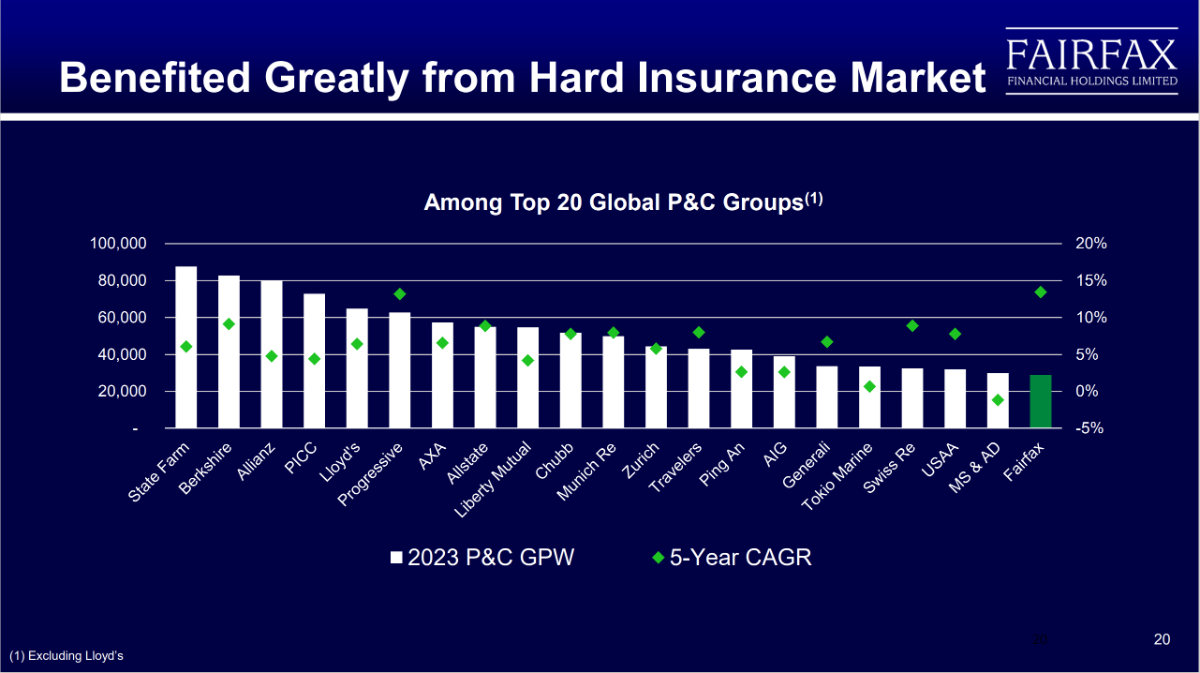
It's an interesting market but it's hard to put bounds (especially upper bounds, of the aggregating type) concerning future development. The market has hardened in a very unusual way, attracting a lot of capital but the market has softened ++ (price and contract terms) so who knows (with accuracy)? Early to tell and maybe not significant but (anecdotally) there have been people around me (personal and commercial) who had to deal with security breaches (privacy violations and ransomware) with varying levels of consequences and for those who follow these developments, some ransomware activity appears to be on the rise:
-
78% of Americans live paycheck to paycheck
Cigarbutt replied to Blake Hampton's topic in General Discussion
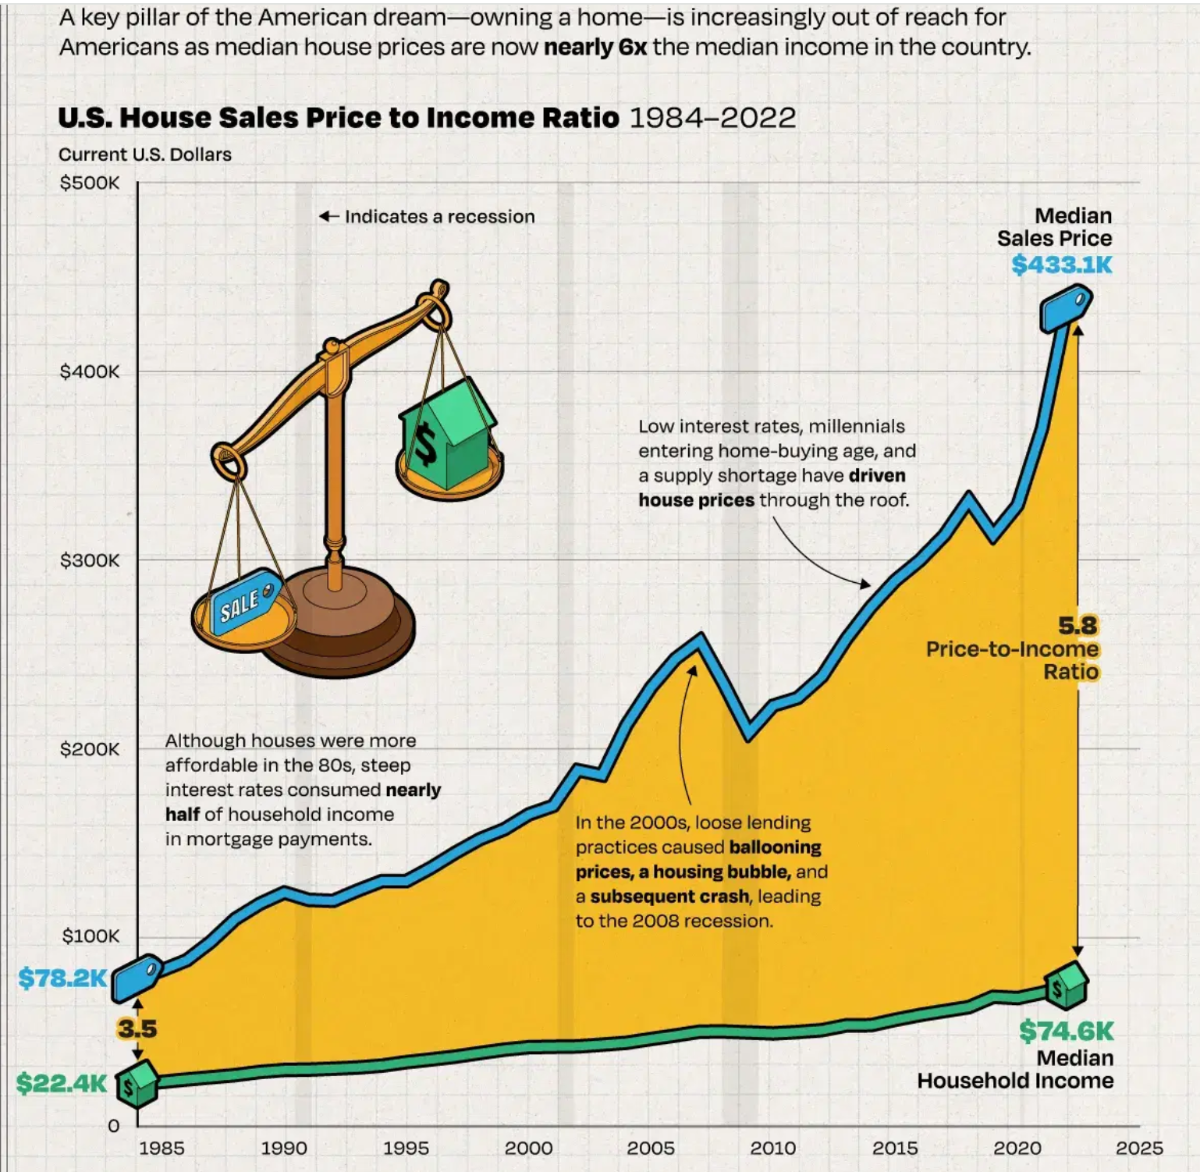
No, it doesn't appear that population growth in my city played a material part in the relative price increase vs median incomes. Interesting you mention a bricklayer. One of my nephews (to whom i'm relatively close) is a bricklayer and is not doing too badly i guess but he does strongly feel that "the system is rigged" (his words not mine).. -
78% of Americans live paycheck to paycheck
Cigarbutt replied to Blake Hampton's topic in General Discussion
Yes and yes. For fun, i just spent 45 seconds for an anecdotal perspective. We bought our house (typical suburb in North America) in 1996 in a 4.5 price to median income ratio environment. Today, for an almost 100% quality and size compared new home, my kids face a 7 price to median income ratio environment. When discussed, some suggest then to save more and some to save less. i guess it depends how optimistic you are about future prospects. And yes we do live in an environment of government debt to GDP at typical levels seen during major world wars. -
78% of Americans live paycheck to paycheck
Cigarbutt replied to Blake Hampton's topic in General Discussion
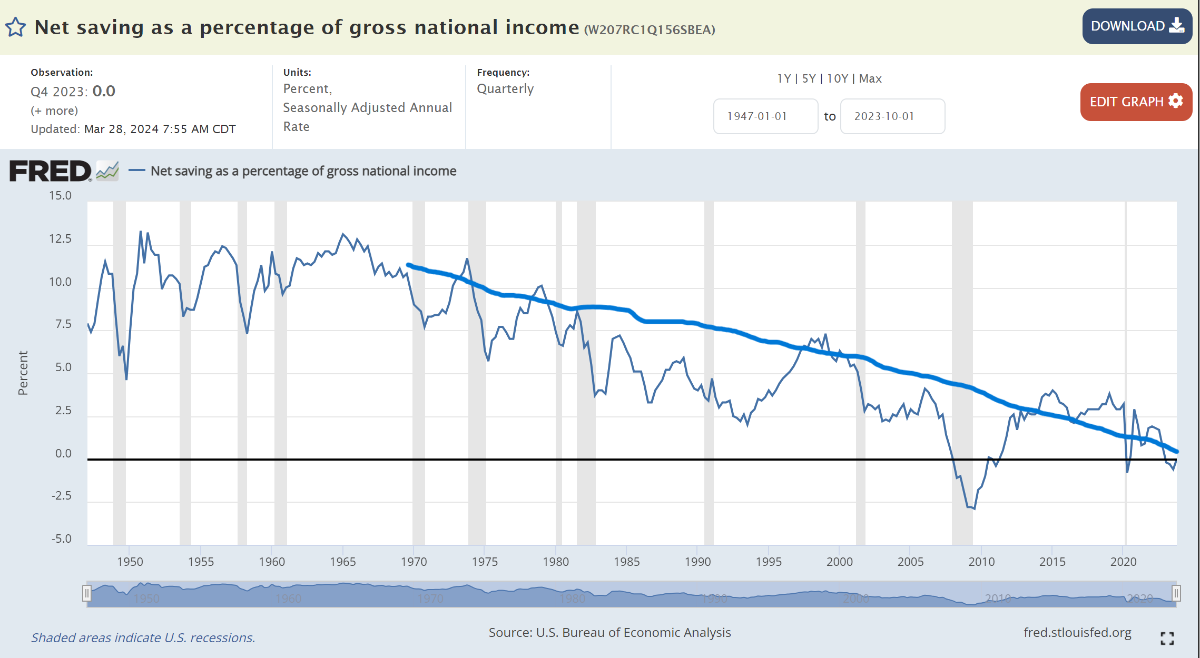
A factual aspect of the thread is the decreasing rate of savings (private and now also public) and the potential implication related to the continued relative downtrend in median wage growth (lower investments, lower productivity etc). In 1999, this had been noticed and it was suggested that it was ok. It's been ok and there has been continued growth in goods productivity although service productivity remains a significant question mark. Debt productivity (linked to decreased savings) has certainly gone down (mathematical fact). Americans Are Not Saving: Should We Worry? - Federal Reserve Bank of Chicago (chicagofed.org) ----- 1-Optimism is intuitively linked to resilience. 2-Resilience is intuitively linked to optimism. Cause and effect can go both ways (opinion). An example of 1- Boston telecom billionaire Robert Hale, who started his business by taking a loan from his parents, left 1,000 graduating students at Umass Dartmouth in complete awe by gifting them $1,000 each. - Luxurylaunches Mr. Hale, in the years that followed 1999, was resilient because he was optimistic. Impressive. On a personal level, i identify more with 2-. This has implications for personal reflections about what 'we' should do as a tribe/community/nation or whatever. -
78% of Americans live paycheck to paycheck
Cigarbutt replied to Blake Hampton's topic in General Discussion
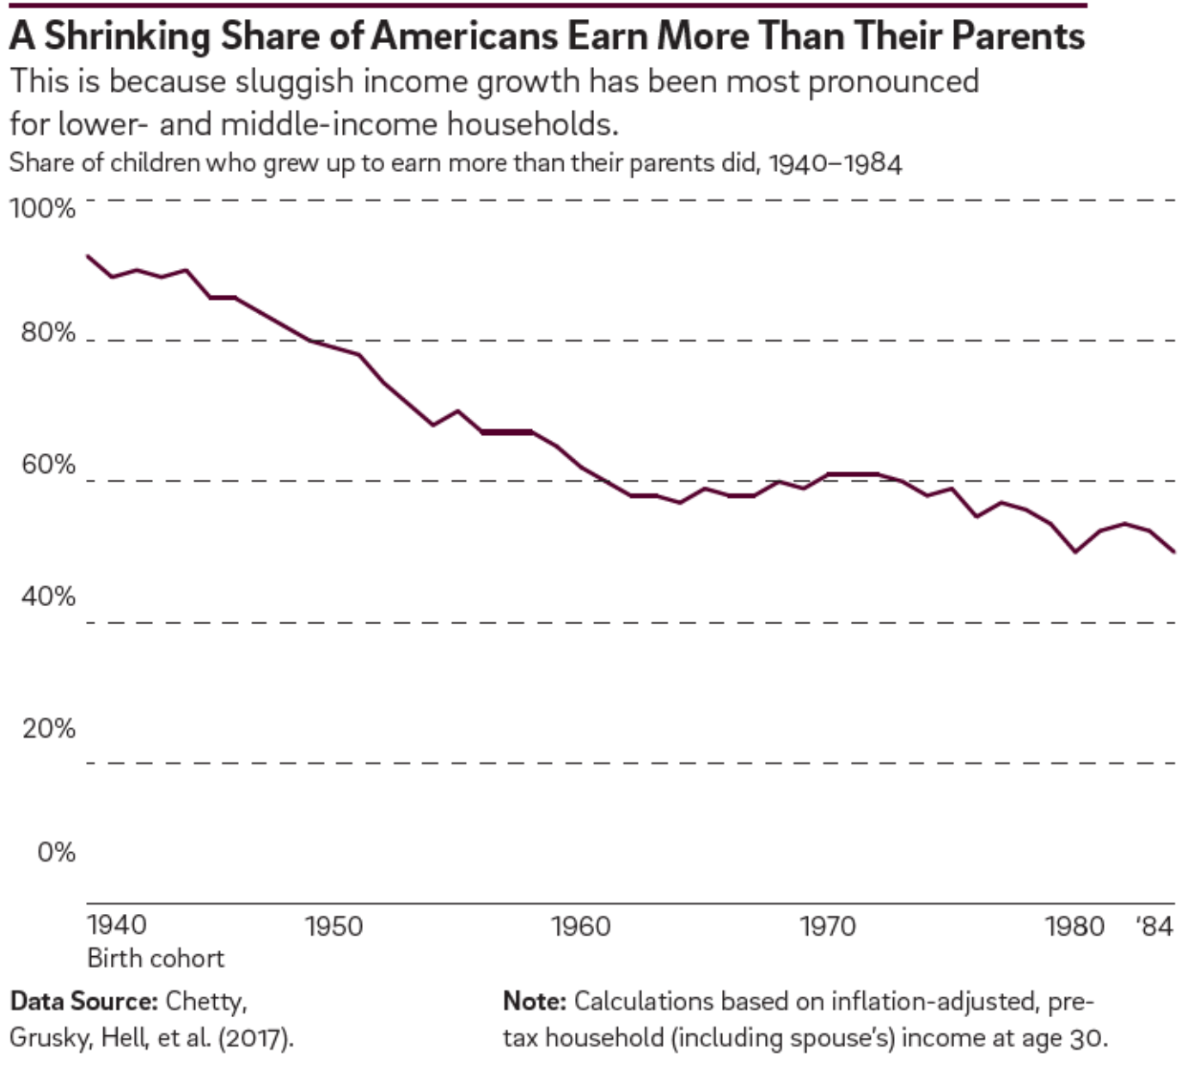
When does optimism become blind optimism? And why such low consumer 'confidence' numbers when the masses are questioned these days? The American Dream is still possible, it's just becoming costlier: Correction/update for 2024: not 126, more like 148. ----- If the argument becomes that it's still possible for 1% of the population to make more than their parents, when does it become inappropriate to suggest that it is better late than never? Index of social or inter-generational mobility:
-
78% of Americans live paycheck to paycheck
Cigarbutt replied to Blake Hampton's topic in General Discussion
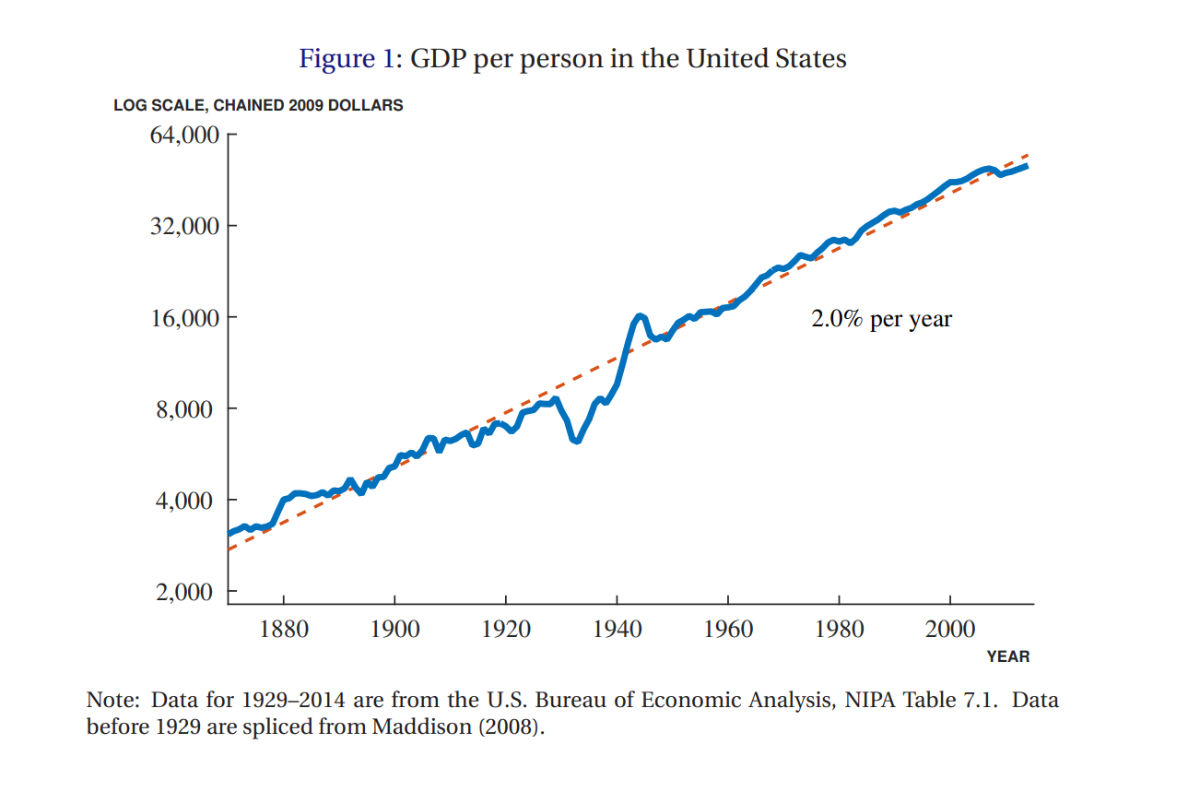
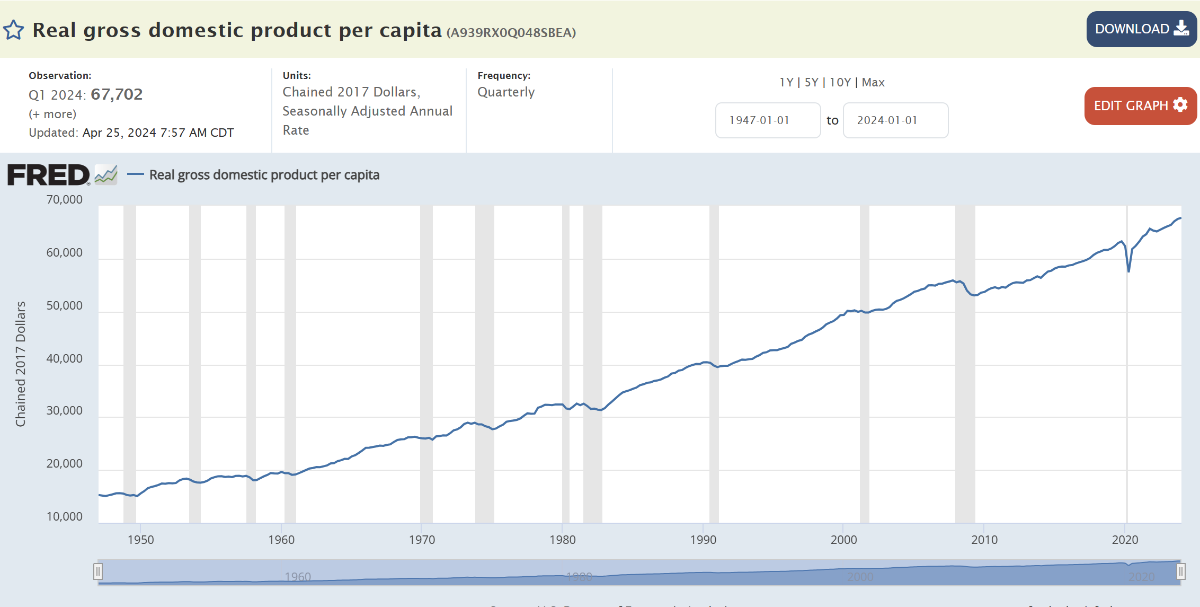
Interesting. Going back to one aspect of the thread, why 78% are not saving... The lack of saving for the bottom 90% is a fact and this trend has been worsening. Apart from evolutionary, individual weakness, gender issues, social media etc, any other explanation? -----) The atypical animal spirit of the typical American consumer? Purchasing power has been increasing but there has been a significant slowdown in disposable income growth. Present consumption has been maintained by lower saving at the individual level (bottom 90%) and by higher government debt. Going through the pandemic, the US has been a relative outlier with an extraordinary debt-financed stimulus (including printed money) and with the consumer spending that excess money and lowering savings rate (driving the consumer economy higher, domestic and international). One has to wonder if this lower income growth is not behind the unusual resentment and anger displayed by the bottom 90%. People ('We') are getting ahead but not as much as before and not as much relatively. A potential side effect is that real GDP growth used to require a log adjustment on the Y-axis in order to transform the exponential curve into a linear one: Not any more. Note: a linear curve here means decreasing rates of growth: Why? Potential unknown unknow but one has to wonder about the crowding out effect (controversial topic , i know). Lower national savings, even if slightly mitigated by foreign savings, means, by definition, lower investments and, absent a productivity miracle, means lower growth going forward. Of course that doesn't mean stocks won't do well but perhaps something to take stock: For the bottom 90%, some commentators have suggested that there may be a reconciliation to be made between expectations and reality.
-
78% of Americans live paycheck to paycheck
Cigarbutt replied to Blake Hampton's topic in General Discussion
Many interesting comments here but isn't there another perspective to take also? Why is net private/public saving going down? Using various definition endpoints, why are there between 40-80% of Americans with no intrinsic margin of safety? Because of extrinsic safety nets? Some kind of population life-time pattern (population getting older)? What about the data that shows that the net savings of the top 1% (absolute and relative) has been increasing in the last decades, the net savings of the next 9% has remained stable and the net savings of the bottom 90% has been decreasing? There may be more to it than evolution allegories or moral undertones?
-
78% of Americans live paycheck to paycheck
Cigarbutt replied to Blake Hampton's topic in General Discussion
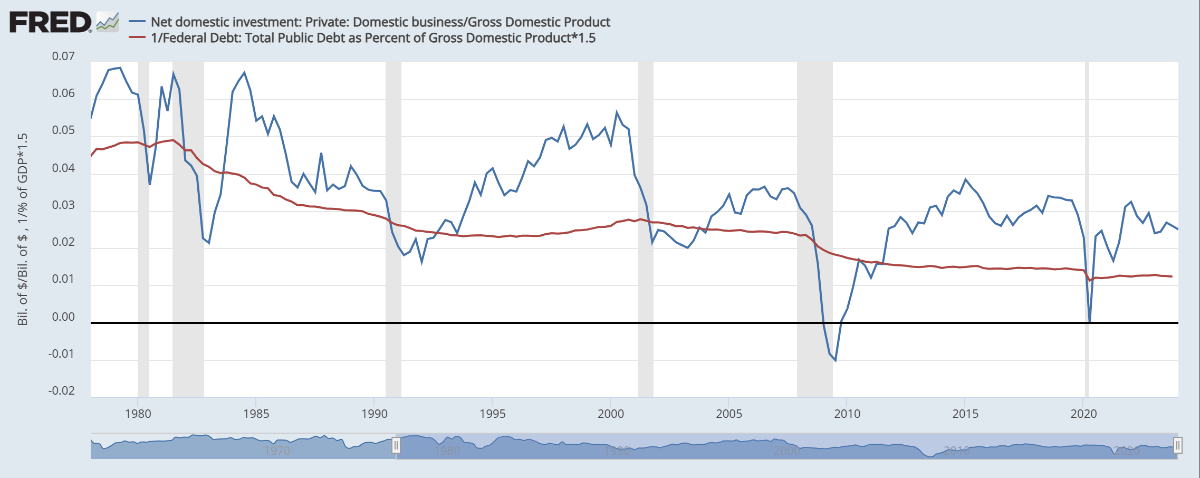
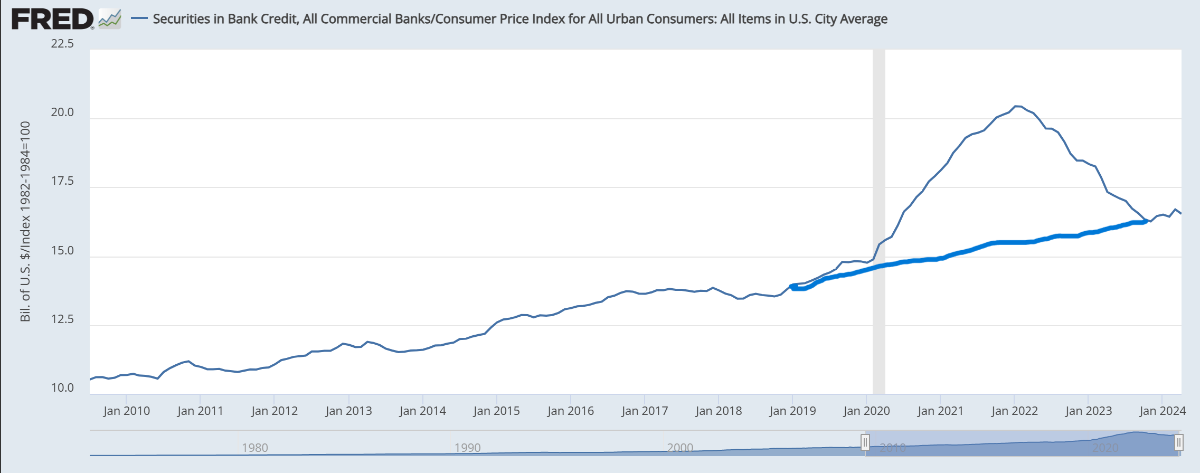
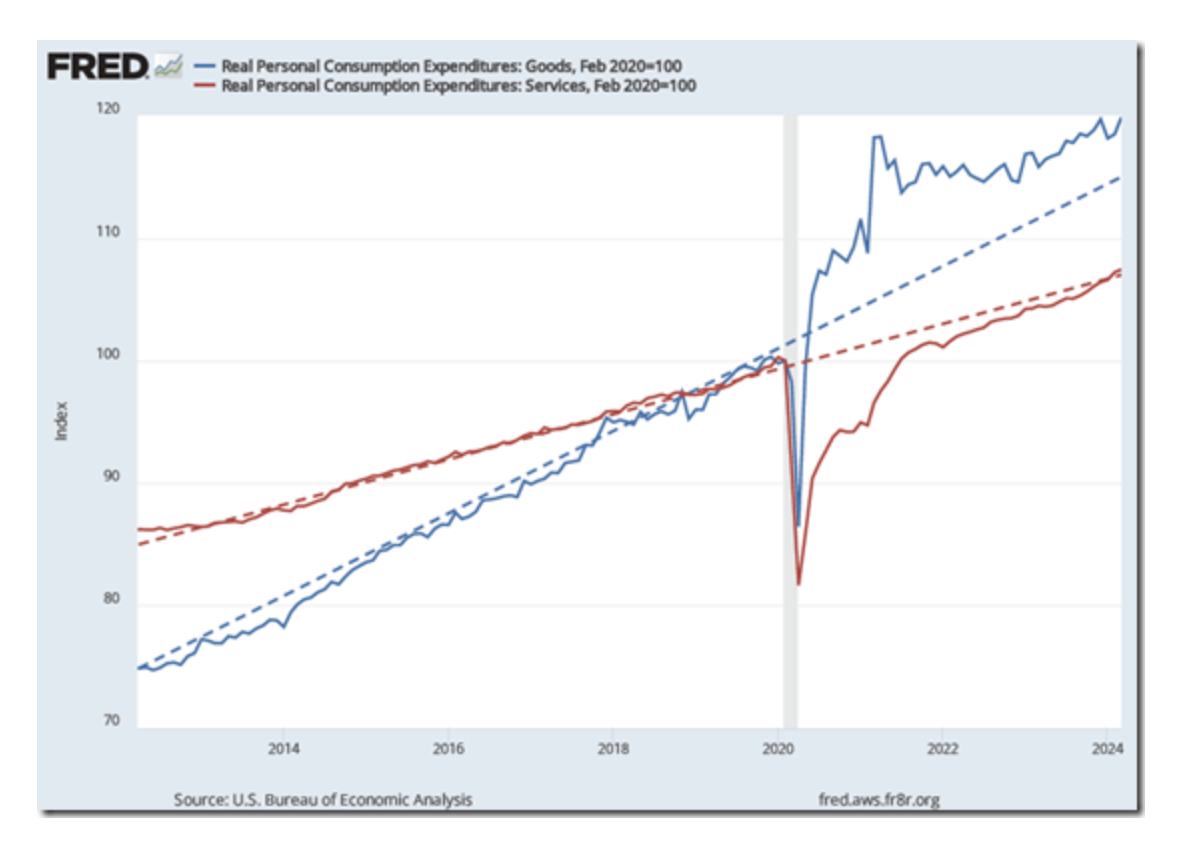
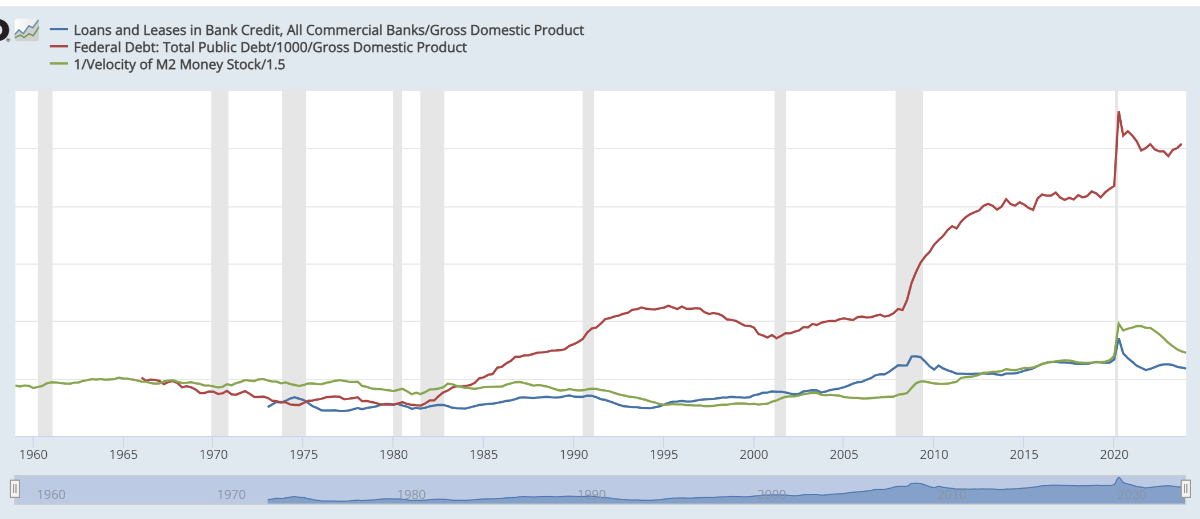
This macro stuff may be a waste of time but it's interesting and who knows, it may mean something one day? i disagree on much of the above. ----- There seems to be some kind of misunderstanding coming from many sources (locker rooms to ivory towers). Individual savings rate does not affect aggregate savings. Individual savings mean disposable income minus consumption. If one changes behavior and increases spending (or investing), the individual savings rate of that person will decrease but the money spent (or invested) will increase another person's saving. Aggregate private savings has historically resulted from money printing which used to be tied to the general growth of the economy and the correlated growth in private loan activity at commercial banks, not anymore though. Yes, starting in 2020, excess savings were built up, but not as an aggregate effect of net worth growth or (only) stimmy checks. The excess savings were built up from (slight simplification here, but in essence) commercial banks (effectively, on a net basis) buying securities (mostly government debt). Let's say mattee2264 buys a US Treasury and Uncle Sam sends the harvested funds to Cigarbutt, no additional aggregate net private savings is created. However, if the Bank of America (NYSE:BAC) buys the Treasury from mattee2264, to match the new asset held, it credits a deposit for mattee2264 and (magic of money printing) the aggregate net savings (private) increases to the extent of the increase in public debt. Look at the following for a graphic representation: An interesting conclusion is that the US effectively applied an MMT-like Friedman's helicopter money experiment and it looks like the net result is what the great thinker predicted. After a while and some lag, the only thing which changed is the general price level, not the underlying real aggregate net savings, with long-defunct thinkers suggesting that the outcome of such debt experiment would be closely tied to the productivity of the funds obtained from debt (there is a developing story here..) Like many suggest, in real terms, for deposits or excess savings etc, 'we' (we, also meaning the typical paycheck-to-transfer-to-paycheck American, 78% or whatever) are back to where 'we' were before the experiment started. What happens next is where the money is but non-linear changes have to be considered? Concerning what choices people had when services were curtailed, one may look at the following consumption picture and consider the possibility that the government borrowed in order to allow folks to buy excess goods (instead of later?).
-
^Yes the dividend capacity is a good starting point and it looks like FFH has already started to use this capacity in Q1 to buy back FFH shares. Opinion: it's a good starting point but, under present conditions, the capacity to switch the asset allocation (bonds to equities) may be less than 3.0B because the Northbridge capacity is contingent upon regulatory approval and dividend capacity as reported above includes the 'dividends' (fixed by contract, at 9-10% of funding) to Allied, Brit and Odyssey minority 'co-investors' (carrying value at around 2,5B).
-
^i would simply add the following: From the FT article: "What if I told you there could be an unprecedented stimulus injection into the US economy that will cost the government nothing and add not $1 to the national deficit? As early as this summer, a proposed move could begin to unleash almost $1tn into consumers’ wallets. By the autumn, it could be on its way to $2tn." In fact, one could carry this free lunch idea even further with a potential of $11tn of "tappable" equity: Homeowners are getting rich while renters get left behind (axios.com) It's hard to figure out what is going on in Mr. Druckenmiller's mind but it may have something to do with the wealth effect on consumption and with future consumption pulled today but who knows? A very interesting aspect of all this is that the author of the FT piece (The Oracle of Wall Street) recently suggested that home prices would soon enter a long period of decline (20 to 30% or more).
-
Interesting. FFH, when compared to peers, for float investments, is more of a return (risk) seeker. Rating agencies would probably be more flexible these days because of more recent positive and consistent underwriting performance but i wonder if the high level of financial flexibility that you suggest is there (assuming FFH would want now to switch funds from bonds to a compelling equity or equity-like opportunity). i remember the days when Northbridge and OdysseyRe were minority privatized in order to get some flexibility and can't help notice that several subs are still characterized by non-controlling interest sold to "financing" partners. Why would this be the case now if there was such excess capital available? In the 2023 AR, they mention that Northbridge has an MCT of 255% and most other subs (apart from TIG and run-off) have a 320% RBC. These numbers don't include the dividends sent to parent in Q1 2024. Anyways, if interested, there's this note from CIBC which contains some relevant material for this discussion, including a case study describing the cost to MCT when switching funds from low return (low risk) securities to higher (expected) return (higher risk) securities: Capital-efficient investing for property & casualty insurers (cibc.com)
-
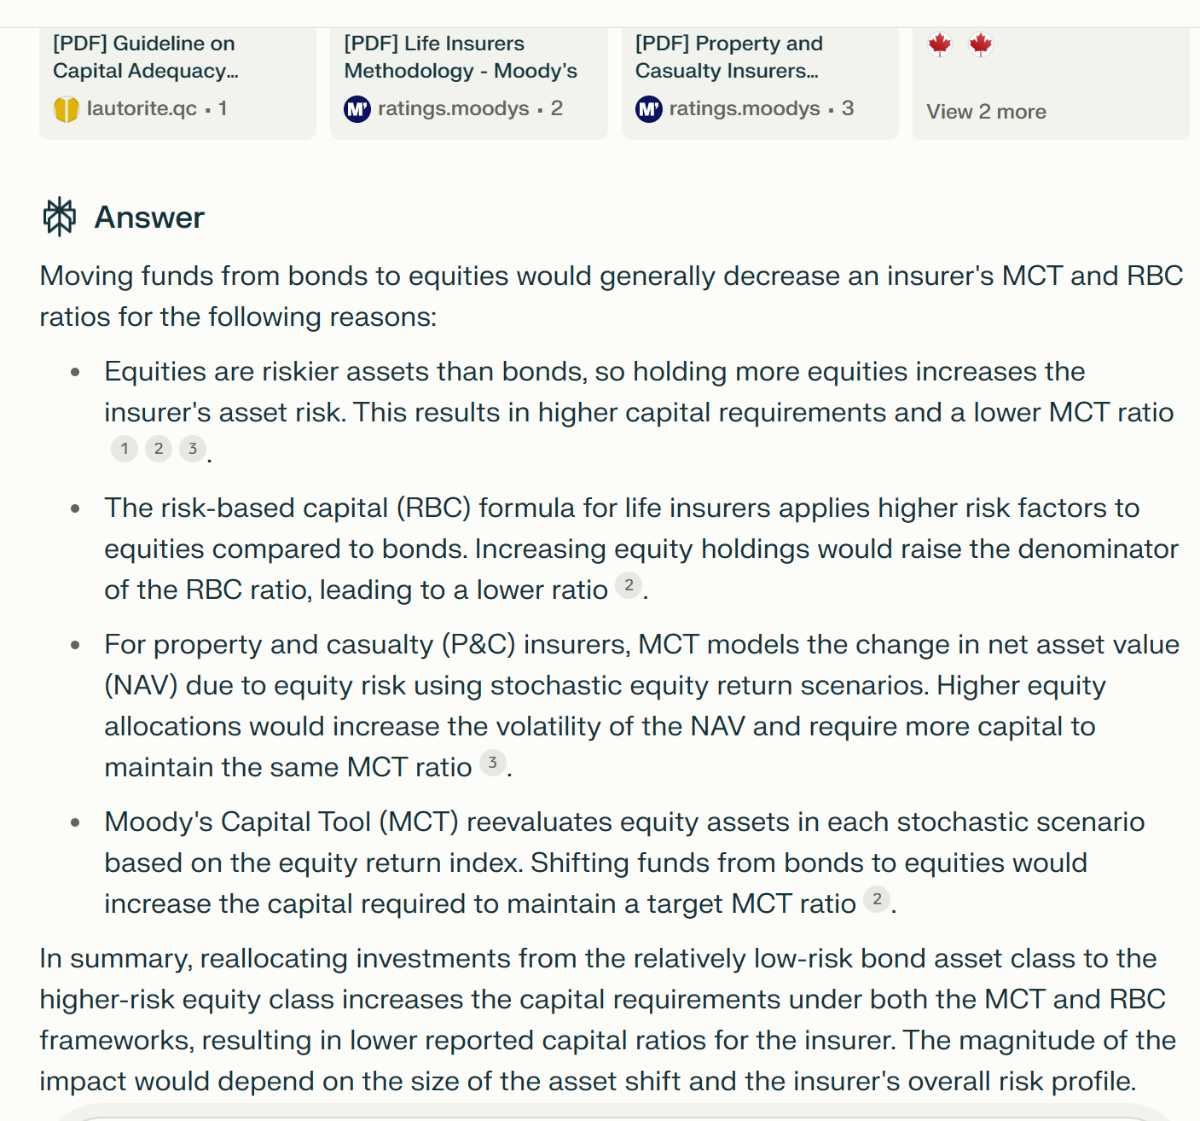
Unusually busy day for me today so i didn't spend the time your post deserved but i'm wondering if there is a problem with the effect of funds reallocation on regulatory capital. Since you refer to GPT, here's a screenshot from Perplexity with info to ponder on, us (still) humans:
-
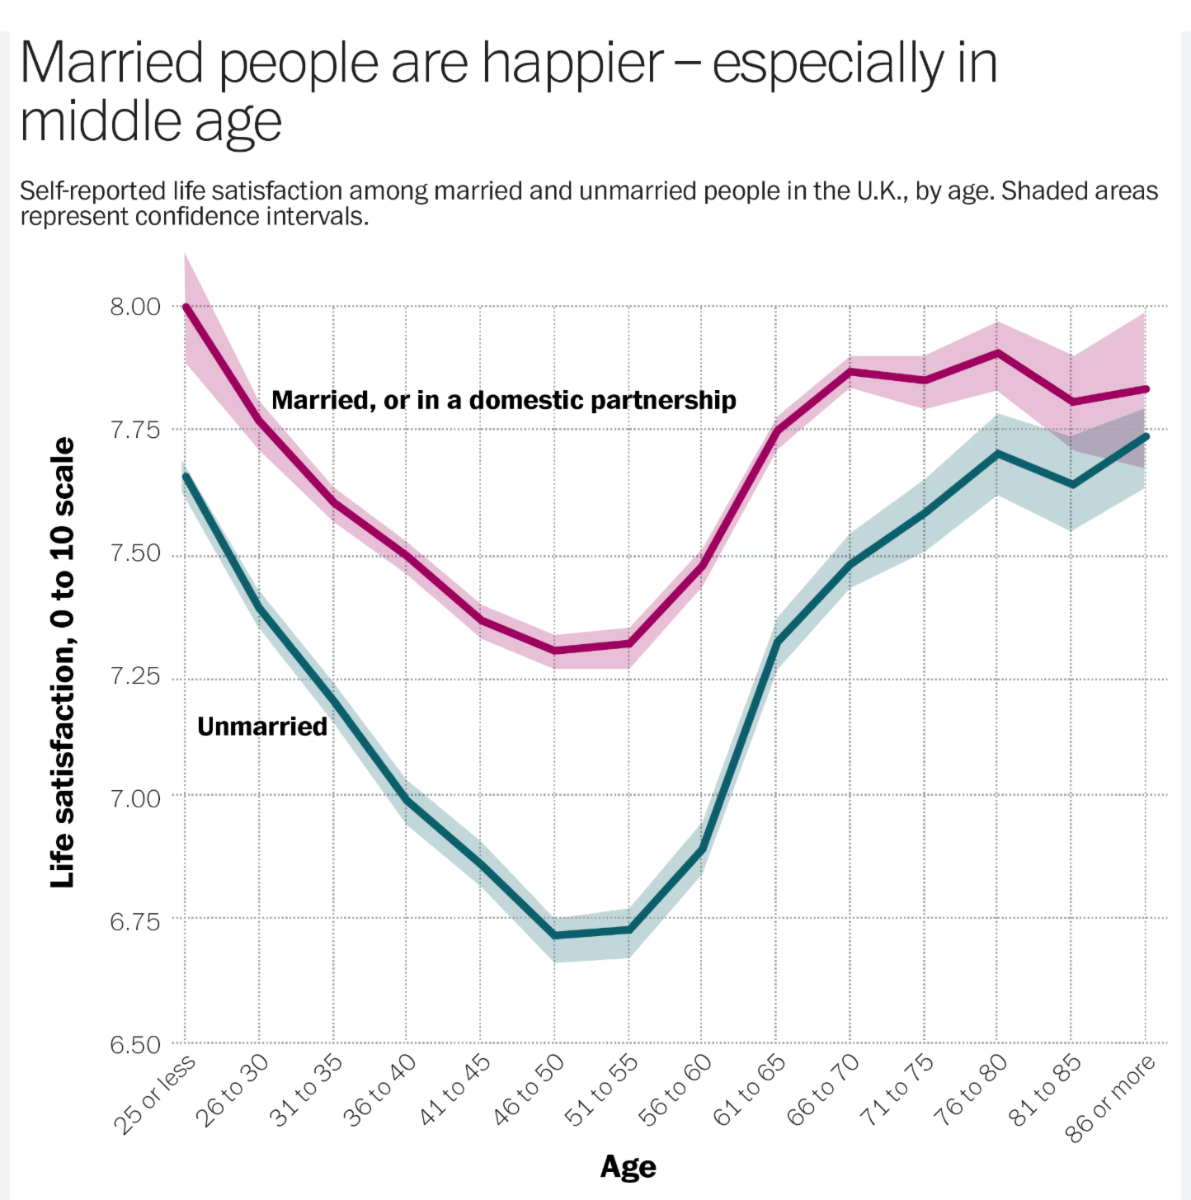
The contrarian in me says to look for mitigating factors. The following is from the UK but is representative of what's going on in the US, Belgium and other 'developed' nations: i will leave you with the following questions though (chicken/egg type of dilemma): -Are married/partnership people more likely to be happy? -Are happier people more likely to be married/partners?
-
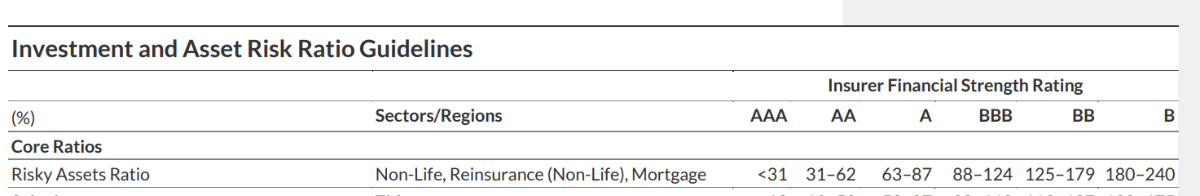
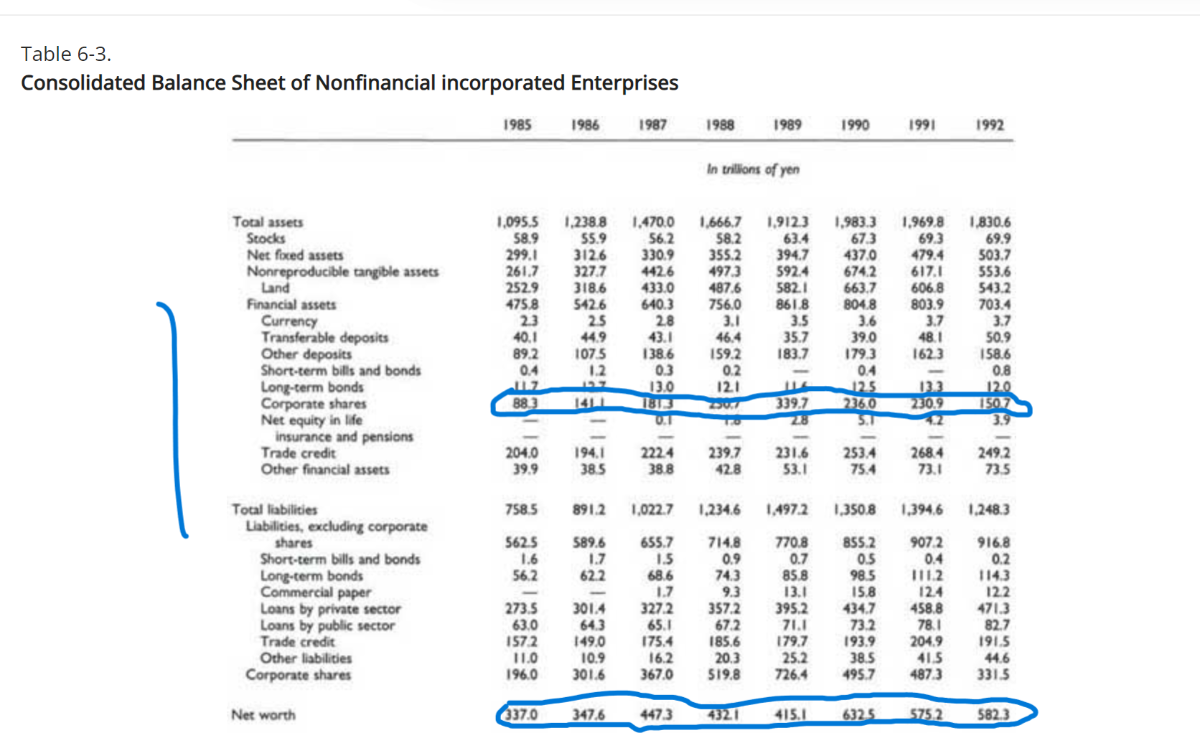
-The 2.7B may be the right number and looking at this from several perspectives does help. -If interested look at FFH's 1990, 1991 and 1992 (much smaller insurance operation then) and see their equity exposure relative to capital... -The reference to BRK and the "ratio" is because it's a simple measure and easy to compute. At BRK, there is probably an embedded margin of safety which may be an adequate reference given FFH's past history during some transitions (many episodes requiring selling stock below intrinsic value, reaching for a line of credit etc). -The numbers about float need to take into account the definition of float as mentioned in FFH's annual reports: "Float is essentially the sum of insurance contract liabilities and insurance contract payables, less reinsurance contract assets held and insurance contract receivables, on an undiscounted basis excluding risk adjustment." So you need to subtract reinsurance contract assets (among other less important adjustments) to calculate float. -Questions and comments -i guess the idea is to (sell high and buy low) switch funds when equities become available at lower prices. If this idea applies, then the value of those regulatory measures become relevant ie they require a margin of safety. But then, you need a dynamic picture as bonds assets (including mortgage loans) can get downgraded or even default and other equity instruments (including the very significant total return swap on its own stock) can lose value. These changes impact regulatory capital to a very significant degree. -As a concept, moving funds from bonds (lower risk-weight) to equities (higher risk-weight) should impact negatively the MCT ratio. Why not in your example? You are right, this was not well phrased. The risky assets ratio is an indicator of potential future capital impairment. In a downturn, the risky asset ratio may go up if for example many bonds held get downgraded (have a higher risk weighting) or if unimpaired equities become impaired but the ratio may go down as a result of what you describe or if the company sells risk assets and fly to safety. However, when starting with a high risky assets ratio, the risk of capital impairment (including regulatory capital impairment) is higher, which is why FFH is close to the BBB category, a riskier posture for an insurer.
-
How is the Fed going to cut rates with inflation over 3%?
Cigarbutt replied to ratiman's topic in General Discussion
There was this person in the 50s (trying to understand WW2 money supply dynamics and the relative absence of runaway inflation that was felt to be secondary to price controls and others) who compared the combination of monetary and fiscal policy to the handling of a kite (with demand being the wind). There was this assumption that stabilizers (automatic and to be created) could always and effectively maintain some kind of wind, Interesting, indeed (opinion).
-
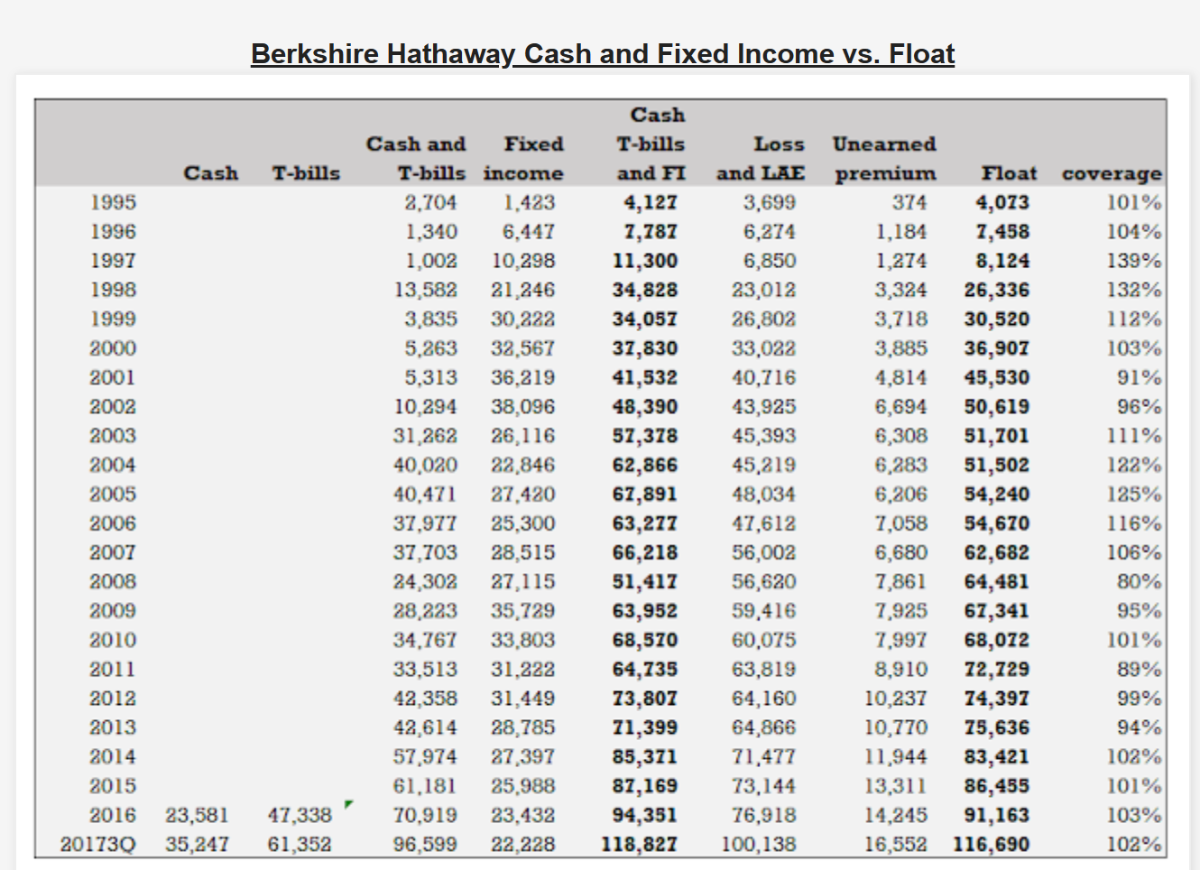
There are many ways to guess and each market transition comes with its own flavor. Using some kind of float coverage ratio concept, one could come up with a theoretical "number". Using cash and fixed income float portfolio over insurances float reserves, for example, for BRK, the ratio was 106% at end of 2023 and 112% at end of Q1 2024. During various opportunistic times in the past, this coverage ratio for BRK went slightly below 100%, even close to 90% for relatively short periods. For FFH, this ratio (slightly apples to oranges comparison with the mentioned ratio in this post, slightly overestimating the FFH coverage) was 131% at end of 2021, 127% at end 2022 and 130% at end 2023. In theory, FFH could sell about 25% of its bond portfolio in order to buy any assets (including equities). ----- Yogi Berra said (apparently) that, in theory, there is no difference between theory and practice but, in practice, there is. Mike Tyson also had a similar theory related to what could be done when punched in the face. ----- So, in practice, the limiting factors would be coming from regulators and from rating agencies. In a downturn, many present equity and equity-like holdings held by FFH would go down also and regulators would apply a risk-based capital haircut to risky assets (held and to be acquired). For the rating agency, using Fitch as an example who recently released an update, at end of 2023, the risky assets ratio is already at 85%. In a downturn, even absent any "tactical" asset allocation move by FFH, this ratio would tend to go up...towards BBB which makes it uncomfortable to write new insurance business.. Fitch Revises Fairfax's Outlook to Positive; Affirms Ratings (fitchratings.com) Fitch uses (and publishes) a relevant table: FFH has been known to be unusually creative during transitions (in the spectrum from survival to capacity to benefit from opportunities) but (opinion) the capacity to move float funds from fixed income to equity would be limited, much much less than 25% of their fixed income portfolio.
-
Berkshire Hathaway Annual Meeting 2024
Cigarbutt replied to good-investing's topic in Berkshire Hathaway
Whether it's conscious or not, planned or not or whatever, over the years, there has been some defensible movements of the fixed vs float quantity/duration balance. Using this methodology, at Q4 2023, the ratio was 106%, at Q1 2024, 112%. Even if there is some kind of rationality (relative lack of equity opportunities at reasonable prices), it's sometimes hard to differentiate tactical asset allocation from market timing. ----- i would say this aspect is also relevant for people wondering (on the FFH threads) how much money could be shifted from bonds to equities in certain circumstances.
-
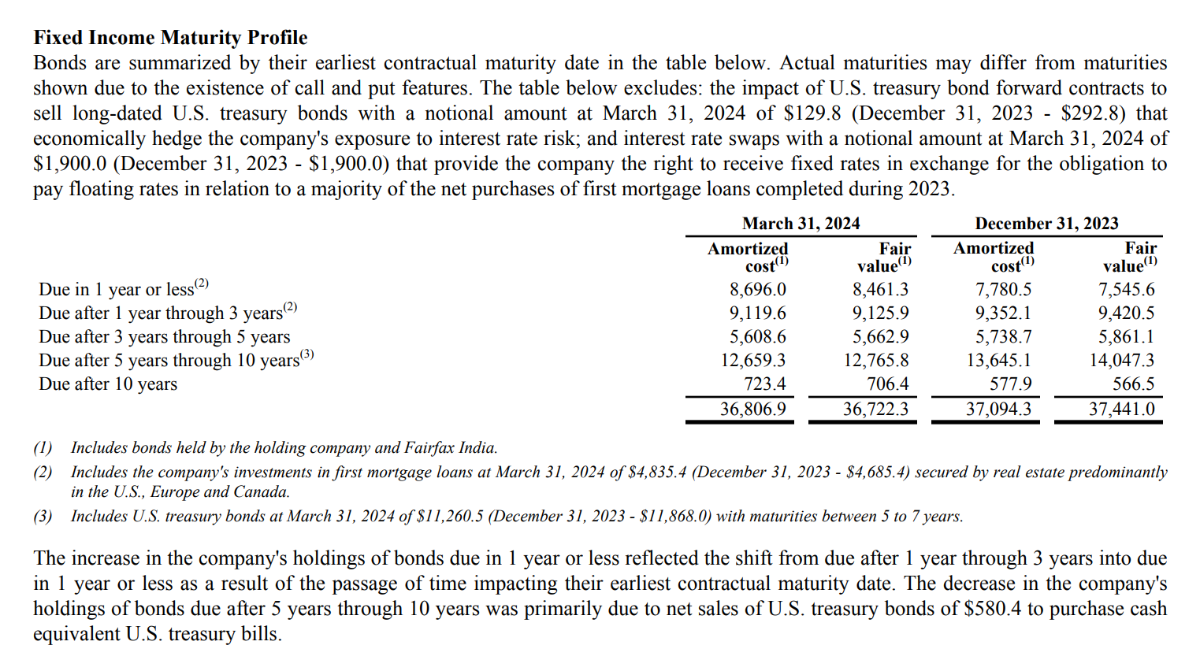
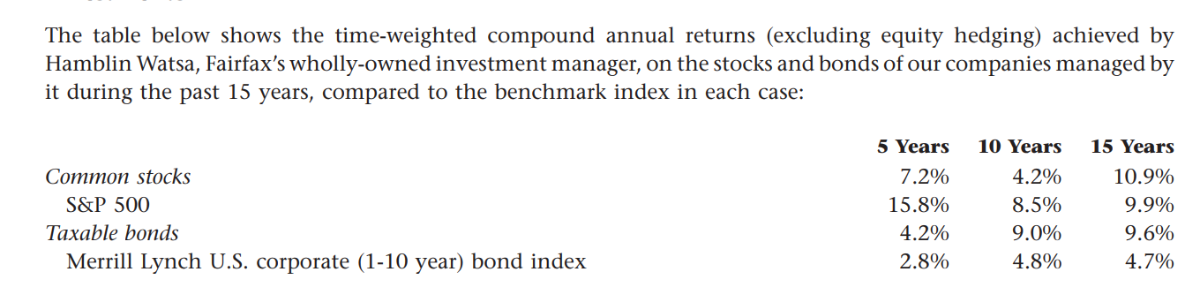
This well explained in the interim report: FFH used to report their relative bond performance (last time from 2017 annual report; from memory this did not even include the CDS swap gains which imo were sort of bond investments): Since then, (guess to some degree) it appears that their relative total return bond performance has come down, with relative coupon income performance improving. FFH has had (at least up to 2016-7) an unusual capacity to harvest alpha-type capital gains in bonds, especially during "transitions". Those capital gains have been (at least up to 2016-7) lumpy but incredibly significant given the high (sort of leveraged float portfolio) exposure to bonds versus equity. Maybe this isn't so relevant anymore? What is the difference between tactical asset allocation and market timing?
-
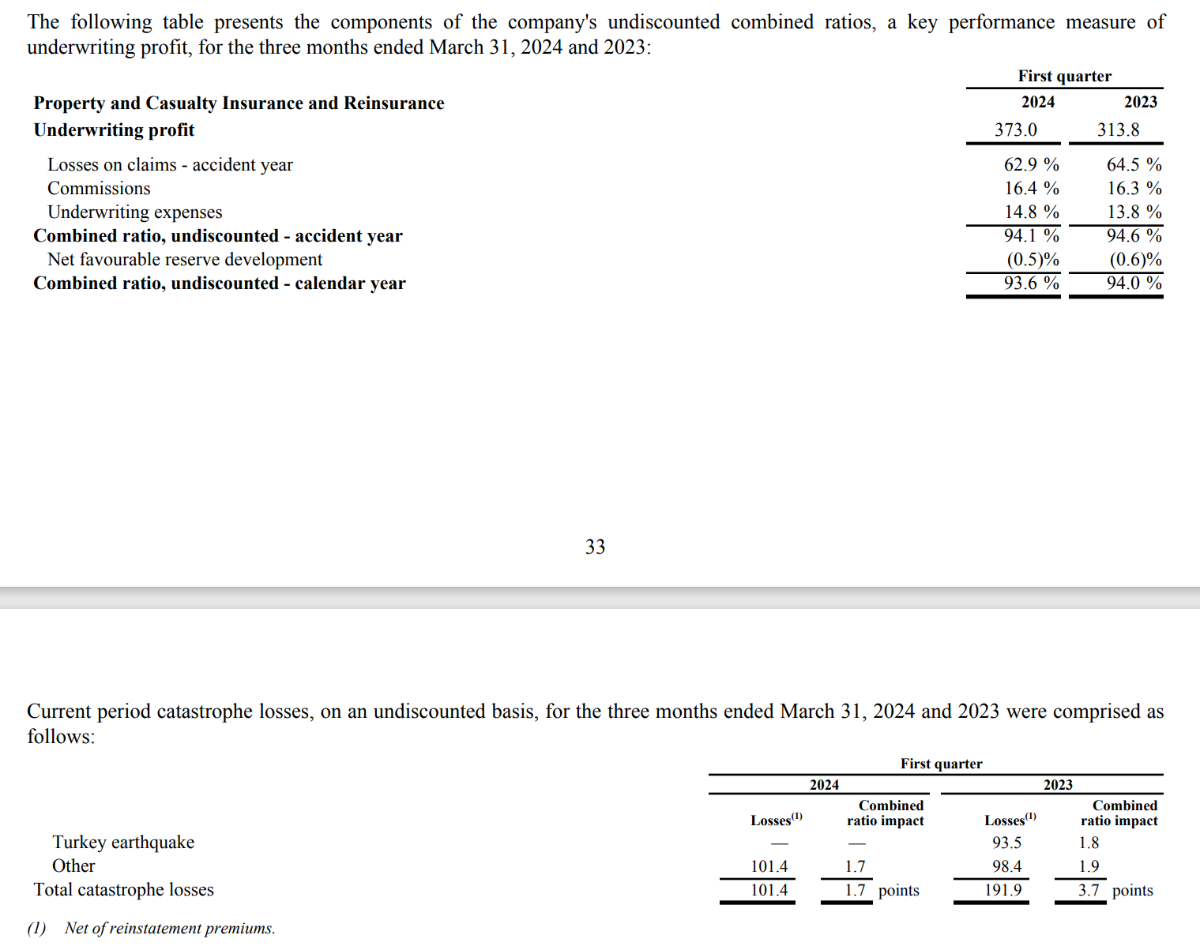
For the Q1 underwriting side, short term volatility prevents meaningful conclusions about underlying trends. Numbers show a slight deterioration and this will be followed. For Q1 of 2022, 2023 and 2024, the underlying AY undiscounted CR ex-cat shows: 90.8, 90.9 and 92.4. These numbers exclude run-off (short term volatility even more significant here) and in Q1 2024, they report about a 1% favorable reserve development. There is an expectation that FFH will continue to perform better than comparable peers on the underwriting front.
-
On this Board, some work had been done in FFH's threads concerning the first round of Brit's sale and then re-acquisition of a minority interest. ----- Summary (From Feb 15th 2021): Taking OMERS' perspective as FFH contributed capital and assigned its own dividends to Brit (all numbers in USD) Summer 2015: OMERS (buys) pays 4.30 per share for 120M shares (29.92% interest), with a shareholders' agreement stipulating an annual dividend at 0.43 per share. Total 516.0M In 2016: OMERS (sells) gets 4.30 per share for 13.449M shares, 57.8M In 2018: OMERS (sells) gets 4.30 per share for 58.551M shares, 251.8M In 2020: OMERS (sells) gets 4.30 per share for the remaining 48.000M shares, 206.4M Total re-sold = 120M shares for 516.0M getting yearly 0.43 US cents per 4.30 USD share along the way. So effectively a post-tax financing rate of 10%. For some time, this didn't seem to make much economic sense but...eventually it did? Note: This line of thinking required some work in both FFH's and Brit's various filings. The numbers are clear about the price paid and the prices received by OMERS, showing how these co-investors' transactions are of the financing type. For the 10% yearly 'dividend' rate, some inferences need to be made but (opinion) the inference is likely right. Note: This type of work was not quite straightforward and the application of IFRS accounting has made it (at least for me) much more byzantine. ----- Based on the above, what about the 'cost' to re-acquire Brit's minority interest. Short story: there is a lot of IFRS-related accounting noise but, in substance, FFH will likely buy back the minority interest at the price for which it was sold (fixed price), with a fixed dividend rate along the way. ----- The following is based on hunch as much as knowledge so feel free to improve. With IFRS, selling a minority interest is considered an equity transaction and transaction gains of the revaluation type have to be recognized (as well as a non-controlling revalued interest). For FFH, this comes with a call option to buy back the non-controlled interest (at a fixed price) which appears to be treated like a derivative asset with a value taking into consideration the changing value of the non-controlled interest which, itself, is influenced by the NCI's share of earnings. So, my understanding is that the call option value will tend to increase over time based on the subsidiary's positive income and this will be recognized in net income (and retained earnings) at the parent level from the financial asset gain. But this is not really an economic gain and it looks like the way to deal with this from an accounting point of view is to deduct this financial gain (reduced income and reduced retained earnings) when the call option to buy back the minority stake is exercised. Short story (opinion): this accounting noise is just that.
-
Interesting. In Japan (see below), during a certain period, there was a growing trend (increasing corporate cross-holdings in a rising market): For the US, this time is different because the level of corporate cross-holdings is low. In your great country, the trend is for the rising market to be held by the top 1% and "foreigners".
-
-Attempt to answer this question, a reference to investment performance and another question The reference may be related to wind risk in the Northeast USA (it's tricky to refer to this risk as there may be climatic repercussions...i found the picture below which is climate-agnostic): i know that a "roughly" 1% exceedance probability is nothing to be excited about for the typical human but, when reading human recollections of such events in the New England area during the past century, people describe unexpected change with sunny skies changing to some kind of roar. People who tell these stories had either foresight or were simply lucky. Opinion: FFH is relatively well positioned for such event but who really knows? ----- Opinion: To explain FFH's stock value outperformance over the last 38 years by referring to "leverage in a bull market" is likely a (over) simplification. They used to compare (in older annual reports, in the CEO's section) their relative investment outperformance compared to bond indices and large stock indices and the results were impressive (Graham-Doddsville type), a good thing because their underwriting performance was really terrible, then). ----- Opinion: There is a short supply of discussion on the evolution of their investment stance (apart from sparse and intermittent mention of the cost part related to their previous posture). They used to position their portfolio in order to withstand a similar 1% exceedance probability event, a protection against the general markets not just wind but who cares these days?
-
This line of reasoning raises the possibility that one comes to an incorrect conclusion. The first issue is that float is based on net (not gross) insurance reserve liabilities (when premiums are ceded to another party of the reinsurance type so is the "float"). In 2017, FFH retained 81.8% of gross premiums and in 2023, 78.6% of gross premiums. So this partly explains why the growth in float was slower than the growth in gross premiums and is an issue unrelated to the "duration" of insurance liabilities. The second and more important issue is more conceptual (and even mathematical). To assess the validity or signal when comparing the growth of premiums and float, one would have to assume some kind of steady state (for example, constant growth over time). Think of an insurer which decides to significantly curtail new business or even move to run-off. Then the negative growth in gross premiums would happen faster than the decline in float because of the lag effect and the shape of the payment distribution over time, an issue not linked to a change in the "duration" of insurance liabilities. Recently, FFH has grown ++ the gross premiums component: The relative float growth will catch up over time especially if the growth in gross premiums written settles down (it's just a timing issue at this point) and this temporary decoupling is essentially unrelated to a hypothetical change in the "duration" of insurance liabilities. One way to support the above is to observe, over time, the composition and distribution of the insurance product lines. This appears to be quite constant. On a recent conference call, the CFO mentioned an insurance liability duration of 3.8 years and i would suggest that this duration hasn't changed much in the last few years. ----- Reading the above, i'm not sure it makes sense? Being simple minded (thinking along first principles is above my capacity), i always try analogies. So, for example, if you try to be more friendly to others around you, eventually, people around you will become more friendly to you (no guarantee of course) but there is a lag effect and your rate of growth of being nicer to others will precede the rate of growth of others being nice to you. The opposite obviously can occur but there may be a lag effect in the other direction as well due to the accumulation of social capital. Makes sense?
-
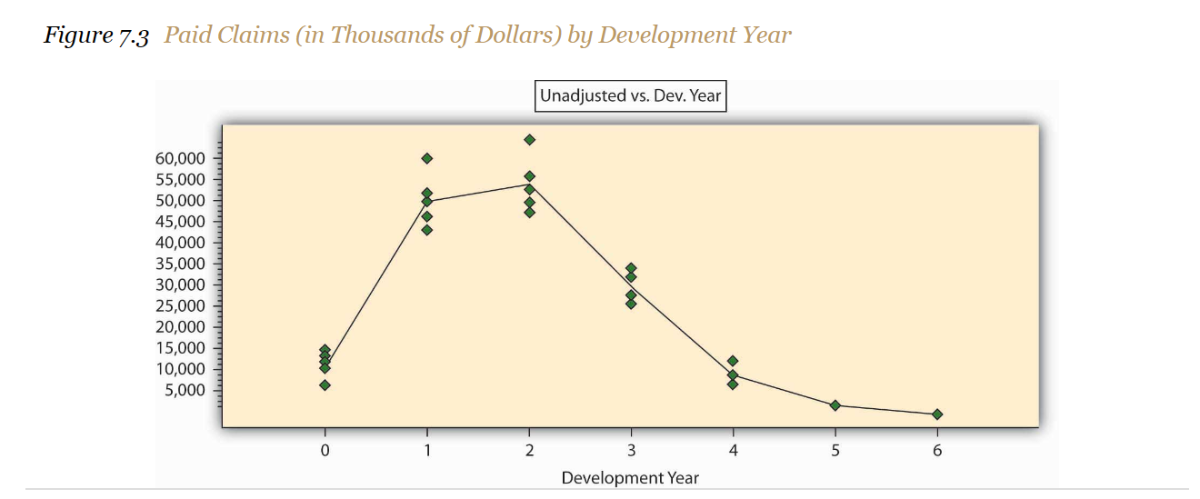
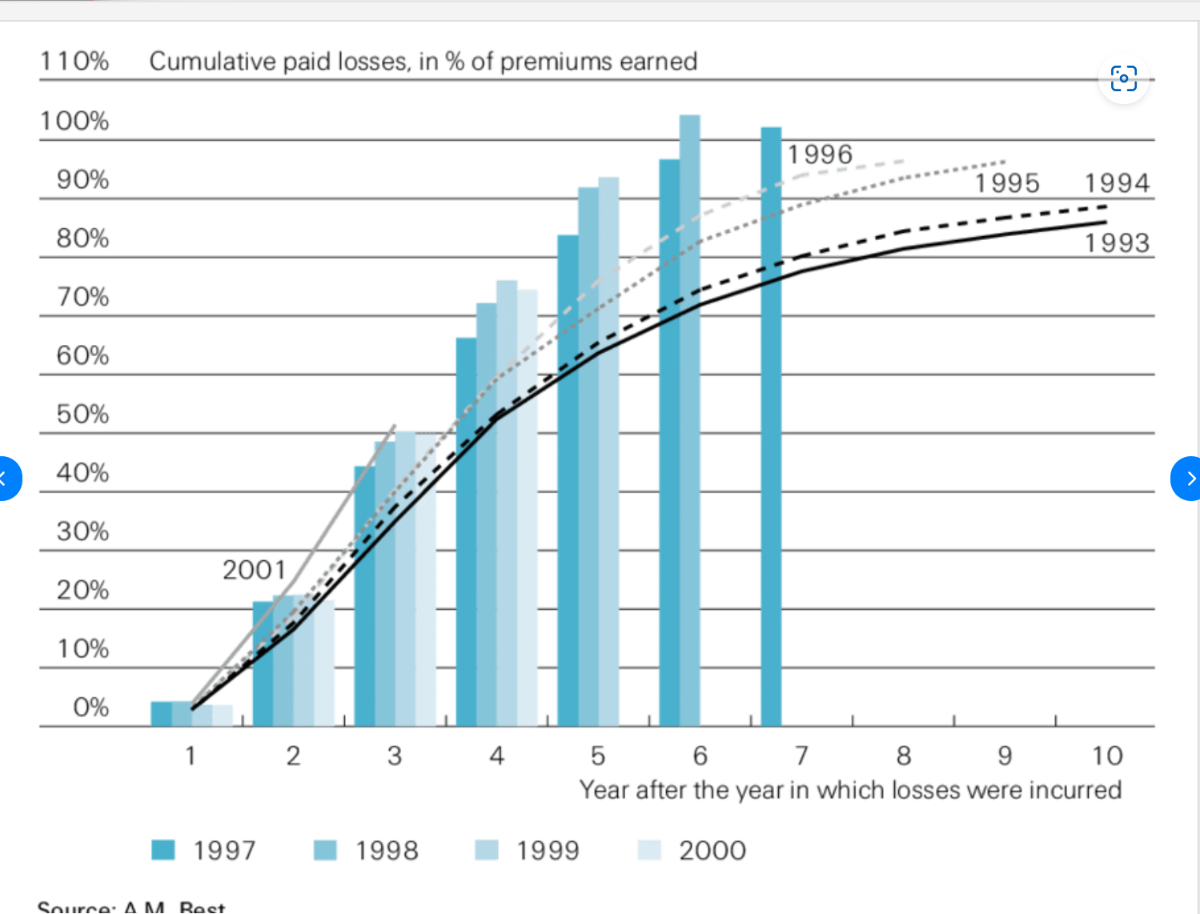
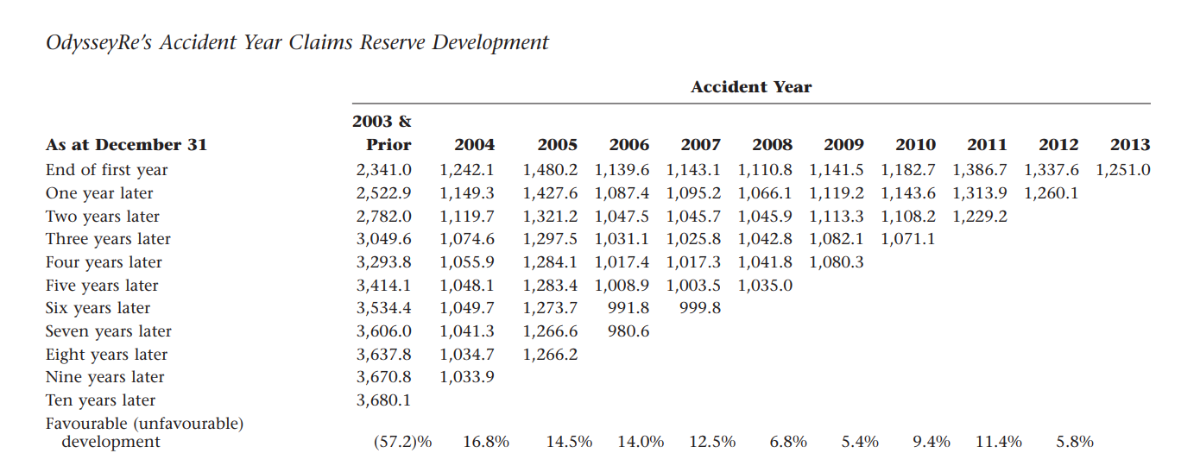
The prospective measure you're looking for may be an elusive goal. The diagonal measure you describe could reveal some info but IMO not more than the current accident year combined ratio and the ratio you compute could be influenced by recent growth in premiums written which, in itself, would increase the ratio as the payment curve is not bell-shaped with more payments early on and then a long tail to the right. Example: The idea is to try, for each years and trend-wise, to identify a deviation from the expected trajectory. This is not easy and insurers may be slow to recognize developing issues. For example, look at the following which is a significant pattern that started to develop in the late 90s for medical malpractice claims: Over time, it became clear that developing trends would become very costly. BTW, this cumulative payment curve is sort of representative for the average long-tail type of lines that FFH carries (duration and shape). Up to 2013, FFH reported accident year reserve development and that was helpful but it's not a requirement and is no longer reported by them. It's possible to figure it out but it takes some effort.