kevin4u2
-
Posts
341 -
Joined
-
Last visited
Content Type
Profiles
Forums
Events
Everything posted by kevin4u2
-
Aren't the derivatives linked to CPI? The latest contracts only need CPI to be 0.5%. And no, the contracts do not need outright deflation, just like credit default swaps don't need a default. Market perceptions will greatly influence the price.
-
From the 2014 Annual Report.... Hedging our common equity exposures has been very costly for us over the last five years – particularly in 2013. However, we did warn you that we wanted to be safe rather than sorry – our time will come again! We have worried about deflation in the past few years in our Annual Reports – it is now upon us! In spite of QE1, QE2 and QE3 and some twists, we saw deflation in the U.S. in the second half of 2014, as shown in the table below: % change June – U.S. CPI Index June July August September October November December June-Dec. 2014 238.3 238.3 237.9 238.0 237.4 236.2 234.8 -1.5% We have had deflation at an annualized rate of 3% in the second half of 2014 in the U.S.! And it is not going away. In fact, in January 2015, the U.S. reported its first year-over-year decline in the CPI index since 2009 of 0.1%. In Europe, we had deflation of 0.5% in the second half of 2014, as shown in the table below: % change European CPI June – June July August September October November December June-Dec. 2014 117.6 116.8 116.9 117.4 117.4 117.1 117.0 -0.5% As of January 2015, 17 out of 19 countries in the Euro area were experiencing deflation on a year-over-year basis. However 8 months into 2015 where is the deflation? and at what cost? Over $4 billion dollars plus opportunity cost. One quick example, if FFH had not spent this money hedging it could have bought 100% of Brit, no equity issue required. Here is a very interesting write up from Az Value, worth a read..... http://azvalue.blogspot.ca/2014/04/fairfax-and-their-bets-now-looking-in.html FWIW, while FFH is losing money hedging BRK is buying, investing $38 billion in PCP and another $4.4 billion in Philips 66. my $0.02 cheers Zorro Zorro. Please explain where you're getting this $4 billion cost on CPI derivatives? Nonsense. Your spewing incorrect numbers just like AZvalue did in his post about FFH compared to BRK. AZvalue incorrectly calculated the change in book value per share in his comparision of FFH to BRK. Properly calculated FFH outperforms BRK in every category except 5 years. Try again next time. From page 20 of the Fairfax 2014 annual report...... In the last five years, we have had significant losses, mostly unrealized, from our hedging program and from our CPI-linked derivative contracts, as shown below: 2010 2011 2012 2013 2014 Cumulative Equity hedges (936.6) 413.9 (1,005.5) (1,982.0) (194.5) (3,704.7) CPI-linked derivative contracts 28.1 (233.9) (129.2) (126.9) 17.7 (444.2) Total (908.5) 180.0 (1,134.7) (2,108.9) (176.8 ) (4,148.9) My nonsense as you call it comes from the annual report, try reading it before attacking someone next time....and try being civil. Reread your post. Where did you say you were including the equity hedges? This is the deflation hedges thread and all you quoted and discussed was the CPI hedges. We are 8 months into 2015 and the costs of the CPI hedges are $444 million dollars, not $4 billion. Now you want to include the equity hedges. Ok, whatever. As Dazel has pointed out this is a 1% cost spread over a number of years for insurance. Time will tell if they will pay off.
-
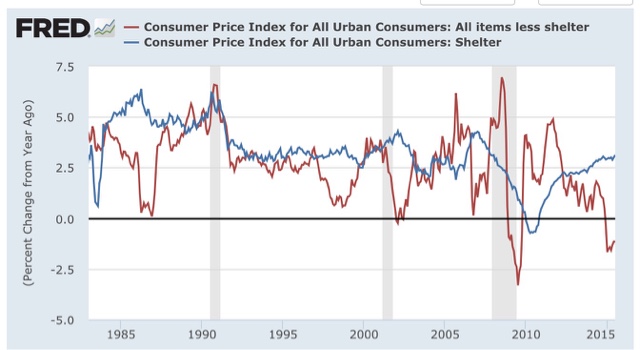
Yes. Household debt is significantly below pre crisis levels. At least in the US. Didn't check all of Europe. As I have said before. This statistic in isolation is a waste of time. Total debt to whatever income measure you want has increased not decreased since the last financial crisis. Only the US, UK, Spain and Ireland have experienced household deleveraging. The McKinsey study shows 80% of countries have higher household debt. Some quotes from the study: Seven years after the global financial crisis, no major economy and only five developing ones have reduced the ratio of debt to GDP (Exhibit 2). In contrast, 14 countries have increased total debt-to-GDP ratios by more than 50 percentage points. Which countries have deleveraged since the last crisis? Israel, Romania, Saudi Arabia, Egypt, and Argentina. The fact that there has been very little deleveraging around the world since 2007 is cause for concern. A growing body of evidence shows that economic growth prospects for countries with very high levels of debt are diminished. High levels of debt—whether government or private-sector—are associated with slower GDP growth in the long term, and highly indebted countries are also more likely to experience severe and lengthy downturns in the event of a crisis, as consumption and business investment plunge.10 Indeed, the latest research demonstrates how high levels of debt lead to a vicious cycle of falling consumption and employment, causing long and deep recessions. Kevin, I've engaged with you on another thread where you were talking about a lot of different things at once. I told you that if you want to explore any of them in particular based on economic concepts I'd be glad to go into them with you. You didn't reply. In that topic you've also referenced this McKinsey paper. It is at best a lazy paper and at worst dishonest. In it they constantly mix up rates and levels of debt. A total no-no. Also the concept that they use that higher levels of debt lead to the vicious cycle of lower economic growth and higher unemployment comes from a Reinhart & Rogoff paper that has been discredited in a very embarrassing way when it was proven that their math was wrong which led them to confuse causality with correlation. Over here I was talking about the FFH deflation hedges that apply to US and EU, not globally. If you're going to make an economic argument for deflation you should explain how we are at risk of a massive decrease in demand or a massive increase in supply that will break sticky prices and put those economies in deflation. By the way, a very slow overall deleveraging with the government levering up to offset private sector delevering is key to avoid deflation. So what exactly is your point? Why did you waste some many words? You could have just said, "I'm smarter than everyone." Are you an economist? My point was there has been no, "slow overall deleveraging". We already have deflation for everything in the CPI less shelter, see attached. No massive changes changes needed.

-
From the 2014 Annual Report.... Hedging our common equity exposures has been very costly for us over the last five years – particularly in 2013. However, we did warn you that we wanted to be safe rather than sorry – our time will come again! We have worried about deflation in the past few years in our Annual Reports – it is now upon us! In spite of QE1, QE2 and QE3 and some twists, we saw deflation in the U.S. in the second half of 2014, as shown in the table below: % change June – U.S. CPI Index June July August September October November December June-Dec. 2014 238.3 238.3 237.9 238.0 237.4 236.2 234.8 -1.5% We have had deflation at an annualized rate of 3% in the second half of 2014 in the U.S.! And it is not going away. In fact, in January 2015, the U.S. reported its first year-over-year decline in the CPI index since 2009 of 0.1%. In Europe, we had deflation of 0.5% in the second half of 2014, as shown in the table below: % change European CPI June – June July August September October November December June-Dec. 2014 117.6 116.8 116.9 117.4 117.4 117.1 117.0 -0.5% As of January 2015, 17 out of 19 countries in the Euro area were experiencing deflation on a year-over-year basis. However 8 months into 2015 where is the deflation? and at what cost? Over $4 billion dollars plus opportunity cost. One quick example, if FFH had not spent this money hedging it could have bought 100% of Brit, no equity issue required. Here is a very interesting write up from Az Value, worth a read..... http://azvalue.blogspot.ca/2014/04/fairfax-and-their-bets-now-looking-in.html FWIW, while FFH is losing money hedging BRK is buying, investing $38 billion in PCP and another $4.4 billion in Philips 66. my $0.02 cheers Zorro Zorro. Please explain where you're getting this $4 billion cost on CPI derivatives? Nonsense. Your spewing incorrect numbers just like AZvalue did in his post about FFH compared to BRK. AZvalue incorrectly calculated the change in book value per share in his comparision of FFH to BRK. Properly calculated FFH outperforms BRK in every category except 5 years. Try again next time.
-
Yes. Household debt is significantly below pre crisis levels. At least in the US. Didn't check all of Europe. As I have said before. This statistic in isolation is a waste of time. Total debt to whatever income measure you want has increased not decreased since the last financial crisis. Only the US, UK, Spain and Ireland have experienced household deleveraging. The McKinsey study shows 80% of countries have higher household debt. Some quotes from the study: Seven years after the global financial crisis, no major economy and only five developing ones have reduced the ratio of debt to GDP (Exhibit 2). In contrast, 14 countries have increased total debt-to-GDP ratios by more than 50 percentage points. Which countries have deleveraged since the last crisis? Israel, Romania, Saudi Arabia, Egypt, and Argentina. The fact that there has been very little deleveraging around the world since 2007 is cause for concern. A growing body of evidence shows that economic growth prospects for countries with very high levels of debt are diminished. High levels of debt—whether government or private-sector—are associated with slower GDP growth in the long term, and highly indebted countries are also more likely to experience severe and lengthy downturns in the event of a crisis, as consumption and business investment plunge.10 Indeed, the latest research demonstrates how high levels of debt lead to a vicious cycle of falling consumption and employment, causing long and deep recessions.
-
These off hand comments may sound good but are not true. Can you please name one coal company that has consistently earned 12-14% on capital in the last couple years? I'll spare you the effort as Peabody, Alpha, Arch, and Walter have all had negative returns on capital for the past couple years, most of them for 3-5 years. Teck, part of which is coal, has earned 2% on capital for the last couple years. The average return on capital for all oil and gas companies in Canada is -1.5% for both Q4 2014 and Q1 2015 of this year according to Statscan. Mining is a positive 3%. In general, the Canadian oil and gas sector does not make money which makes it tough to have a return on capital Suncor, which was mentioned, will be lucky to earn about 2% on capital this year. To be fair, Peyto earn 10% on capital last year, not the numbers you quoted, in a tough NG price environment. Alliance Resource Partners and Consol Coal Resources. Suncor Energy will likely earn about 6-7% return this year. Alliance - Can you tell me more about this company? They are the only immensely profitable coal company I have ever seen. 2014 ROCE - 32% 2013 ROCE - 24% Consol - Just like everyone else. 2014 ROCE - 3.2% 2013 ROCE - 1.7% Suncor earned 5.7% on capital last year. Net profit was $2.7 USD billion. So far in 2015 they have earned $388 USD million so return on capital will be hardly above zero. Value line has them earning 2.5% on capital this year and I think that is generous.
-
These off hand comments may sound good but are not true. Can you please name one coal company that has consistently earned 12-14% on capital in the last couple years? I'll spare you the effort as Peabody, Alpha, Arch, and Walter have all had negative returns on capital for the past couple years, most of them for 3-5 years. Teck, part of which is coal, has earned 2% on capital for the last couple years. The average return on capital for all oil and gas companies in Canada is -1.5% for both Q4 2014 and Q1 2015 of this year according to Statscan. Mining is a positive 3%. In general, the Canadian oil and gas sector does not make money which makes it tough to have a return on capital Suncor, which was mentioned, will be lucky to earn about 2% on capital this year. To be fair, Peyto earn 10% on capital last year, not the numbers you quoted, in a tough NG price environment.
-
I don't see much of your point here about debt and deleveraging? You say of debt has gone up by >1 Tn! No deleveraging! Ok which debt? How much has GDP moved during that time? Debt has definitely gone up since 1920s too. Are we more leveraged now than then? You may want to pay closer attention to these things. Btw, household debt to gdp has gone down from 98% in 2009 to 80% now. Sure looks like deleveraging to me. I'm not gonna spend time now pulling the corporate debt numbers but those have gone down too. So how exactly is deleveraging not happening? Regarding financial repression as you put it, I see no shortage of sophisticated private investors lining up to buy US treasuries. I don't think you have a clue as to what original mungerville is talking about. Since the bursting of the so called credit bubble, global debt has continued to rocket ahead by 57 trillion dollars (through Q2 2014). That means the total global debt to GDP is now close to 300% while back during the last crisis it was 269%. There has been no bursting of the debt bubble, no deleveraging. Debt is the problem, it is driving the growth. Without ever increasing debt, developed economies are screwed. You are correct that households in the USA have deleveraged as a % but they have not in Canada and many other developed economies. You relying on one of very few data points that have deleveraged since the last financial crisis. I would pull the corporate data if I were you and especially the government. US government debt is up almost 10% annually since the last credit crisis. That more than offsets any deleveraging among households. Meanwhile in China, debt to GDP has increased from 158% to 282% (through Q2 2014). No big deal. Total debt in China has grown from $USD 7.4 trillion to 28.2 trillion since the last crisis. Keep in mind that China's GDP is $10 trillion per year. Stop and think about that for a second, its almost unbelievable. How big is the credit bubble going to get? rb, there you go. If you want to read up further, here it is: http://www.mckinsey.com/insights/economic_studies/debt_and_not_much_deleveraging You were correct, US government debt growth was not 10%, I was referring to global government debt. My apologies. That said, the basic argument is still remains. If the so called credit crisis was because of excessive leverage, all that has happened since is adding more leverage relative to output (however measured). If the last crisis was bad, the next one will be worse. Why do you think otherwise? The US already has deflation almost universally except housing. How big is the credit bubble going to get?
-
What you say is partially true. They are not forced to sell at low prices as you can shut in your production if you like. They question is why wouldn't they sell their product when they are the lowest cost operator and are still profitable at current prices. Turning to the original question, the real outsider of Peyto is the Chairman and founder, Don Gray. He isn't the most respected person in Calgary, mostly because of his mouth. The trouble is the what he says about the O&G industry is true. Some people would like him to shut up. He stepped down as CEO of PEY in 2006 and let his right hand man, Darren Gee take over. I would highly recommend reading his Chairman's message (typically 1 page) on the inside of the annual report each year. He regularly quotes Buffett. Here is what Don said in the 2010 report. Many companies in our industry try to confuse investors when they talk about production growth. When you look closer and do the math, you quickly discover they are talking in gross numbers, before adjusting for new debt or equity issued to achieve their so-called growth. In many cases, companies touting huge growth actually shrank on a per share basis. Unfortunately, this has been going on for years in our industry. I recall presenting at a major energy conference in Calgary back in June 2002. Two other CEOs had just delivered presentations in which they claimed huge growth numbers. They were outraged when, minutes later, I showed actual results for their companies and Peyto on a per share basis; my presentation completely contradicted what they had just told the audience. I decided that would be the last time I attended the conference as there was just too much noise for investors to really hear the true stories. Companies have a responsibility to communicate to their owners honestly and shareholders should not have to dig deep just to find out how their share of the production, reserves and cash flow has performed. At Peyto we have a long history of treating our shareholders as partners and communicating with them openly and honestly. If you think he is joking, try finding another company in Calgary that reports production growth PER SHARE at the top of every quarterly press release (first bullet point). So if your worried about dilution, they'll tell you up front what you own as a shareholder on the first line of the quarterly results. This is also a good article on the history of Peyto, Don Gray, and all the snake oil salesmen in Alberta. http://www.theglobeandmail.com/report-on-business/rob-magazine/don-gray-is-the-biggest-jerk-genius-in-the-oil-patch/article18280515/?page=all Here is a great quote from that article. Gray's motivation is twofold. One is recognition for Peyto. A September, 2004, Peyto presentation--72 pages long--features chart after chart ranking Peyto No. 1 versus its peers, all the numbers put together by Gray himself, in contrast to the usual corporate practice of synthesizing work from friendly analysts. But the overarching motivation is a truth warrior's. Gray sees little original thought in the oil patch, just a bunch of people chasing the latest trend. "I see them almost as cowards," Gray says, adding that people become too averse to risk as they climb to the top rungs of the business. "They're quite happy with just being average, being the mediocre....It's hardly my competitors that challenge us. It's more my mouth that challenges us." One outlet for his combative critiques is Peyto's website (peyto.com). "I love the fact that I have a bully pulpit," he says, "where I can educate people....I take a lot of pride in having intelligent people as my investors, as opposed to some of these other guys." His mind jumps to a company (not Progress) that happens to have reported its third quarter on the day we're talking. It boasted of an increase in production of 30%. But on a per-unit basis, it was down 34%, a figure not highlighted. This is common, Gray says. "It really bothers me when people make money that they don't really deserve."
-
I would add Bonddad Blog. While I disagree with their political views they provide some interesting commentary on the economy. http://bonddad.blogspot.ca/2015/08/july-consumer-prices-all-intact-trends.html an excerpt First, inflation continues to be confined almost exclusively to housing. The below graph comparing CPI for shelter (blue) vs. everything else (red) continues to show housing inflation a little on the "hot" side, while everything else remains in the most severe deflation in the last 50 years outside of the Great Recession: http://bonddad.blogspot.ca/2015/08/july-jobs-report-good-but-evidence-that.html an excerpt: An important longer-term note of caution is that this report (July Jobs), even moreso than most this year, significantly underperformed what the near-record population adjusted rate of initial jobless claims predicted. Hiring is lagging firing, and the YoY growth in employment looks increasingly likely to have peaked. That tells me we are in the 6th or 7th inning of thhis expansion. We are beginning to run out of time for significant real and nominal wage growth before the next recession hits, and that means the odds of actual wage deflation in the next recession are starting to increase. You can always get some interesting facts here: http://blog.yardeni.com/ Permabull Brian Wesbury at First Trust http://www.ftportfolios.com/Retail/Research/Subscription.aspx You can't go wrong with Scott Grannis who was already mentioned.
-
I don't see much of your point here about debt and deleveraging? You say of debt has gone up by >1 Tn! No deleveraging! Ok which debt? How much has GDP moved during that time? Debt has definitely gone up since 1920s too. Are we more leveraged now than then? You may want to pay closer attention to these things. Btw, household debt to gdp has gone down from 98% in 2009 to 80% now. Sure looks like deleveraging to me. I'm not gonna spend time now pulling the corporate debt numbers but those have gone down too. So how exactly is deleveraging not happening? Regarding financial repression as you put it, I see no shortage of sophisticated private investors lining up to buy US treasuries. I don't think you have a clue as to what original mungerville is talking about. Since the bursting of the so called credit bubble, global debt has continued to rocket ahead by 57 trillion dollars (through Q2 2014). That means the total global debt to GDP is now close to 300% while back during the last crisis it was 269%. There has been no bursting of the debt bubble, no deleveraging. Debt is the problem, it is driving the growth. Without ever increasing debt, developed economies are screwed. You are correct that households in the USA have deleveraged as a % but they have not in Canada and many other developed economies. You relying on one of very few data points that have deleveraged since the last financial crisis. I would pull the corporate data if I were you and especially the government. US government debt is up almost 10% annually since the last credit crisis. That more than offsets any deleveraging among households. Meanwhile in China, debt to GDP has increased from 158% to 282% (through Q2 2014). No big deal. Total debt in China has grown from $USD 7.4 trillion to 28.2 trillion since the last crisis. Keep in mind that China's GDP is $10 trillion per year. Stop and think about that for a second, its almost unbelievable. How big is the credit bubble going to get?
-
I do. I added FFH.
-
They acquired a competitor and liquidated the assets for the purchase price. Some points to considers: 1) Return of capital does not equal return on capital. They did not make 100% return on this acquisition. 2) The refinanced debt is at 9%. That tells you the credit quality. 3) They will not realize the revenue or EBITDA of Hodges, unless they can magically do so without the assets. 4) Even if they still had the assets they don't have any customers. 5) Their are additional costs in executing this type of deal that need to be considered. Listen, all they did was take out a competitor to alleviate pricing pressure. Some service companies are operating with negative gross margins. I would also ask you this. Did the people/companies that bought the liquidated equipment plan on burning it or using it? If they plan on using it, then a new startup competitor will be now competing with them. A new startup may even have lower costs. How long will the better pricing last?
-
Oil, wow, WTF happened to all of the oil bugs on this site?
kevin4u2 replied to opihiman2's topic in General Discussion
There is a really good Bloomberg masters in business podcast with him recently. I would also google Camp Kotok. The guy make not be perfect but the camp kotok gathering is the whos who of money management. He seems to fly under the radar. -
What is so amazing and unbelievable?
-
While you do make some interesting points I would encourage you to think about one thing. Over the past few decades has demand for computers decreased or increased. Obviously increased, right. Yet prices have steadily declined. So deflation can occur even when demand is increasing. This is totally counter to your earlier point that people don't wait for a cheaper tomorrow. Perhaps demand has nothing to do with falling prices?
-
I hate pointing out the obvious, but I couldn't help but laugh when everyone on here is an INTJ, which is statistically almost impossible. Or is the MBTI "meaningless"? I would love an alternative explanation.
-
Partner 24 hit the nail on the head. MBTI is been proven useless. Why the Myers-Briggs test is totally meaningless http://www.vox.com/2014/7/15/5881947/myers-briggs-personality-test-meaningless Some quotes: About 2 million people take it annually, at the behest of corporate HR departments, colleges, and even government agencies. The company that produces and markets the test makes around $20 million off it each year. The only problem? The test is completely meaningless. But the test was developed in the 1940s based off the totally untested theories of Carl Jung and is now thoroughly disregarded by the psychology community. Even Jung warned that his personality "types" were just rough tendencies he'd observed, rather than strict classifications. Several analyses have shown the test is totally ineffective at predicting people's success in various jobs, and that about half of the people who take it twice get different results each time. This isn't a test designed to accurately categorize people, but a test designed to make them feel happy after taking it. This is one of the reasons why it's persisted for so many years in the corporate world after being disregarded by psychologists. But the problem with that idea is that the fact that the test is notoriously inconsistent. Research has found that as much as 50 percent of people arrive at a different result the second time they take a test, even if it's just five weeks later. It's 2015. Thousands of professional psychologists have evaluated the century-old Myers-Briggs, found it to be inaccurate and arbitrary, and devised better systems for evaluating personality. Let's stop using this outdated test — which has about as much scientific validity as your astrological sign — and move on to something else. The online test is also less rigorous than the "official" test which my wife was administered at her company. She got a significantly different result with that than online.
-
It has been making rounds for over a year now. It might be worthwhile for you to actually read the circular, but then again, "[your] comfortable in [your] reasoning and conclusions so far." This forum is broken. So little discussion of facts anymore.
-
Does NPV include sustaining capex and NAV?
kevin4u2 replied to scorpioncapital's topic in General Discussion
5% is way too low. Discount rates should reflect all of the risks. Interest rates are only one factor. There are so many inherent assumption in calculating the npv, be sure to understand the fine print. My hurdle is 15%. You can rarely find opportunities at that level, but occasionally the market is stupid. The single biggest factor is the forward commodity prices that are assumed. The second is production assumptions. You can even get one correct and if the other goes south, and you can lose big. -
What makes people want to work for Buffett?
kevin4u2 replied to Cevian's topic in Berkshire Hathaway
The HR theory I learned in business school teaches that there are 4 drivers of employee motivation. They are the drive to Acquire, Bond, Comprehend, and Defend. Do a google search and you can read all about them. Obviously the drive to acquire is generally not an issue, but Bond (belong), Comprehend (challenge), and Defend (security) are all important aspects to what is driving Buffett's top performers. Few companies are good at offering the later three drives and people will generally work at companies for less money where those are met. Southwest airlines is perhaps the best example. Money isn't everything, and if you can provide a workplace that helps employees meet their needs, self actualization will follow. -
Does NPV include sustaining capex and NAV?
kevin4u2 replied to scorpioncapital's topic in General Discussion
What industry are you referring to? Any NPV table should define the cash flow stream and the assumptions involved. The 5% is the discount rate. The NPV is the net present value of the cash flow stream. If you want "Net" asset value, deduct the liabilities. -
My point is that you cannot defy the laws of economics. If you want to shut certain individuals out of the credit market, then legislation will do the trick. So in your opinion it would be better if there was no rate cap limit and military personnel was loaned money at over 36% APR? :o
-
Those who want others to act altruistically are the greedy ones, just follow the money. I couldn't help but be reminded of this fantastic explanation by Milton Friedman. Here is the unintended consequence of Tim's idea of capping lending rates at 4%. This comes from a payday lender's annual report. So much for a free lunch. Federal law limits the annual percentage rate that may be charged on loans made to active duty military personnel and their immediate families at 36%. This 36% annual percentage rate cap applies to a variety of loan products, including consumer loans, though it does not apply to pawn loans. We do not make consumer loans to active duty military personnel or their immediate families because it is not economically feasible for us to do so at these rates.
-
I have a BB Z10. I wouldn't own an iPhone if you paid me. To those who have a passport, how to you find the size? I was amazed at how big it is. Interested in your perspective.