treasurehunt
-
Posts
560 -
Joined
-
Last visited
-
Days Won
1
Content Type
Profiles
Forums
Events
Everything posted by treasurehunt
-
I couldn't find anything troublesome in this report. Very impressive. Q4 combined ratio was 88.6%! 93% for the whole year. Favorable reserve development in Q4 2025 was actually less than in Q4 2024, but low cat losses were helpful in reducing the CR. Insurance operations are looking good.
-
Interesting thought. Before reading this, I hadn't considered the effects on energy usage of having a giant army of robots around. The thing is that humans aren't very efficient when it comes to physical labor. We generate a lot of waste heat and efficiency is typically well less than 50%. I'd imagine a robot powered by electricity would be way more efficient (just like EVs are more efficient than ICE cars). But let's assume pessimistically that each robot uses 4 times as much energy as the typical human, or about 8kWh per day. If the robot army is a billion strong, that's about 8TWh per day in energy consumption. Current global electricity generation is about 80TWh daily, so robot energy usage would be 10% of total generation. But robots are mostly charge at off-peak hours, meaning we may not even need to increase electricity production all that much to support a billion robots. Overall, not a big deal, it seems to me.
-
Insurance Brokers (MMC, AON, AJG, WTW, BRO)
treasurehunt replied to tnathan's topic in General Discussion
Did Anthropic release a Claude insurance broker plugin? -
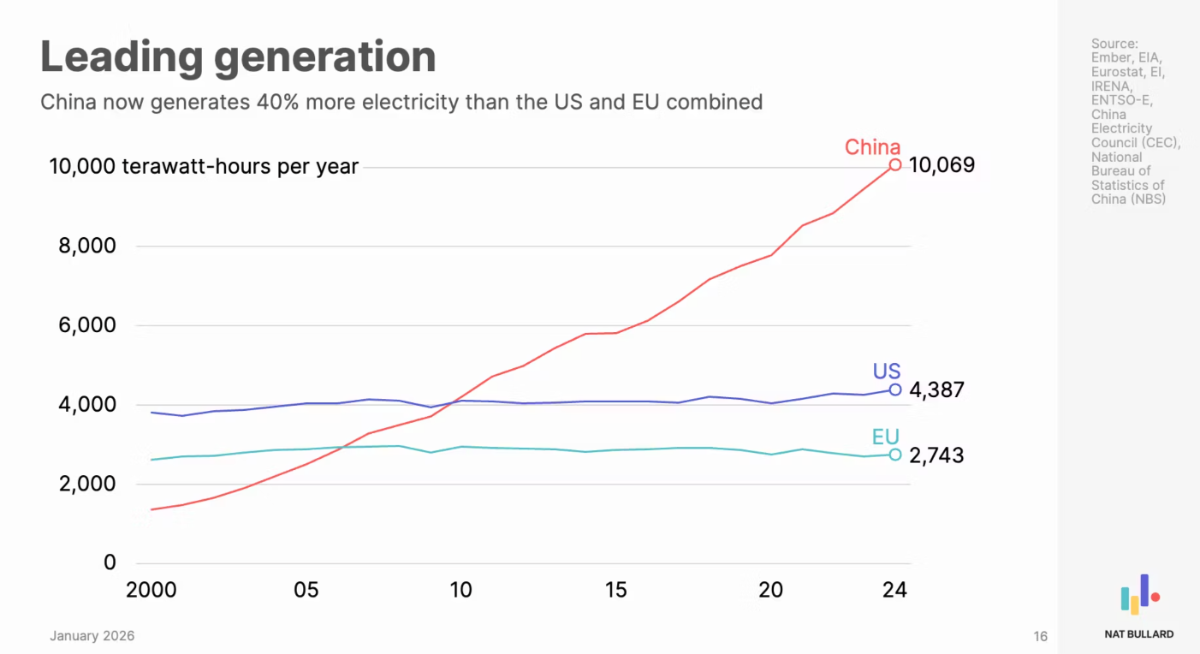
I'm sure there will be all kinds of demand for electricity in China as the country gets more prosperous, but I think gfp is right about China having a big advantage with electricity generation. Take a look at this chart from Nat Bullard's latest presentation on the state of decarbonization. Btw, the entire 200 slide presentation is very informative. You can find the presentation here: https://www.nathanielbullard.com/presentations

-
The remaining 50% obviously did not go to zero, but it is not conservative to assume that the top 10 holdings were 50% of the portfolio. From Viking's post, total market value of the 10 holdings was $4.157B at the end of 2020 or when the position was purchased, if later. Total carrying value of all common stock holdings at the end of 2020 was $9.775B. So the 10 holdings were less than 4.157/9.775 = 42.7% of the portfolio at the end of 2020 (probably much less since 3 of the positions were purchased after 2020).
-
I think it's 22% of the Class A shares, which works out to 42 million shares or so. We already know that Fairfax owns more than that (51.5 million, according to post by @Hoodlum on Saturday).
-
No, I have your TLT pick in there. I'm using the TLT ticker to track it. At the end of the year, I assume I'll have to add the dividends paid to get the total return. Am I missing something?
-
Here's a spreadsheet tracking the board's 2026 picks: https://docs.google.com/spreadsheets/d/1nwP_YENUvs_OkKGJHpzMpjclNnY7EigWlaSp7kvkcqw/edit?usp=sharing Fairfax, Nintendo, Constellation and Coupang are popular picks. There are several more picked by at least two people. Security # Of Picks Alphabet Inc Class A 2 Amazon.com Inc 2 Comcast Corp 2 Domino's Pizza Group PLC 2 Liquidia Corp 2 Safran SA 2 Ryan Specialty Holdings Inc 2 Visa Inc 2 Cash 2 Adobe Inc 3 Brown & Brown Inc 3 Crocs Inc 3 MercadoLibre Inc 3 MGM Resorts International 3 PayPal Holdings Inc 3 Zoetis Inc 3 Coupang Inc 5 Constellation Software Inc. 6 Nintendo ADR 7 Fairfax Financial Holdings Ltd 7
-
Unfortunately not. I only compiled 2025 and 2026; I'll post the link to the 2026 sheet soon. @formthirteen has created scripts that can generate the sheets by scanning the forum threads with the picks. Maybe he can run the scripts on the threads with prior years' picks?
-
Thanks for this catch. Looks like all the exchange rates I was using for the beginning of the year (midnight of Dec 31, 2024) were off thanks to Gemini giving me the wrong values. After updating these numbers, FFH return goes up to 39%. Many picks now show higher returns - the average is over 41% and the median over 21%. What a spectacular year for the board!
-
Yes, I did miss hasilp89. I didn't add the Zegona special dividend because it is being paid in 2026, but I see that the ex-dividend date is in December, so I should have included it. Both of these errors have been corrected now. The average return moves up to 38.7% and the median to 18.5%. Your method of calculating the average return also makes sense. By that definition, I calculate that the average return is a whopping 50.3%! The median works out to 31.5%. Both numbers are way higher than I would have guessed.
-
Here's a sheet with the picks and returns. Not too many errors, I hope; the dividend column likely has mistakes though. For calculating returns, I assumed that dividends are paid out at the end. Also, I omitted Cod Liver Oil's excellent short MSTR pick, as I wasn't sure how to calculate the return on this. https://docs.google.com/spreadsheets/d/1x7GjWA6524jZG2JRvVa3qRZxYwBgZb98qjrx08AhjkQ/edit?usp=sharing Average Return 35.29% Median Return 17.69% Picks with returns > 100%. The SNDK start price is from March 15, 2025 because that's when kh812000 made the pick. Security Ticker Proponent Current Price In USD Price on 12/31/2024 In USD Dividends Paid Per Share (USD) Total Return SanDisk Corp SNDK kh812000 $244.25 $54.82 $0.00 345.55% Micron Technology Inc MU Longnose $294.37 $84.16 $0.46 250.32% Zegona Communications PLC LON:ZEG kab60 $18.37 $5.32 $0.00 245.18% Federal National Mortgage Association FNMA sleepydragon $10.33 $3.28 $0.00 214.94% Liquidia Corp LQDA whatstheofficerproblem $34.75 $11.76 $0.00 195.49% Mako Mining Corp CVE:MKO SafetyInNumbers $5.80 $2.41 $0.00 141.07% Millicom International Cellular SA TIGO jefke $55.31 $25.01 $4.50 139.14% Grupo Mexico SAB de CV GMBXF KPO $9.49 $4.69 $0.27 108.10% Heidelberg Materials AG ETR:HEI Dinar $262.80 $133.13 $3.89 100.32%
-
I created a Google Sheet with all the picks in this thread. These are the investments that were picked - so far - by at least two boardmembers. Company Votes FFH 7 NTDOY 7 CPNG 5 CSU 4 PYPL 3 MELI 3 CROX 3 ADBE 2 AMZN 2 BRO 2 CMCSA 2 GOOGL 2 LQDA 2 MGM 2 RYAN 2 Safran 2 V 2 ZTS 2 Cash 2
-
I'll pick PDD and Prosus. No idea if they'll do well in 2026, but both are good companies and likely fairly cheap.
-
Fairfax: 20% US Banks (C, JPM, EWBC, USB, GS): 20% Berkshire: 15% China (Prosus, Tencent, BABA, PDD): 12% US Tech (GOOG, AMZN, TSLA): 10% Cash: 9% Foreign ETFs (Europe, Japan, Korea, Mexico): 4% Energy (Strathcona, DVN, CNQ): 4% The rest consists of several small positions including board favorites like JOE, AMRZ and CROX. 2025 has been a good year for me. Nonetheless, I think I have way too many individual positions. I plan to pare back in 2026.
-
Yes, since you are Global Financial Partners I figured space-based cooling is not your area of expertise, but I didn't want to make any assumptions.
-
Good point. Maybe there is some wishful thinking going on here. But it's still early days, and I'm very curious to see how it all plays out.
-
Are you sure about cooling being simpler? Only radiative cooling is more effective in space than on earth and I have seen many reasonable-sounding arguments that cooling overall is actually more complicated in space. Like this post on X.
-
Me too. I'll give ChatGPT another shot when 5.2 becomes available though. Jensen Huang said in September after Nvidia announced a $100B investment in OpenAI that "OpenAI is going to be the next multi-trillion dollar hyperscale company" and "this is some of the smartest investments that we can possibly imagine". I wonder if he still feels that way.
-
Yeah, ended up being a good investment after years of stagnation early on. Now watch BYD go on to be a trillion dollar company.
-
Sold the last of my BYDDY, almost 15 years after I first bought shares in the company.
-
Buffett/Berkshire - general news
treasurehunt replied to fareastwarriors's topic in Berkshire Hathaway
Maybe because the table lists acquisitions in the last 15 years and the BNSF purchase is just outside that window? But I agree that it is somewhat misleading. -
The 15% increase is in 3 quarters, not half a year, right? So over 20% annualized. Great report, regardless.
-
Nibbled on some FRFHF. I now own more Fairfax shares than I ever have.
-
FRFHF and EWBC. I had trimmed some Fairfax in the last three to four months. I decided that was a mistake and bought back the shares I sold. I estimate that EWBC is trading at a normalized P/E of about 10. It has good management and good prospects for growth. I increased my position by 10%.