


Cigarbutt
-
Posts
3,327 -
Joined
-
Last visited
Content Type
Profiles
Forums
Events
Posts posted by Cigarbutt
-
-
13 hours ago, nwoodman said:
@Cigarbutt The RBC weightings are... important and I simply don’t have a way of checking them. Assuming the following I get a very healthy RBC ratio of 627% currently and if I run that down to a still conservative 400% then I get an answer of $7.4bn that could go from treasuries to equities. I think the answer lies somewhere in that range $2bn-$7bn. So perhaps the analyst is roughly right at $4bn. The reason I am also interested is Fairfax’s capacity to fund some or all of IDBI if that comes to pass...
Interesting.
FFH, when compared to peers, for float investments, is more of a return (risk) seeker. Rating agencies would probably be more flexible these days because of more recent positive and consistent underwriting performance but i wonder if the high level of financial flexibility that you suggest is there (assuming FFH would want now to switch funds from bonds to a compelling equity or equity-like opportunity). i remember the days when Northbridge and OdysseyRe were minority privatized in order to get some flexibility and can't help notice that several subs are still characterized by non-controlling interest sold to "financing" partners. Why would this be the case now if there was such excess capital available?
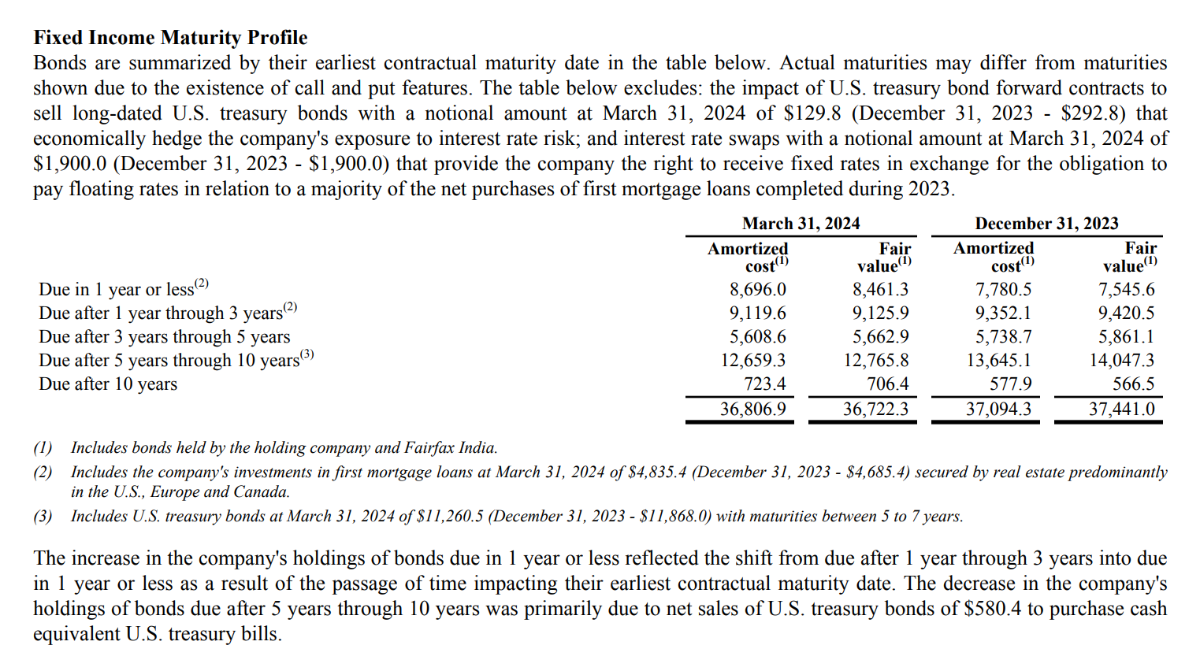
In the 2023 AR, they mention that Northbridge has an MCT of 255% and most other subs (apart from TIG and run-off) have a 320% RBC. These numbers don't include the dividends sent to parent in Q1 2024.
Anyways, if interested, there's this note from CIBC which contains some relevant material for this discussion, including a case study describing the cost to MCT when switching funds from low return (low risk) securities to higher (expected) return (higher risk) securities:
Capital-efficient investing for property & casualty insurers (cibc.com)
-
4 hours ago, nwoodman said:
...This is a quick follow up in relation to a question that was posed in the Q1 24 Conference call regarding the potential to rotate into equities from the fixed income portfolio during a market sell off.
Unusually busy day for me today so i didn't spend the time your post deserved but i'm wondering if there is a problem with the effect of funds reallocation on regulatory capital.
Since you refer to GPT, here's a screenshot from Perplexity with info to ponder on, us (still) humans:

-
5 hours ago, Paarslaars said:
Haha so at 36 I am up for the next 20 most unhappy years of my life...
Funny but that unhappy age category is also the age when people have kids and have to work
The contrarian in me says to look for mitigating factors.
The following is from the UK but is representative of what's going on in the US, Belgium and other 'developed' nations:
i will leave you with the following questions though (chicken/egg type of dilemma):
-Are married/partnership people more likely to be happy?
-Are happier people more likely to be married/partners?
-
2 hours ago, nwoodman said:
Thanks @Cigarbutt
That was very helpful to kickstart my thinking. Ultimately the management at FFH has their arms fully around this. However it prompted me to give your numbers a revisit and also do some quick and dirty numbers of my own
Key point
Statutory requirements for insurance companies typically include risk-based capital (RBC) ratios, which measure an insurer's capital adequacy relative to its risk profile. In the United States, the National Association of Insurance Commissioners (NAIC) recommends a minimum RBC ratio of 200%. In Canada, the Office of the Superintendent of Financial Institutions (OSFI) requires a minimum Minimum Capital Test (MCT) ratio of 150%.
Assuming Fairfax maintains a conservative RBC ratio well above the minimum requirements (e.g., 300% or higher), the company might have some flexibility to reallocate a portion of its bond portfolio to equities during a market sell-off. However, the exact amount would depend on various factors, such as:
- The overall capital position and RBC ratios of Fairfax's insurance subsidiaries
- The liquidity and credit quality of the bond portfolio
- The expected impact of the reallocation on the company's risk profile and capital adequacy
- Regulatory restrictions and approval from the relevant insurance regulators
Rerunning your numbers - we must be calculating different things
Using the ratio of the company's cash and fixed income float portfolio over its insurance float reserves as a proxy for the Minimum Capital Test (MCT) ratio is an interesting approach, but it has some limitations and may not provide a fully accurate representation of the company's capital adequacy.
The insurance float represents the funds generated by insurance operations that an insurer can invest until claims are paid out. Fairfax's float primarily consists of the following components:
- Insurance contract liabilities: $45,918.1 million as of March 31, 2024
- Insurance contract payables: $1,065.0 million as of March 31, 2024
The cash and fixed income float portfolio includes:
- Holding company cash and investments: $2,496.4 million as of March 31, 2024
- Subsidiary cash and short-term investments: $7,801.6 million as of March 31, 2024
- Bonds: $36,131.2 million as of March 31, 2024
Calculating the ratio:
(Cash and Fixed Income Float Portfolio) / (Insurance Float Reserves) = ($2,496.4 million + $7,801.6 million + $36,131.2 million) / ($45,918.1 million + $1,065.0 million) = $46,429.2 million / $46,983.1 million = 0.99
This ratio of 0.99 suggests that Fairfax's cash and fixed income float portfolio is nearly sufficient to cover its insurance float reserves. However, it's important to note that this ratio does not fully capture the company's capital adequacy for several reasons:
- It does not consider other types of investments, such as preferred stocks, common stocks, and investments in associates, which may also be used to support insurance liabilities.
- It does not account for the risk characteristics of the assets and liabilities, which are a key component of the MCT ratio calculation.
- It does not include other components of the MCT ratio, such as available capital, surplus allowance, and eligible deposits.
- It does not reflect the specific regulatory requirements and risk factors used in the MCT ratio calculation.
While this ratio provides a simplified view of Fairfax's ability to cover its insurance float reserves with liquid assets, it should not be considered a substitute for the more comprehensive MCT ratio. The MCT ratio is a risk-based capital adequacy measure that considers a wider range of factors and is specifically designed for property and casualty insurance companies in Canada.
In summary, while the ratio of cash and fixed income float portfolio over insurance float reserves can provide some insight into Fairfax's liquidity and ability to cover its insurance liabilities, it is not a perfect proxy for the MCT ratio, which is a more comprehensive and risk-based measure of capital adequacy.
Taking a stab at MCT
I take it MCT and RBC are actually confidential. Makes sense you don’t want to be giving your opposition a leg up in terms of capacity to write.
However upper level (and treat the numbers with contempt)
To calculate Fairfax's Minimum Capital Test (MCT) ratio based on the asset classes detailed in the Q1 2024 report, we will make assumptions about the risk factors associated with each asset class. Please note that these assumptions are for illustrative purposes only and may not reflect the actual risk factors used by Fairfax or its regulators.
Assumptions:
- Available Capital: We will assume that Fairfax's available capital is approximately 70% of its total equity.
- Minimum Capital Required (Risk Factors): a. Cash and cash equivalents: 0% risk factor b. Short-term investments: 1% risk factor c. Bonds: 3% risk factor (assuming a mix of high-quality government and corporate bonds) d. Preferred stocks: 15% risk factor e. Common stocks: 20% risk factor f. Investments in associates: 30% risk factor (assuming illiquid investments) g. Derivatives and other invested assets: 10% risk factor h. Insurance risk: 20% of net premiums written
Calculation:
Step 1: Estimate Available Capital Total Equity as of March 31, 2024: $27,643.5 million Assumed Available Capital = 70% × $27,643.5 million = $19,350.5 million
Step 2: Estimate Minimum Capital Required
a. Cash and cash equivalents: $7,023.2 million × 0% = $0 million
b. Short-term investments: $2,266.0 million × 1% = $22.7 million
c. Bonds: $36,722.3 million × 3% = $1,101.7 million
d. Preferred stocks: $2,447.8 million × 15% = $367.2 million
e. Common stocks: $7,172.5 million × 20% = $1,434.5 million
f. Investments in associates: $6,833.6 million × 30% = $2,050.1 million
g. Derivatives and other invested assets: $1,574.2 million × 10% = $157.4 million
Total Minimum Capital Required for Assets = $0 + $22.7 + $1,101.7 + $367.2 + $1,434.5 + $2,050.1 + $157.4
Total Minimum Capital Required for Assets = $5,133.6 million
h. Insurance risk:
Net premiums written (Q1 2024): $6,249.3 million
Annualized net premiums written = $6,249.3 million × 4 = $24,997.2 million
Risk factor for insurance risk: 20%
Minimum Capital Required for Insurance Risk = 20% × $24,997.2 million = $4,999.4 million
Total Minimum Capital Required = $5,133.6 million + $4,999.4 million = $10,133.0 million
Step 3: Calculate the MCT Ratio
MCT Ratio = (Available Capital) / (Minimum Capital Required)
MCT Ratio = $19,350.5 million / $10,133.0 million MCT Ratio = 1.91 or 191%
Based on the asset classes detailed in the Q1 2024 report and the assumed risk factors, Fairfax's estimated MCT ratio would be approximately 191%. This suggests that the company would have sufficient available capital to cover the assumed risk exposures associated with its investments and insurance operations.
However, it's crucial to reiterate that this calculation is based on illustrative risk factors and limited information from the Q1 2024 report. The actual risk factors used in the MCT calculation would be determined by the regulatory guidelines and the specific characteristics of Fairfax's assets and liabilities. Additionally, the MCT ratio is a comprehensive measure that considers various other risk factors, such as interest rate risk, foreign exchange risk, and operational risk, which are not captured in this simplified calculation.
In summary, while this calculation provides a more granular estimate of Fairfax's MCT ratio based on the asset classes reported in the Q1 2024 report, it remains an illustrative example based on assumed risk factors. The actual MCT ratio would need to be determined using the specific regulatory guidelines and a more comprehensive risk assessment of Fairfax's operations.
Equity Reweighting
To determine how much could be reallocated from bonds to equities while maintaining a conservative approach, we will target an MCT ratio of 200%, which is comfortably above the regulatory minimum of 150%. We will also assume that the risk factors for the other asset classes and insurance risk remain constant.
Given:
- Current MCT ratio: 191%
- Target MCT ratio: 200%
- Current bond allocation: $36,722.3 million
- Risk factor for bonds: 3%
- Risk factor for equities: 20%
Step 1: Determine the excess available capital at the target MCT ratio
Target Minimum Capital Required = (Available Capital) / (Target MCT Ratio)
Target Minimum Capital Required = $19,350.5 million / 2.00 Target Minimum Capital Required = $9,675.3 million
Excess Available Capital = (Current Minimum Capital Required) - (Target Minimum Capital Required) Excess Available Capital = $10,133.0 million - $9,675.3 million Excess Available Capital = $457.7 million
Step 2: Calculate the amount that can be reallocated from bonds to equities
Reallocation Amount = (Excess Available Capital) / (Difference in Risk Factors)
Difference in Risk Factors = Equity Risk Factor - Bond Risk Factor
Difference in Risk Factors = 20% - 3% = 17%
Reallocation Amount = $457.7 million / 0.17 Reallocation Amount = $2,692.4 million
Therefore, based on the assumptions and the target MCT ratio of 200%, Fairfax could reallocate approximately $2,692.4 million from bonds to equities while maintaining a conservative capital position.
After reallocation:
- Bond allocation: $36,722.3 million - $2,692.4 million = $34,029.9 million
- Equity allocation: $7,172.5 million + $2,692.4 million = $9,864.9 million
It's essential to note that this calculation assumes that the reallocation would not impact the other risk factors or the available capital. In practice, any significant changes to the investment portfolio would need to be carefully analyzed to assess their impact on the company's overall risk profile and capital adequacy.
Furthermore, it's crucial to consider that this reallocation is based on a static view of the MCT ratio and does not account for potential changes in market conditions, asset valuations, or insurance risks over time. Any reallocation decisions would need to be made in the context of Fairfax's long-term investment strategy, risk appetite, and regulatory requirements.
In summary, based on the conservative target MCT ratio of 200% and the assumed risk factors, Fairfax could potentially reallocate approximately $2,692.4 million from bonds to equities. However, this calculation is for illustrative purposes only and does not consider the dynamic nature of capital adequacy or the specific factors that may influence Fairfax's investment decisions.
Final Take
So after all that and probably too many assumptions, and no doubt some AI hallucinations, the answer is 2.7 bn. i.e not much and below the $4bn the questioner suggested.
-The 2.7B may be the right number and looking at this from several perspectives does help.
-If interested look at FFH's 1990, 1991 and 1992 (much smaller insurance operation then) and see their equity exposure relative to capital...
-The reference to BRK and the "ratio" is because it's a simple measure and easy to compute. At BRK, there is probably an embedded margin of safety which may be an adequate reference given FFH's past history during some transitions (many episodes requiring selling stock below intrinsic value, reaching for a line of credit etc).
-The numbers about float need to take into account the definition of float as mentioned in FFH's annual reports: "Float is essentially the sum of insurance contract liabilities and insurance contract payables, less reinsurance contract assets held and insurance contract receivables, on an undiscounted basis excluding risk adjustment." So you need to subtract reinsurance contract assets (among other less important adjustments) to calculate float.
-Questions and comments
-i guess the idea is to (sell high and buy low) switch funds when equities become available at lower prices. If this idea applies, then the value of those regulatory measures become relevant ie they require a margin of safety. But then, you need a dynamic picture as bonds assets (including mortgage loans) can get downgraded or even default and other equity instruments (including the very significant total return swap on its own stock) can lose value. These changes impact regulatory capital to a very significant degree.
-As a concept, moving funds from bonds (lower risk-weight) to equities (higher risk-weight) should impact negatively the MCT ratio. Why not in your example?
1 hour ago, Haryana said:I know nothing about this but looking at it logically, why would this ratio go up in a downturn. When those risky assets are either in a down marked or forcibly marked down, their dollar amount will go down and, therefore, their proportion compared to the rest of the assets will go down and thus risky assets ratio going down may improve rating.
You are right, this was not well phrased. The risky assets ratio is an indicator of potential future capital impairment. In a downturn, the risky asset ratio may go up if for example many bonds held get downgraded (have a higher risk weighting) or if unimpaired equities become impaired but the ratio may go down as a result of what you describe or if the company sells risk assets and fly to safety. However, when starting with a high risky assets ratio, the risk of capital impairment (including regulatory capital impairment) is higher, which is why FFH is close to the BBB category, a riskier posture for an insurer.
-
On 5/5/2024 at 5:57 AM, mattee2264 said:
...expansionary fiscal policy when the economy is at full employment is inflationary.
Will be interesting to see how this plays out.
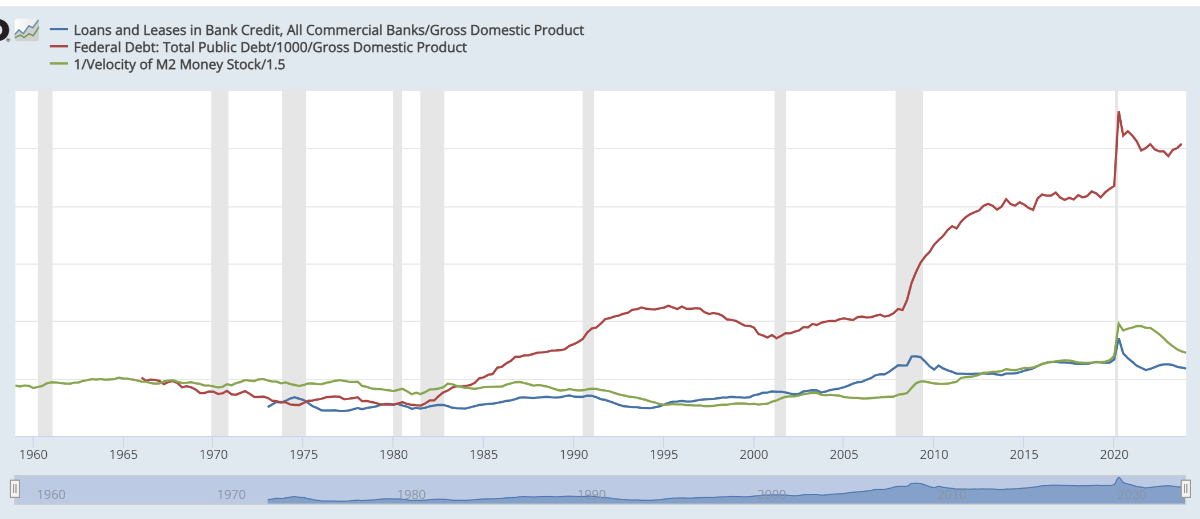
There was this person in the 50s (trying to understand WW2 money supply dynamics and the relative absence of runaway inflation that was felt to be secondary to price controls and others) who compared the combination of monetary and fiscal policy to the handling of a kite (with demand being the wind). There was this assumption that stabilizers (automatic and to be created) could always and effectively maintain some kind of wind,
Interesting, indeed (opinion).
-
On 5/3/2024 at 9:25 PM, nwoodman said:
Just got done listening to the CC. Great notes above by all. A couple of things that caught my attention
...
3. A shame that the last question got cut off on the amount that could be reallocated from bonds to equities in a market sell off. It would be nice to get an idea of the number. They have been pretty clear that it would be a move from treasuries to corporate debt but any further capacity for equities would have been an interesting insight.
There are many ways to guess and each market transition comes with its own flavor.
Using some kind of float coverage ratio concept, one could come up with a theoretical "number".
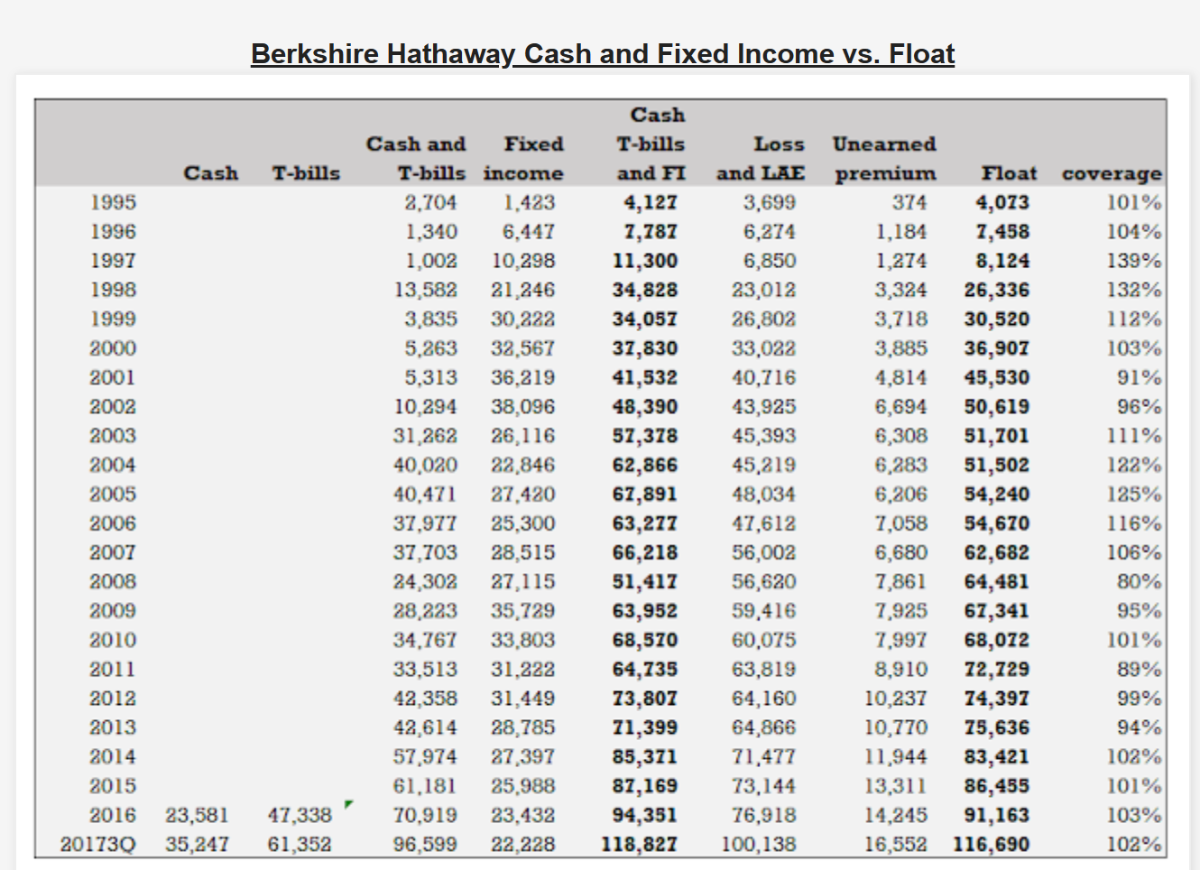
Using cash and fixed income float portfolio over insurances float reserves, for example, for BRK, the ratio was 106% at end of 2023 and 112% at end of Q1 2024. During various opportunistic times in the past, this coverage ratio for BRK went slightly below 100%, even close to 90% for relatively short periods. For FFH, this ratio (slightly apples to oranges comparison with the mentioned ratio in this post, slightly overestimating the FFH coverage) was 131% at end of 2021, 127% at end 2022 and 130% at end 2023. In theory, FFH could sell about 25% of its bond portfolio in order to buy any assets (including equities).
-----
Yogi Berra said (apparently) that, in theory, there is no difference between theory and practice but, in practice, there is. Mike Tyson also had a similar theory related to what could be done when punched in the face.
-----
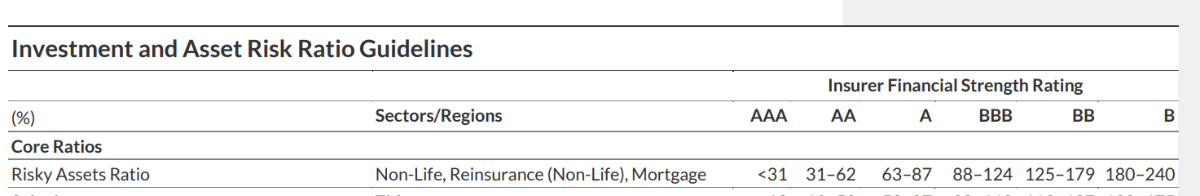
So, in practice, the limiting factors would be coming from regulators and from rating agencies. In a downturn, many present equity and equity-like holdings held by FFH would go down also and regulators would apply a risk-based capital haircut to risky assets (held and to be acquired). For the rating agency, using Fitch as an example who recently released an update, at end of 2023, the risky assets ratio is already at 85%. In a downturn, even absent any "tactical" asset allocation move by FFH, this ratio would tend to go up...towards BBB which makes it uncomfortable to write new insurance business..
Fitch Revises Fairfax's Outlook to Positive; Affirms Ratings (fitchratings.com)
Fitch uses (and publishes) a relevant table:
FFH has been known to be unusually creative during transitions (in the spectrum from survival to capacity to benefit from opportunities) but (opinion) the capacity to move float funds from fixed income to equity would be limited, much much less than 25% of their fixed income portfolio.
-
3 hours ago, CanadianMunger said:
I love Warren but the size of this cash pile is...Indefensible
3 hours ago, gfp said:Just call it a "bond portfolio" and debate his decision on duration instead. If he put half of it in 2 year notes nobody would complain.
Whether it's conscious or not, planned or not or whatever, over the years, there has been some defensible movements of the fixed vs float quantity/duration balance.
Using this methodology, at Q4 2023, the ratio was 106%, at Q1 2024, 112%.
Even if there is some kind of rationality (relative lack of equity opportunities at reasonable prices), it's sometimes hard to differentiate tactical asset allocation from market timing.
-----
i would say this aspect is also relevant for people wondering (on the FFH threads) how much money could be shifted from bonds to equities in certain circumstances.
-
11 hours ago, gfp said:
Did everyone else hear average duration of 2.8 years on the fixed income portfolio? I heard yield of 5% as well. If I heard correctly on duration it seems like they tactically shortened again.
edit: I also heard duration of about 3 at the end of the call. 2.8, if I heard correctly might include cash and bills and 3 might be just the "bond portfolio."
This well explained in the interim report:
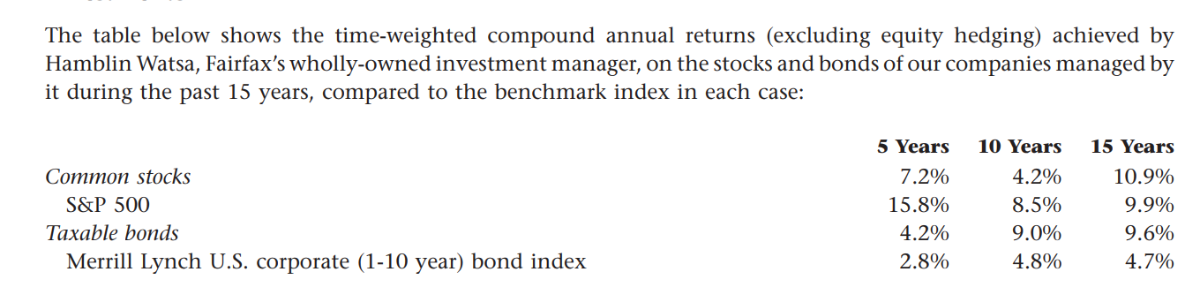
FFH used to report their relative bond performance (last time from 2017 annual report; from memory this did not even include the CDS swap gains which imo were sort of bond investments):
Since then, (guess to some degree) it appears that their relative total return bond performance has come down, with relative coupon income performance improving. FFH has had (at least up to 2016-7) an unusual capacity to harvest alpha-type capital gains in bonds, especially during "transitions". Those capital gains have been (at least up to 2016-7) lumpy but incredibly significant given the high (sort of leveraged float portfolio) exposure to bonds versus equity. Maybe this isn't so relevant anymore?
What is the difference between tactical asset allocation and market timing?
-
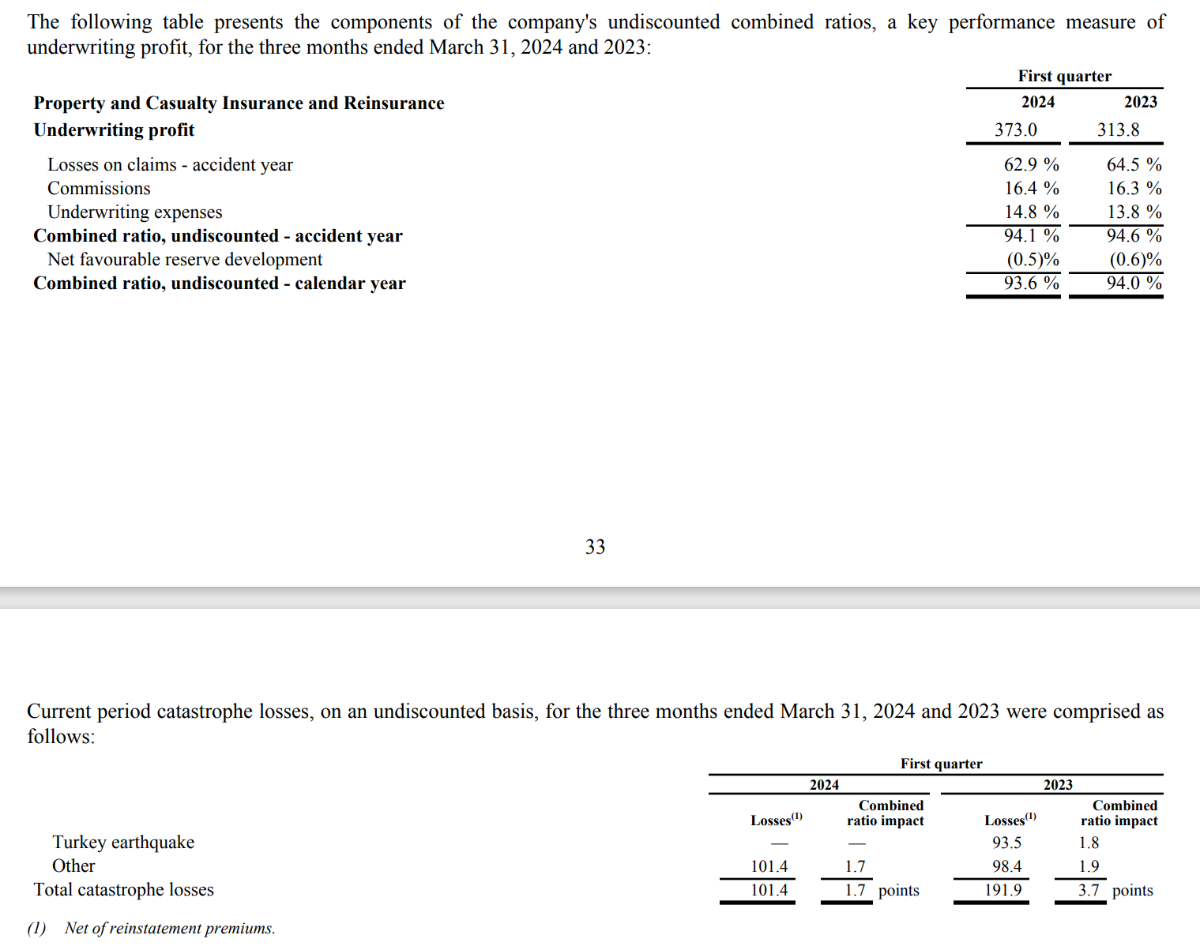
For the Q1 underwriting side, short term volatility prevents meaningful conclusions about underlying trends. Numbers show a slight deterioration and this will be followed.
For Q1 of 2022, 2023 and 2024, the underlying AY undiscounted CR ex-cat shows: 90.8, 90.9 and 92.4.
These numbers exclude run-off (short term volatility even more significant here) and in Q1 2024, they report about a 1% favorable reserve development.
There is an expectation that FFH will continue to perform better than comparable peers on the underwriting front.
-
On 4/29/2024 at 3:41 PM, Viking said:
...
What will it cost Fairfax to take out OMERS and what will the accounting look like?
I am not sure how the accounting will work when Fairfax takes OMERS out. When Fairfax bought a chunk of Allied World back in 2022 there was a sizeable write down to equity (see quote below). Perhaps we see something similar here. Do other board members have thoughts?
From Fairfax’s 2023AR: “On September 27, 2022 the company increased its ownership interest in Allied World to 82.9% from 70.9% for total consideration of $733.5, inclusive of the fair value of a call option exercised and an accrued dividend paid, and recorded a loss in retained earnings of $163.3 in net changes in capitalization in the consolidated statement of changes in equity.”
The value of the call options for Fairfax at Dec 31, 2023: In ‘Other Assets’, the value of ‘call options on non-controlling interests’ = $306.6 million (2022: $167.4 million). This total is for Brit, Allied World and Odyssey. See quote below for more information.
From Fairfax’s 2023AR: “Comprised of call options on the non-controlling interests in Allied World, Brit and Odyssey Group, which expire in 2026, 2027 and 2029, respectively. At certain dates subsequent to expiry of a call option, the non-controlling interests may request an initial public offering of their shares, the structure, process and timing of which will be controlled by the company; in certain circumstances, the non-controlling interests may request a sale of the respective operating company to a third party.”
...
On this Board, some work had been done in FFH's threads concerning the first round of Brit's sale and then re-acquisition of a minority interest.
-----
Summary (From Feb 15th 2021):
Taking OMERS' perspective as FFH contributed capital and assigned its own dividends to Brit (all numbers in USD)
Summer 2015: OMERS (buys) pays 4.30 per share for 120M shares (29.92% interest), with a shareholders' agreement stipulating an annual dividend at 0.43 per share. Total 516.0M
In 2016: OMERS (sells) gets 4.30 per share for 13.449M shares, 57.8M
In 2018: OMERS (sells) gets 4.30 per share for 58.551M shares, 251.8M
In 2020: OMERS (sells) gets 4.30 per share for the remaining 48.000M shares, 206.4M
Total re-sold = 120M shares for 516.0M getting yearly 0.43 US cents per 4.30 USD share along the way.
So effectively a post-tax financing rate of 10%. For some time, this didn't seem to make much economic sense but...eventually it did?
Note: This line of thinking required some work in both FFH's and Brit's various filings. The numbers are clear about the price paid and the prices received by OMERS, showing how these co-investors' transactions are of the financing type. For the 10% yearly 'dividend' rate, some inferences need to be made but (opinion) the inference is likely right.
Note: This type of work was not quite straightforward and the application of IFRS accounting has made it (at least for me) much more byzantine.
-----
Based on the above, what about the 'cost' to re-acquire Brit's minority interest.
Short story: there is a lot of IFRS-related accounting noise but, in substance, FFH will likely buy back the minority interest at the price for which it was sold (fixed price), with a fixed dividend rate along the way.
-----
The following is based on hunch as much as knowledge so feel free to improve.
With IFRS, selling a minority interest is considered an equity transaction and transaction gains of the revaluation type have to be recognized (as well as a non-controlling revalued interest). For FFH, this comes with a call option to buy back the non-controlled interest (at a fixed price) which appears to be treated like a derivative asset with a value taking into consideration the changing value of the non-controlled interest which, itself, is influenced by the NCI's share of earnings. So, my understanding is that the call option value will tend to increase over time based on the subsidiary's positive income and this will be recognized in net income (and retained earnings) at the parent level from the financial asset gain. But this is not really an economic gain and it looks like the way to deal with this from an accounting point of view is to deduct this financial gain (reduced income and reduced retained earnings) when the call option to buy back the minority stake is exercised.
Short story (opinion): this accounting noise is just that.
-
14 hours ago, blakehampton said:
I was reading BRK shareholder letters when I had a thought:
Since unrealized investment gains are now included in net income, wouldn’t that mean that the S&P 500’s EPS is overstated? Buffett has repeatedly explained since 2017 how Berkshire’s reported net income isn’t actually representative of its earnings. In a rising market, wouldn’t this then have the same effect with the S&P? It’s sort of hard to wrap my head around but I feel like appreciation in stocks generally would then show up in the earnings of companies.
Edit: The change was ASU 2016-01
Interesting.
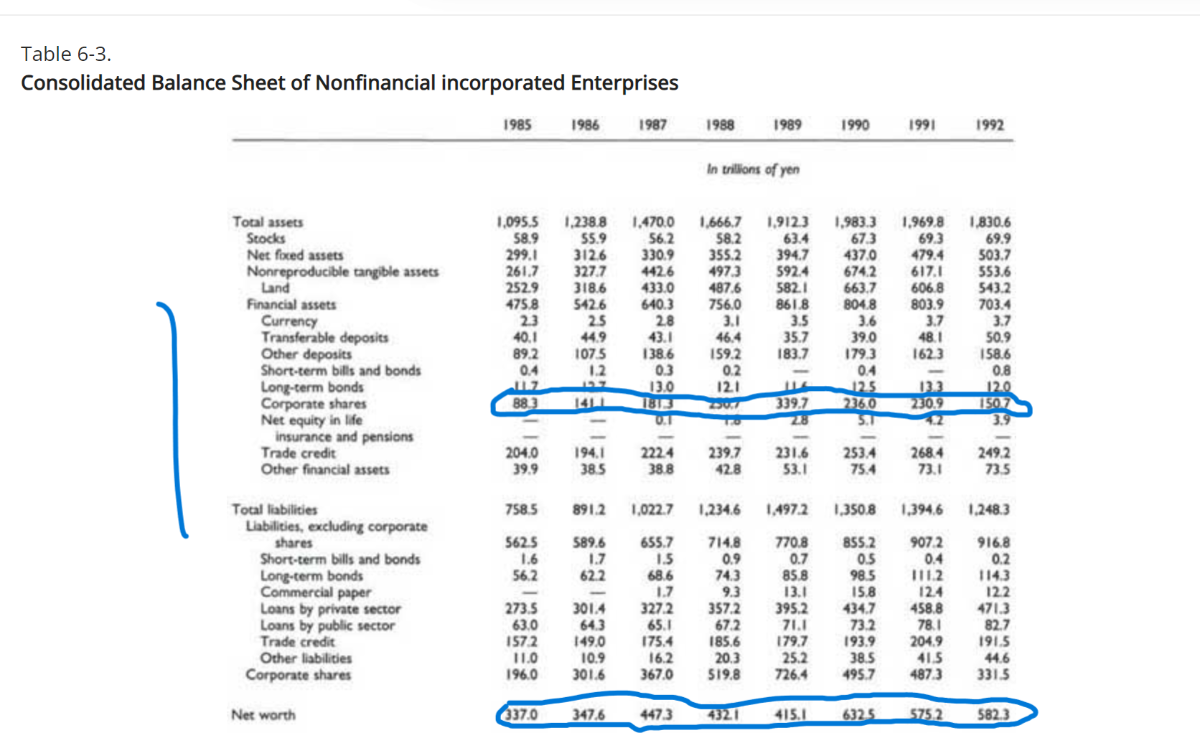
In Japan (see below), during a certain period, there was a growing trend (increasing corporate cross-holdings in a rising market):
For the US, this time is different because the level of corporate cross-holdings is low. In your great country, the trend is for the rising market to be held by the top 1% and "foreigners".
-
11 hours ago, Dinar said:
I think the big risks are the northeast wind that Prem referred to (what is that by the way?), general major catastrophe - say massive earthquake in NY?
-Attempt to answer this question, a reference to investment performance and another question
The reference may be related to wind risk in the Northeast USA (it's tricky to refer to this risk as there may be climatic repercussions...i found the picture below which is climate-agnostic):
i know that a "roughly" 1% exceedance probability is nothing to be excited about for the typical human but, when reading human recollections of such events in the New England area during the past century, people describe unexpected change with sunny skies changing to some kind of roar. People who tell these stories had either foresight or were simply lucky.
Opinion: FFH is relatively well positioned for such event but who really knows?
-----
Opinion: To explain FFH's stock value outperformance over the last 38 years by referring to "leverage in a bull market" is likely a (over) simplification. They used to compare (in older annual reports, in the CEO's section) their relative investment outperformance compared to bond indices and large stock indices and the results were impressive (Graham-Doddsville type), a good thing because their underwriting performance was really terrible, then).
-----
Opinion: There is a short supply of discussion on the evolution of their investment stance (apart from sparse and intermittent mention of the cost part related to their previous posture). They used to position their portfolio in order to withstand a similar 1% exceedance probability event, a protection against the general markets not just wind but who cares these days?
-
14 hours ago, UK said:
Is it fair to conclude that their duration of insurance liabilities decreased quite substantially in last six years, from this info bellow?
This line of reasoning raises the possibility that one comes to an incorrect conclusion.

The first issue is that float is based on net (not gross) insurance reserve liabilities (when premiums are ceded to another party of the reinsurance type so is the "float"). In 2017, FFH retained 81.8% of gross premiums and in 2023, 78.6% of gross premiums. So this partly explains why the growth in float was slower than the growth in gross premiums and is an issue unrelated to the "duration" of insurance liabilities.
The second and more important issue is more conceptual (and even mathematical). To assess the validity or signal when comparing the growth of premiums and float, one would have to assume some kind of steady state (for example, constant growth over time). Think of an insurer which decides to significantly curtail new business or even move to run-off. Then the negative growth in gross premiums would happen faster than the decline in float because of the lag effect and the shape of the payment distribution over time, an issue not linked to a change in the "duration" of insurance liabilities.
Recently, FFH has grown ++ the gross premiums component:
The relative float growth will catch up over time especially if the growth in gross premiums written settles down (it's just a timing issue at this point) and this temporary decoupling is essentially unrelated to a hypothetical change in the "duration" of insurance liabilities.
One way to support the above is to observe, over time, the composition and distribution of the insurance product lines. This appears to be quite constant. On a recent conference call, the CFO mentioned an insurance liability duration of 3.8 years and i would suggest that this duration hasn't changed much in the last few years.
-----
Reading the above, i'm not sure it makes sense? Being simple minded (thinking along first principles is above my capacity), i always try analogies. So, for example, if you try to be more friendly to others around you, eventually, people around you will become more friendly to you (no guarantee of course) but there is a lag effect and your rate of growth of being nicer to others will precede the rate of growth of others being nice to you. The opposite obviously can occur but there may be a lag effect in the other direction as well due to the accumulation of social capital. Makes sense?
-
7 hours ago, jfan said:
Thanks @Cigarbutt and @Tommm50 for your replies and insight. The idea of writing policies in a soft market with just adequate pricing (with the expectation of some adverse loss developments) when there are good opportunities to use those premiums to invest in their portfolio for more attractive returns was helpful.
Spending the morning watching videos on insurance triangles, paid/case reserves/incurred but no reported, basic methodologies to estimate of IBNR to derive loss reserves (case reserves + IBNR), and how to interpret loss development trends was particularly stimulating.
Looking back at the 2 tables that I posted. A few amateur observations were made:
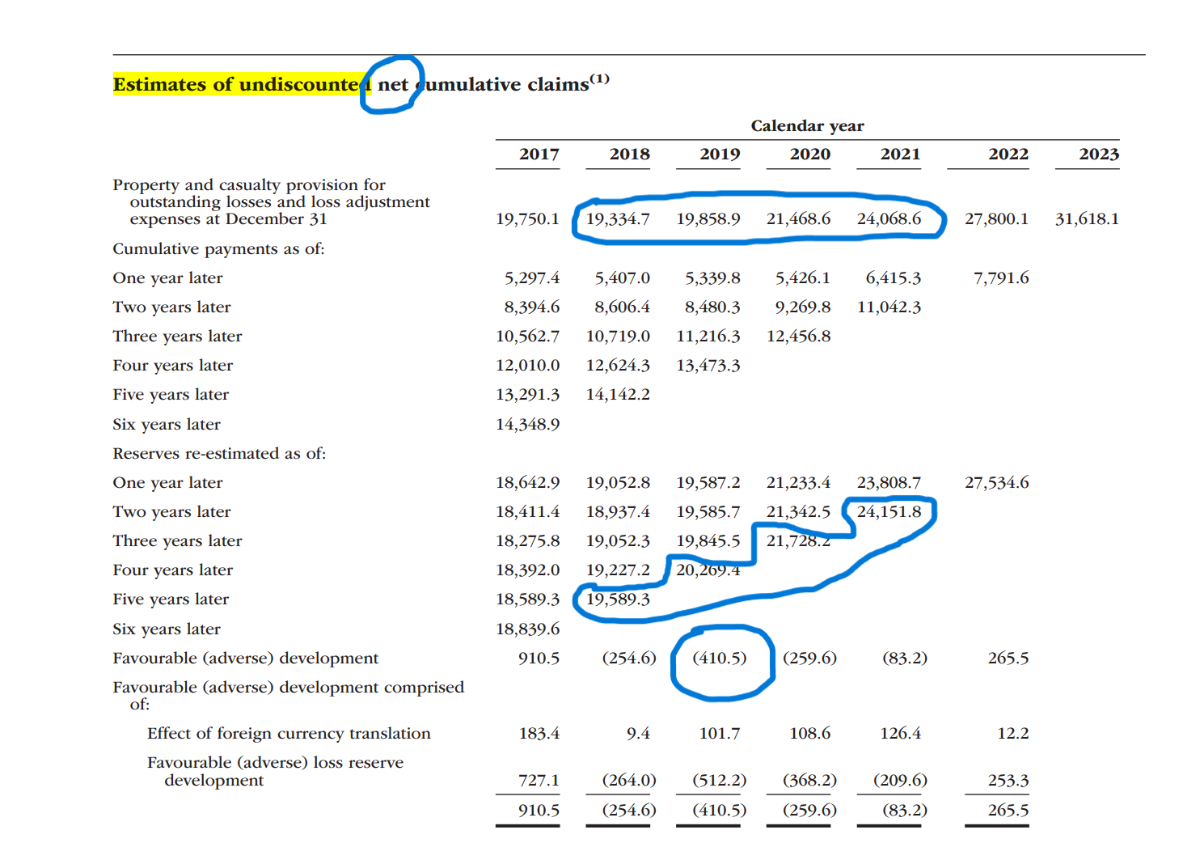
1) looking down the columns for each calendar year:
a) It appears that ~ 70% of cumulative paid losses occur within 6 years (6-year cumulative payment divided by 6-year re-estimated reserves)
b) Unfortunately, they don't report the entire table in 2023 AR, in the 2022 AR, after 8-9 years, the proportion of cumulative payments is mid-to-high 70% of re-estimated reserves). This suggests to me a fairly long-lag of actual payout to claimants. I'd assume this is because of the longer-tail nature of their specialty insurance focus.
c) Eyeballing the re-estimated reserves down each calendar year, there is little variability year-to-year as time goes by, within ~ $500 M at most up or down (in the range of $100 - 300 M most the time). Coupling what was said earlier about the soft market, it seems that there is not much pricing power, or too much social/judicial/cost inflation to be able to adjust reserves in a favorable manner.
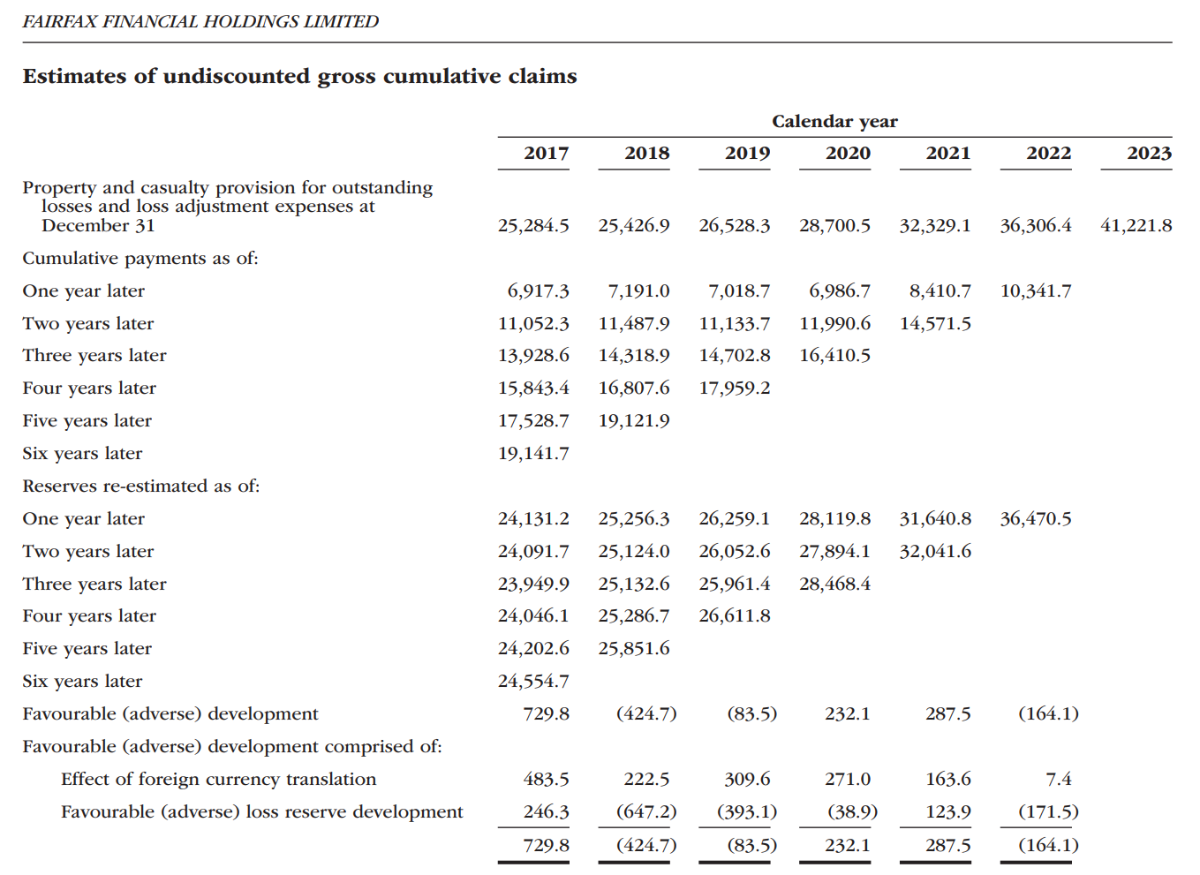
2) Looking at the diagonals for cumulative payments (gross table, not net)
a) The sum of diagonal (latest) minus the sum of the diagonal (previous year) = the payment made for losses in the most current calendar year. Using the 2022 AR, they paid out $25.5 B and had a final year end reserve of $38.3 B (ie ~ 66% or for every $1 of reserves set aside, they paid ~ $0.66 that year). Using the 2023 AR (which of there are only 6 years), they paid out $28.1 B and had a final year end reserve of $41.2 B (ie ~ 68%). This seems to me that their baseline underwriting assumptions are that 2/3 of their reserves will be paid out ~ 6 - 9 years.
I have not compared to their prior years nor other insurance companies, but is this in the opinion of the experts here, conservative?
I would imagine that if their underwriting deteriorated and they were not re-estimating their reserves properly, then these ratios should deviate from their baseline over time. I think this might be more useful than just looking at the reported magnitude of adverse/favorable loss reserve developments which is more retrospective than prospective.
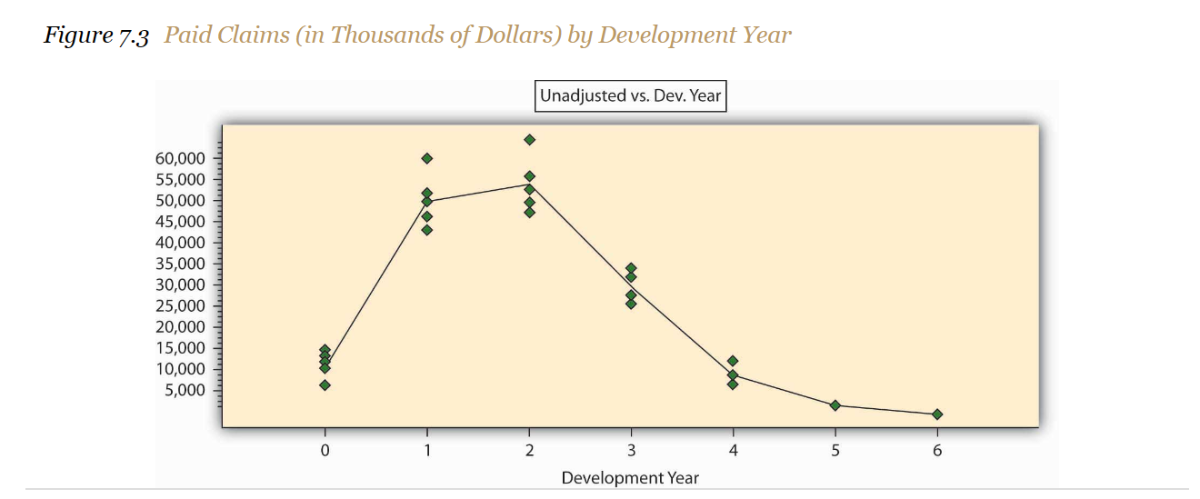
The prospective measure you're looking for may be an elusive goal. The diagonal measure you describe could reveal some info but IMO not more than the current accident year combined ratio and the ratio you compute could be influenced by recent growth in premiums written which, in itself, would increase the ratio as the payment curve is not bell-shaped with more payments early on and then a long tail to the right. Example:
The idea is to try, for each years and trend-wise, to identify a deviation from the expected trajectory. This is not easy and insurers may be slow to recognize developing issues. For example, look at the following which is a significant pattern that started to develop in the late 90s for medical malpractice claims:
Over time, it became clear that developing trends would become very costly. BTW, this cumulative payment curve is sort of representative for the average long-tail type of lines that FFH carries (duration and shape).
Up to 2013, FFH reported accident year reserve development and that was helpful but it's not a requirement and is no longer reported by them. It's possible to figure it out but it takes some effort.
-
10 hours ago, Tommm50 said:
I tend to think in terms of gross reserves as the overall test of reserving performance but I take your point, the net reserves are not quite as rosy. Putting the negative adverse development you cite in context of the size of the book however ($130M over 6 years, $110M leaving out the excellent 2017) being about $1M off is less than 1% of the total reserves and, in my view, pretty damn good at predicting the future.
Yes, i think this is correct.
It's becoming clear that the 2017-9 years were written with a semi-conscious expectation that premiums were insufficient to meet profit objectives and the shortfall could be compensated by investment income. In the industry, they call this cash flow underwriting and this is based on the same foundation as the need to remain fully invested at all times at the individual level.
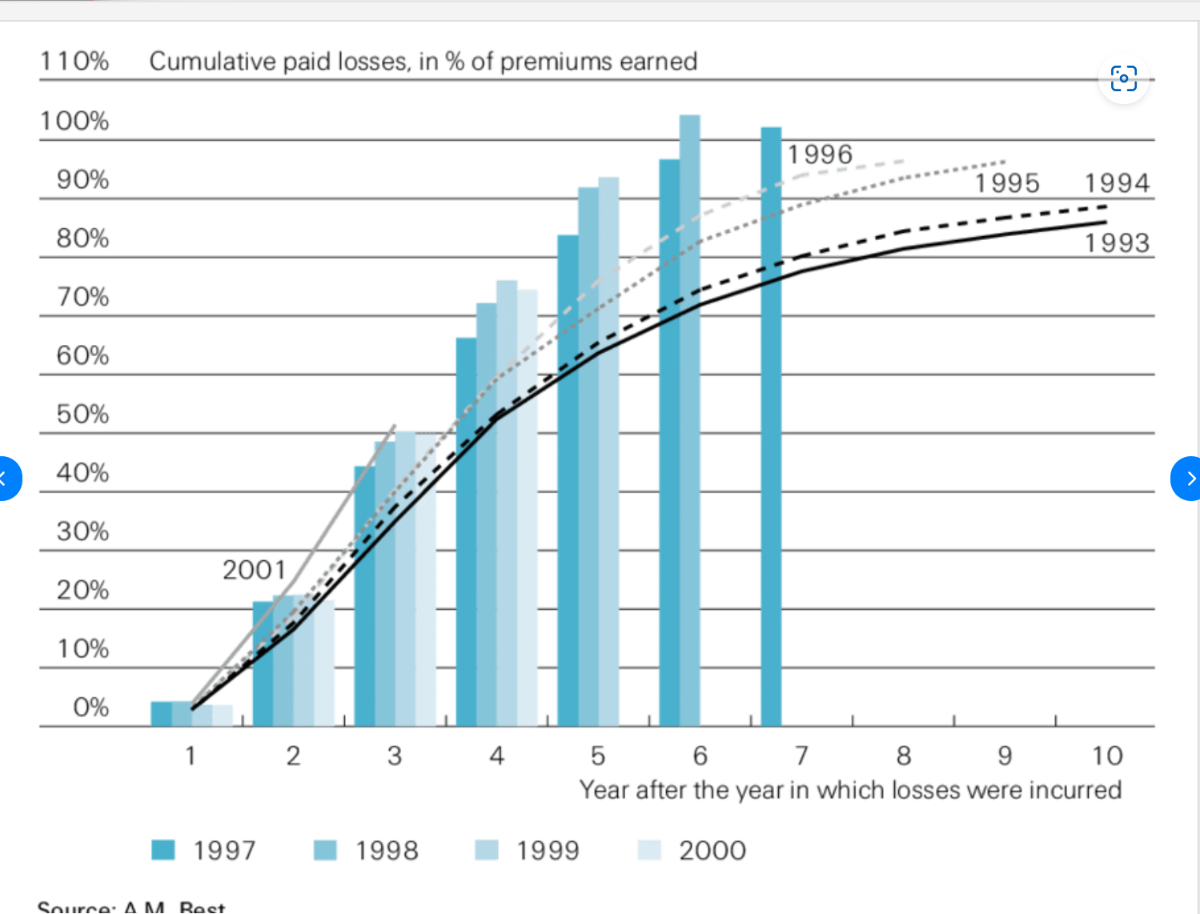
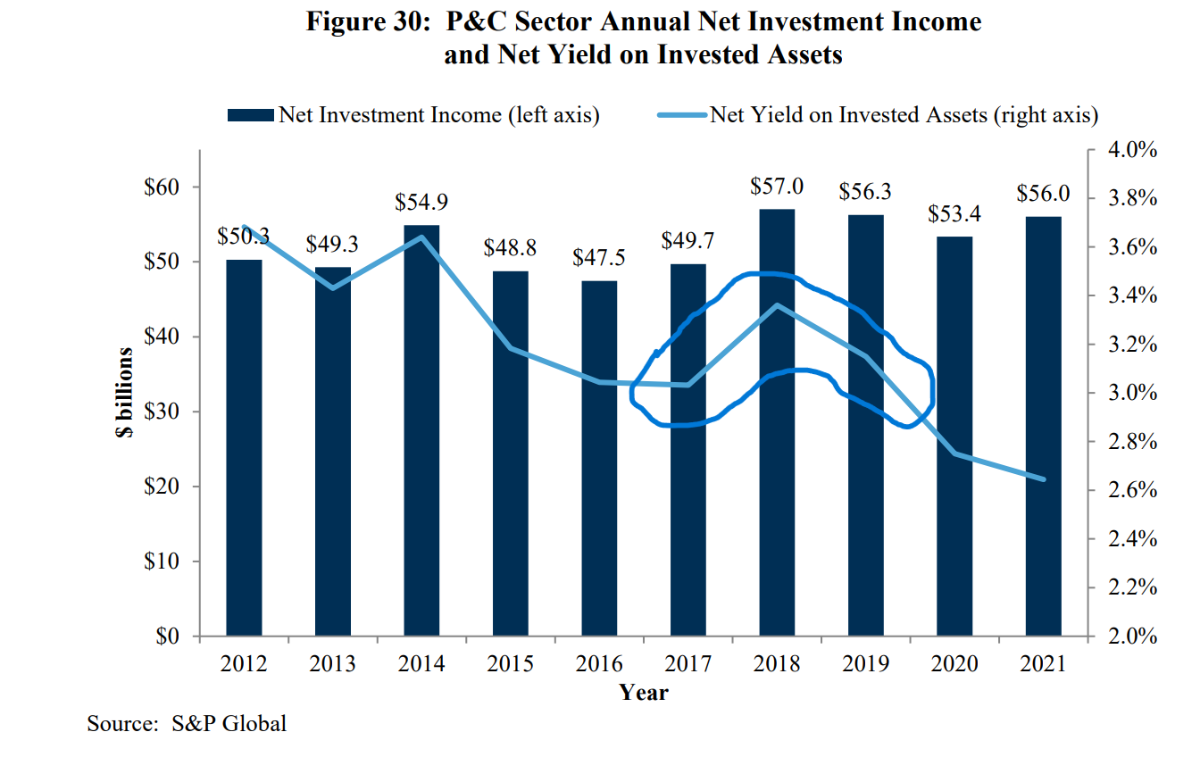
For the industry, it appears that the eventually realized underwriting losses for those years were compensated by float investment income. See the following graph showing the yield on invested assets. For the industry, add a median 0.5% per year for realized gains:
For FFH:
It's interesting to note (it's becoming clear now) that, for those years, FFH did better (relatively) than the industry both for the reserves management and the float management.
-----
Nuff said about triangles i guess. The relevant uncertain questions about the future are bound to be related to the asset side, i would venture to say, but what do i know?
-
7 hours ago, Tommm50 said:
The reserve triangles show current reserves for each calendar year are less than the original reserves put up that year except 2018. JFan may be referring to the penultimate (I don't often get to use that word) line which shows negative development for several years...By this metric only 2018 shows a modest deterioration.
If several years start to show current reserves are more than the initial reserves then that bears watching...
...Like Fairfax.
Interesting. Let's build on that using net reserves (ie where reserve development stays with the company instead of being ceded to another party):
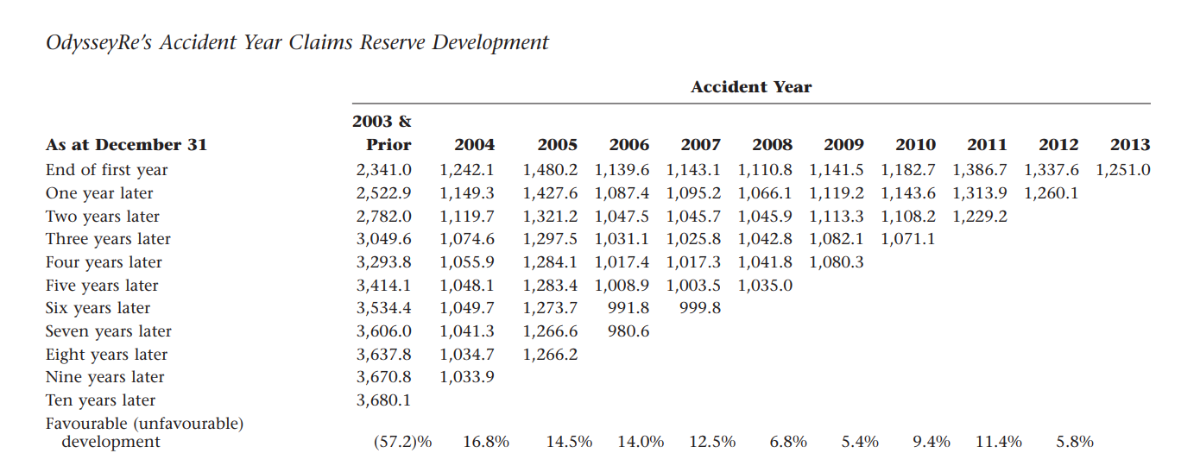
So using the same line of reasoning, FFH has reserves reported (as of end of 2023) at higher levels than initially reported for the 2018, 2019, 2020 and 2021 years. And up to the 2019 year included, the end-2023 number is 410.5 M higher than the initial estimate. Also, the adverse movement from 2017 to 2018 was 1165.1 M ((254.6)-910.5). Not exactly catastrophic and not remotely as horrific as the late 1990s and early 2000s years (Ranger (ouch!), generic Crum, nauseating TIG etc) but still quite significant. No wonder (now), the late 2010s years were ripe for hardening.
So, the same conclusion applies but (opinion) the net reserves trend smooth out significant older and softer adverse development as a result of more recent and harder favorable development.
i'd simply add that this appreciation may help to guess the kind of underwriting contribution to the ROE of future years.
@jfan, the best thing now would be that someone comes along and tries to establish an opposing view.
-
22 hours ago, jfan said:
I was just looking at their reserve triangles and it seems they are reporting a number of years of adverse developments (gross undiscounted calendar numbers). I've attached 2022's and 2023's triangle. Just wondering if someone can provide me so insight and whether this is something to watch more carefully (percentage-wise it doesn't seem to be very large relative to their policy liabilities)
Your line of questioning is quite reasonable and, since there's not much action here, i will give it a shot (btw thank you for the crypto links that you had provided after i asked a question or two in that thread).
-----
Disclosure: i have no formal training in reserve triangles but it is a fascinating topic and a relevant one for FFH and when an adolescent, i was told that i had what it took to become an actuary, an avenue not considered for various reasons including the deep desire to reach financial independence as soon as possible.
-----
-If FFH wants to reach the 15% ROE goal, a key input is the underwriting return over the complete cycle.
-Historically, despite many rational attempts to deal with this, there is the underwriting cycle and the associated (and correlated) reserve cycle that happens with a lag.
-When looking at triangles such as the ones included above, one has to remember that what happens (recognition of inaccurate reserves) in an older year will work like a domino and change all the reported numbers for the subsequent years. So looking at trends is important.
-----
Tentative conclusions
-Like the overall P+C (re)insurance market, FFH's numbers (and present trends revealing how wrong previously reported numbers were) reveal that the 2018 and 2019 (+ or - 2020 or even 2021) were written in quite a soft market and eventually recognized reserves have become more than the initially recognized objective for profit.
-While it is impossible to be precise, FFH continues to report overall positive net favorable development which means that the adverse development from softer and older years are more than being compensated by favorable from harder and more recent years.
-While it is impossible to be precise, FFH appears to have done better than the market in general as a result (combination of skill and luck; likely more skill than luck) of 1-focus on more specialized lines, 2-opportunistic growth ++ during hardening and maybe/likely of 3-better underwriting discipline.
-To specifically answer your question (needs to be watched carefully?), FFH has shown for some years the nonspecific strategy to be simply conservative in their reserving overall (choose the conservative side in the range given). Also, the poor years are now quite some time away and more than their typical reserve duration of around 3.8 years. In addition, if history is any guide, the more recent and significant growth in reserves during a hard market should continue to compensate and more for the net favorable development.
-Now, it's always possible that the underwriting culture has deteriorated and this may take years to figure out but i would offer a fairly substantiated opinion that this is quite unlikely.
If interested for more granular info at subsidiaries, look at the supplemental info:
FFH - Annual Financial Supplement (2023 Q4) (fairfax.ca)
OdysseyRe continues to be a star performer.
-
2 hours ago, Tommm50 said:
Looks to me like they"re flat or down each year. They have favorable development every year but one, by $200k.
Can you elaborate, especially concerning trends including what is referenced to by @jfan, from 2022 to 2023 calendar years?
-
21 hours ago, Dinar said:
@Cigarbutt, I think that there may be three other issues at play. Companies have gotten better at price discrimination/yield management software, which allows them to squeeze more revenue at 100% margin at very low and perhaps zero volume loss (airlines, concert tickets are good examples.) Companies may be more aggressive at raising pricing - look at historical price increases for aggregates for instance, and look at the last couple of years and 2024.
IT investment has also probably allowed massive cost reductions. Company like EQR are pretty explicit about it, and I am sure that banks/airlines, etc... have also cut out plenty of costs.
Thank you for the additional thoughts.
-----
On a personal level (private ventures), it's been possible to identify and benefit from (relatively) small pockets of potential margin exploitation (in my case based on complex regulations, areas of bureaucratic inefficiencies etc) but opportunities could not be considered permanent and there's always been the constant threat of real competition.
-----
The investment case for EQR (Equity Residential?) (after a 5-10 minutes review..) can be made (various tailwinds, demographic, wealth effect etc combined with an experienced and talented team) but it's not in my zone of comfort (good for you if it works out) and it's hard to discount a comparative advantage based on "tech" in this area if competition is still a thing.
Opinion: A lot of the corporate pricing power these days is from lack of competition (and access to cheap and easy money).
-
On 4/7/2024 at 1:42 PM, Dinar said:
@Cigarbutt, I would do the following:
a) Look at the most profitable companies in say 1999 and what were their EBIT margins
b) Look at the most profitable companies in say 2023 and what were their EBIT margins?
the most profitable in 2023 were probably MSFT, Alphabet, Meta which are all essentially monopolies or close to it. Also, Tech spend as a % of GDP probably doubled if not tripled since 1999, and tech companies have insane margins when well run - CRM, Intuit, etc...
Thank you for the feedback. However, the companies mentioned are not within my circle of competence.
If others can benefit (seeing the present benefit as well as the discounted value of future benefits), that's great.
-
Obituary
Daniel Kahneman obituary | Psychology | The Guardian
He followed a tortuous life path and ended up trying to tone down the noise in order to optimize "adversarial collaboration".
Why not?
-
3 hours ago, Thrifty3000 said:
FWIW - I don't think anyone has already posted this here, and I hadn't seen it before I spent time digging on MW's site today - but on the day of the last FFH conference call Muddy Waters published a list on their website of specific questions and accounting discrepancies for Fairfax (this was separate from the original report).
https://www.muddywatersresearch.com/wp-content/uploads/2024/02/Fairfax_MWQuestionsForQ423Call.pdf
One example:
"There is a $101.7 million discrepancy between what the acquirer reports paying for RiverStone, pro rata for Fairfax’s ownership, and the total consideration Fairfax reports receiving. The pro rata discrepancy grows to $335.4 million when looking at the cash consideration that CVC reported paying."
I'm not qualified/motivated to assess the legitimacy of several of the claims. But, if anything raises an actual red flag, it might be worth asking Prem/Jen for clarification at the meeting.
To help with 'clarification', the following was posted earlier in the Fairfax 2024 thread.
Hope this helps.
-
On 4/5/2024 at 9:42 AM, gfp said:
It probably obvious but of course the corporate income tax has been materially reduced as well.
Relating to the recent rise in profit margins (since 1999 when Mr. Buffett voiced his 6% 'normal profits' assumption), the material reduction in corporate taxes plays a role but there are other specific material variables,
including maybe a common denominator?
-----
Relevance for our day-to-day search for alpha?
Since 1999, where i've 'looked', most (by far) of the improvement in net margins at relevant investment opportunities have come from lower debt service costs and lower corporate taxes, not from higher margins related to what @Dinar describes ie companies that (apparently) have the intrinsic ability to obtain and maintain superior products versus simply the possibility that monopoly power has gone up because of etc etc
Maybe i'm not wired to 'look' where the real money is?
-
16 hours ago, ArminvanBuyout said:
I saw recently that US firms have been increasing market share internationally - one reason for why earnings growth has outpaced GDP growth.
The other reason is that if you believe technology drives winner takes most/all dynamics, then the larger companies (who are generally winners) should disproportionate amount of market share from private companies, resulting in public companies representing larger % of the GDP pie
The conclusion that market cap growth has decoupled from GDP (and may continue to do so) may be correct but the two underlying assumptions that are mentioned appear to be incorrect.
1-When using GNP instead of GDP in the ratio, the international part which is described above does not materially change the picture.
2-When using NIPA profits (which is an imperfect measure bla bla bla ok but still...) which also includes private companies, the same trend appears.
-----
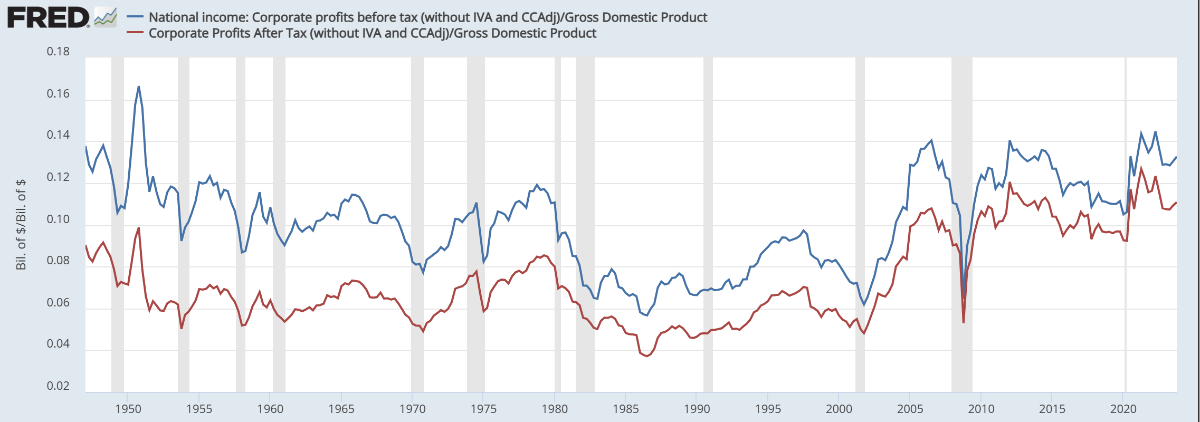
Now, as to why margins have decoupled is anybody's guess but i'd bet public deficits play a role.
The following is the same corporate profit line with, superimposed, the budget deficit. Look at what happened since 1999 when Mr. Buffett assumed that margins hovering around 6% would be the norm (absent fiscal largesse? which is sustainable?).


Stanley Druckenmiller interview (2018)
in General Discussion
Posted
^i would simply add the following:
From the FT article:
"What if I told you there could be an unprecedented stimulus injection into the US economy that will cost the government nothing and add not $1 to the national deficit? As early as this summer, a proposed move could begin to unleash almost $1tn into consumers’ wallets. By the autumn, it could be on its way to $2tn."
In fact, one could carry this free lunch idea even further with a potential of $11tn of "tappable" equity:
Homeowners are getting rich while renters get left behind (axios.com)
It's hard to figure out what is going on in Mr. Druckenmiller's mind but it may have something to do with the wealth effect on consumption and with future consumption pulled today but who knows?
A very interesting aspect of all this is that the author of the FT piece (The Oracle of Wall Street) recently suggested that home prices would soon enter a long period of decline (20 to 30% or more).