


Cigarbutt
-
Posts
3,332 -
Joined
-
Last visited
Content Type
Profiles
Forums
Events
Posts posted by Cigarbutt
-
-
16 hours ago, ArminvanBuyout said:
I saw recently that US firms have been increasing market share internationally - one reason for why earnings growth has outpaced GDP growth.
The other reason is that if you believe technology drives winner takes most/all dynamics, then the larger companies (who are generally winners) should disproportionate amount of market share from private companies, resulting in public companies representing larger % of the GDP pie
The conclusion that market cap growth has decoupled from GDP (and may continue to do so) may be correct but the two underlying assumptions that are mentioned appear to be incorrect.
1-When using GNP instead of GDP in the ratio, the international part which is described above does not materially change the picture.
2-When using NIPA profits (which is an imperfect measure bla bla bla ok but still...) which also includes private companies, the same trend appears.

-----
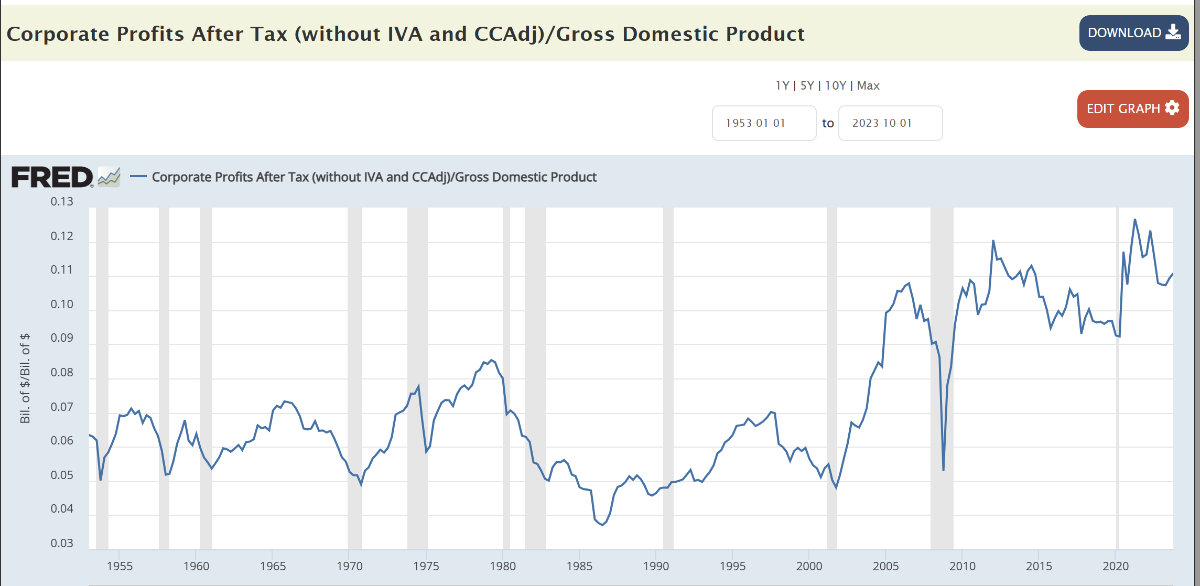
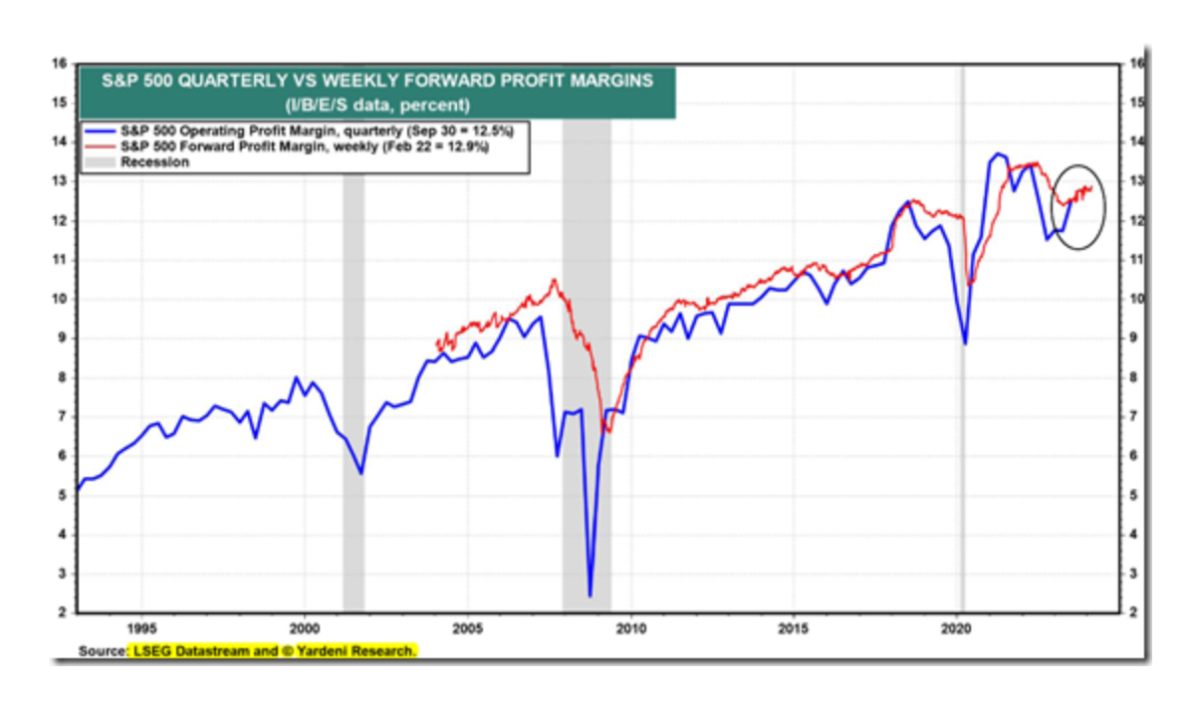
Now, as to why margins have decoupled is anybody's guess but i'd bet public deficits play a role.
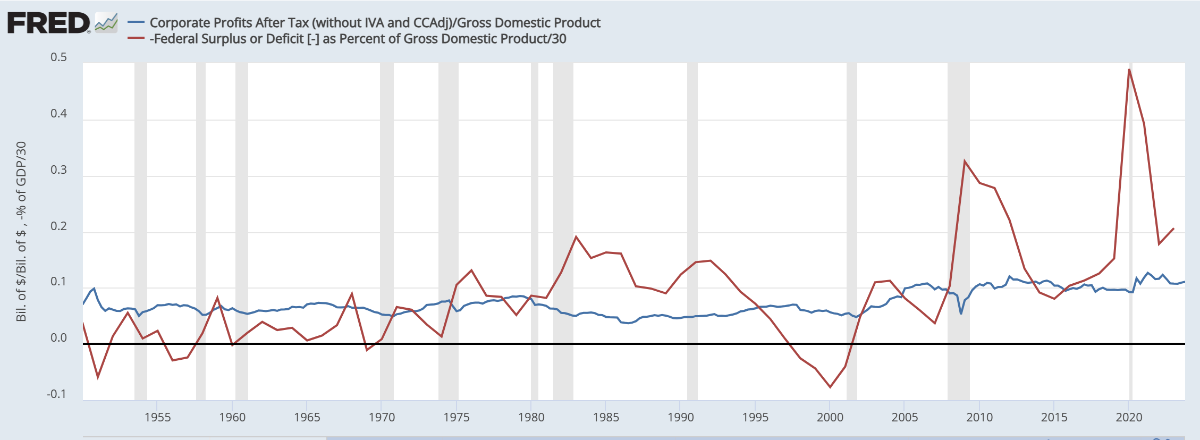
The following is the same corporate profit line with, superimposed, the budget deficit. Look at what happened since 1999 when Mr. Buffett assumed that margins hovering around 6% would be the norm (absent fiscal largesse? which is sustainable?).
-
From the anecdotal to the global and back to China
Our oldest offspring is a teacher at the primary level. He (like his peers in in North America) experiences greater trends across the education system in North America. Of course, there are major relative comparative advantages to other jobs especially after achieving a more 'permanent' status including the not so benign side effects of over-regulation, over-management and various 'entitlements'. However, there are also major disadvantages. A rising proportion of recent graduates are leaving after a short time spent on the 'job', despite recent adjustments to various salaries and other other monetary incentives (money does not appear to be enough). Based on what happened this week in his class room (and what has been happening for some time in North America), a major issue is the growing lack of respect linked to the gradual drift to incivility (also 'seen' in various forms of communication..). Here's an 'intelligent' answer from a perplex 'friend':
-----
There has been a gradual normalization of this drift and...
-----
Back to China
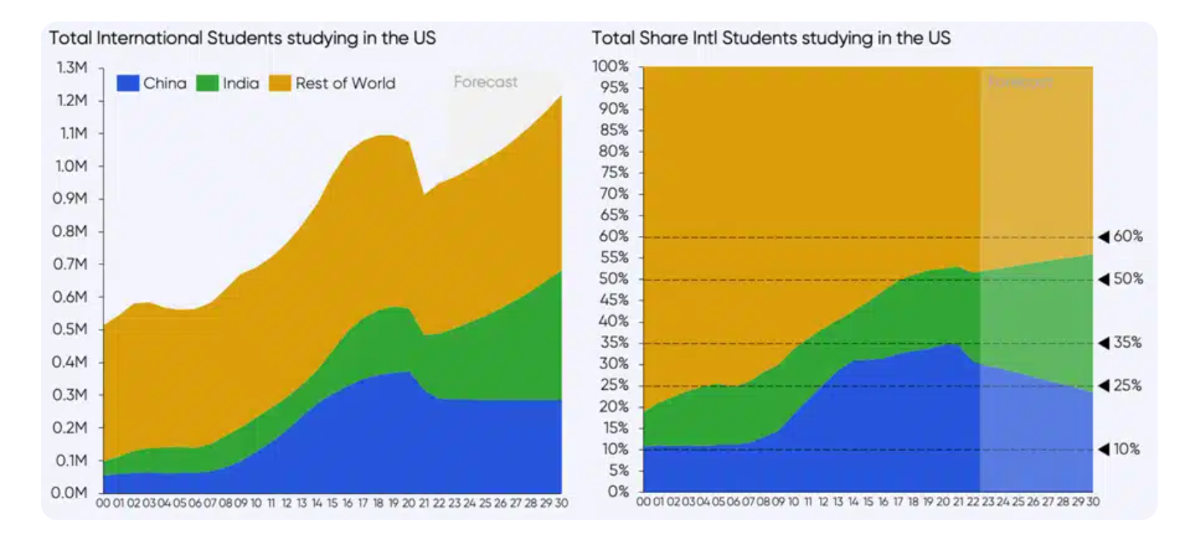
The US continues to be a leading pole of light as seen in the large numbers of international students coming to the USA.
For China, this has been an important factor in catching up but how to compete now?
For the US, it's hard indeed to spoil the secret sauce but its market share of international students has started to decline lately. Why?
-
23 hours ago, Eldad said:
Legal concept of Standing disagrees with you.
His lenders said they did not materially disagree with his personal financial statements and would make the loans again. The decision was horrible, whatever you think of Trump.Note: slippery slope for 'discussion' here but the angle is why BRK (this was likely a CEO decision) declined to 'participate' (for a potential profit) in the surety bond.
Above was mentioned that a surety bond of that nature is equivalent to a bond (lending agreement) where capital, capacity, collateral and character assessment play inter-dependent roles (one criteria could compensate for another but one criteria may be enough to decline). Character assessment is one of Mr. Buffett's strength but he's been recently disappointed (alluded to in last annual report) and likely increased the margin of safety required for that part. There are times when the risk-return profile is simply not adequate given the type of risk involved. As far as collateral, liquid assets are normally required for this kind of 'bond' and real estate does not fit the bill.
Now, as far as the outcome of the appeal, which is another consideration, a criminal offense of fraud does not require a victim. There is legal context for this and recognized criteria but common sense will tell you that, if you are caught crossing a red light with your car, a defense implying that there was no victim or harm may not be your best legal strategy to invalidate the infraction.
There is out there some discussion about the origin of the legal concept of Standing which involves a balance between community and individual autonomy as well as the efficient functioning of courts but the following is a balanced (opinion) view from a reasonable group (moderate-center, objective, high level of fact checking) which assesses the odds of success for appeal:
-
20 hours ago, This2ShallPass said:
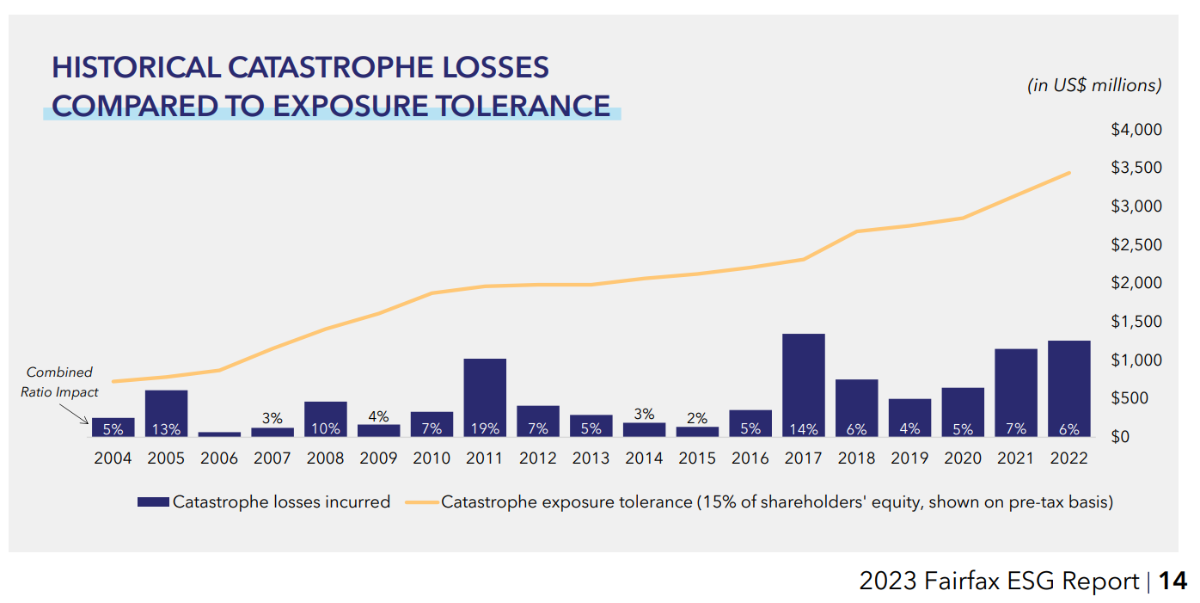
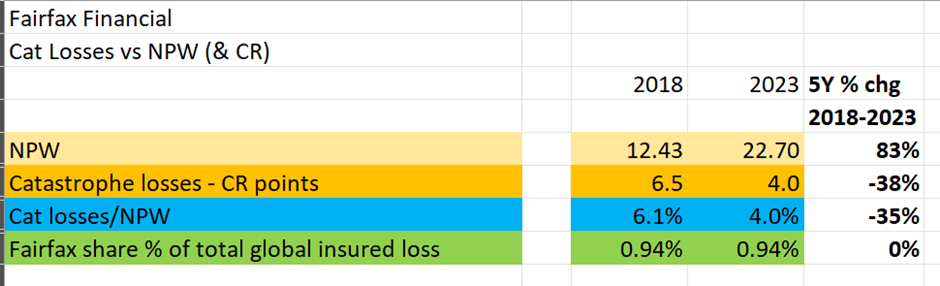
For worst case scenario, I looked at damages from Katrina which is the largest ever ($195B) and adjusted for inflation. So a Hurricane like that would cause $300B in damages today. Someone here mentioned Fairfax typically has 1% cat loss exposure and Berkshire 4%. That would cost Fairfax $3B.
Then say we're really unlucky and got hit with another hurricane half the size, so 2 bad hurricanes in a 2-3 year period. That would be a loss of ~$4.5B. Bad but manageable, they lose little more than 1 year of operating earnings..
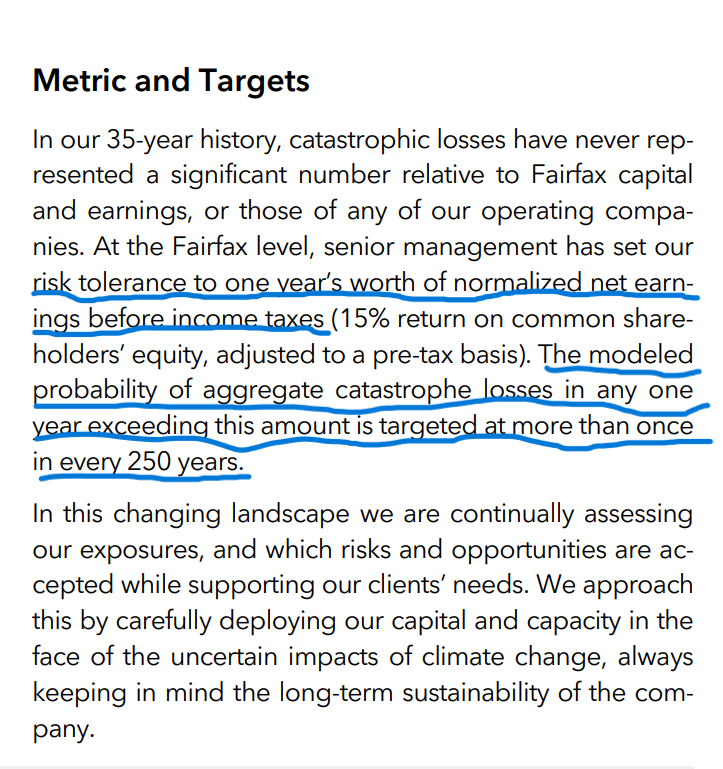
In their annual 'sustainability' report, FFH describe their "catastrophe exposure tolerance".
In 2023, there were 4.0% catastrophe points.
-----
So, from a statistical/model point of view, the unlucky scenario you describe should not happen that often.

-
3 hours ago, ValueArb said:
You can't talk about one of Elon's companies anymore without politics coming up. I wish he would be a lot more like Edison, head down in his labs focused on making new innovations, emerging only briefly to knife a competitor or former business partner in the back, then back to work.
Can i submit an alternative view of facts here?
Opinion about relevance: The investing climate has been changing and there's an unusual amount of noise, no?
Thomas Edison was unusual and made a lot enemies along the way. However, at a time when we was really busy (six-sigma kind of busy), he took the time to write an elaborate piece on the rational necessity of efficient government regulation. There was a specific personal interest involved but he took the time and mental energy necessary to produce a constructive series of arguments against the Sherman Act, including an alternative plan.
...
“Edison was a Republican,” Israel said. “Republicans in that era tended to be much more in favor of government regulation and government involvement in the economy than Democrats. He supported Teddy Roosevelt, the great trust-buster.” Times have changed. Opinion: Polarization is nothing new; it just seems that the polarization then was more about policy and less about stupidity.
Signed: someone hoping for a more constructive atmosphere for debate
-----) Back to the trip to mars and the starship search for extra-terrestrial intelligence
Edison apparently offered an opinion that a trip to the moon was not within reason (1911). Although he (opinion) likely meant that it was within reason during his lifetime. A pseudo-fact supporting that opinion is that he also got involved in scientific fiction writing which involved such travel and more.
-
^About the share-based compensation aspect,
FFH's program is quite unique and includes several shareholder-friendly features: share-based not option-based, pre-funded in substance, long vesting period but the program has been growing significantly; one has to determine if this manager-friendly posture is (and will be) shareholder-friendly. Opinion: a qualified yes.
To be 'fair' (@Thrifty3000), if one uses the diluted share count, one should add back the amortization of share-based payment awards to the operating income (found in the operating section of cash flows). Note: this line item is included in corporate expense.
The long term trend (in M USD):
2010 3.2 2011: 11.3 2012: 16.6 ... 2020: 84.3 2021: 104.1 2022: 146.1 2023: 147.0
-
On 3/13/2024 at 2:03 AM, Dynamic said:
Yes, and I would want to plan for an even bigger drop to be survivable if I took out a margin loan against it. A 25% loan against a $400 stock would become a 50% loan against the same stock when cut in half to $200, so that's clearly too risky. It could easily fall 60% or 70% in extremis compared to it's current fairly lofty levels, albeit still below IV. Imagine extreme insurance loss events (Pandemic, event like 9/11, or a major war) coupled with rising interest rates and a big recession hitting big names like Apple really hard, perhaps two or three of those at the same time. The worst drop Berkshire has seen is probably not the worst it will ever see. Anything now than about 12.5% loan to value would make me nervous.
Interesting.
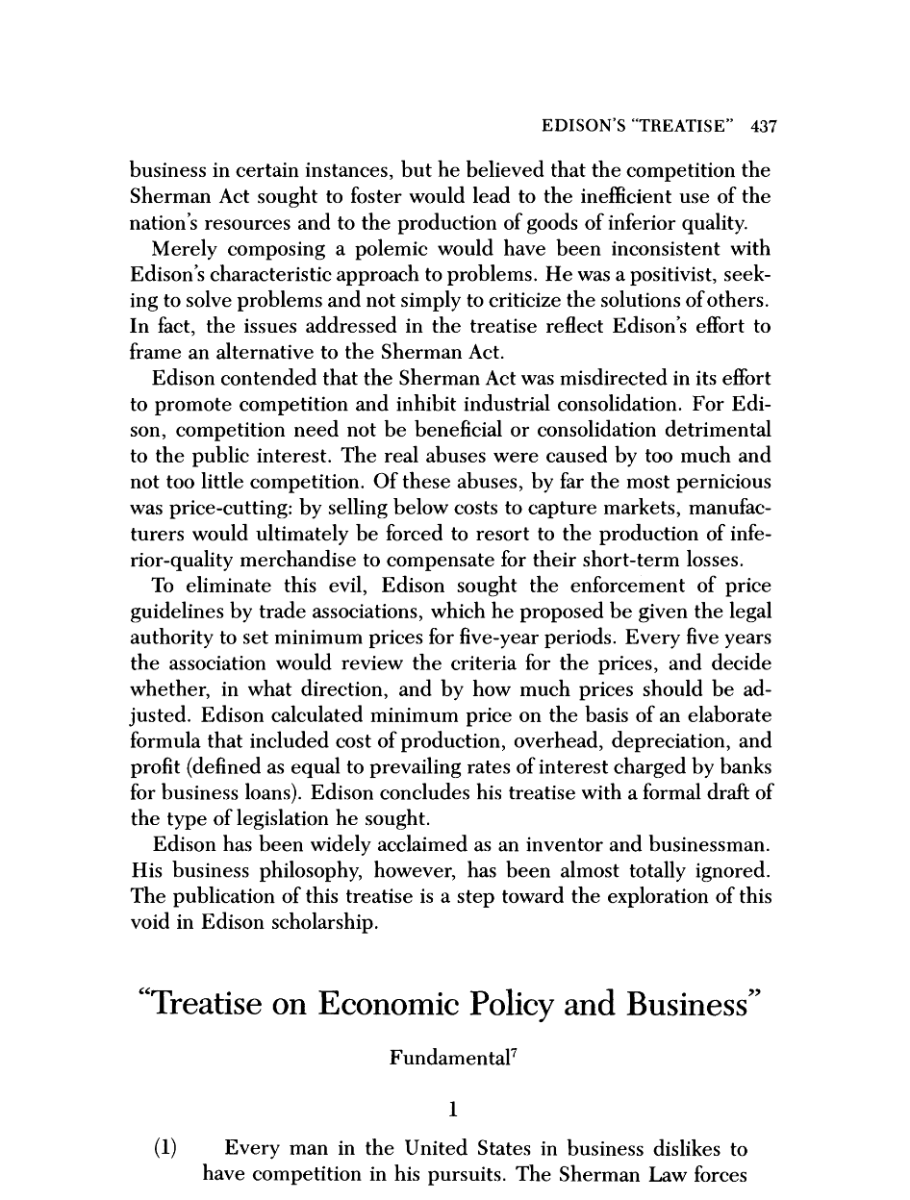
Just in case this is useful, here's a short discussion with a picture.
-----
i recently used that concept with one of my daughters who's more into math and statistics and not into investing. She wonders if, going forward, she should invest her excess earning power into an index (which is great in a lot of ways) and she wonders (the downside part in her) how long her initial investment could be under water after the initial period. i used the graph below which is a typical potential catastrophe loss graph (exceedance probability graph) showing the likelihood of loss and the 'modelled' loss per return period with, in this specific picture, how present undiscounted factors could be integrated to shift the graph line, in this case, for example, how the use of specific mitigation measures could bring down the potential loss and the potential likelihood of loss, such as improved building codes and wildland management versus wildfire costs. Anyways, the graph was used in a way to show the likelihood of marked-to-market loss sufficient to remain underwater on the y-axis against time on the x-axis (1yr, 5yrs, 10yrs, 20 yrs? etc). One can then figure out the time it would take to "recover" from a sentimental and fundamental point of view given a relatively low likelihood of loss following the initial phase. With her, several factors were discussed including present valuation levels which could influence the loss curve especially for the lower duration period ie 10 years or less. Anyways, if you can weather the loss, it's not really an issue. Or is it?
-----
Anyways, for the topic at hand (use of leverage to buy BRK), a similar concept can be applied with the likelihood of margin calls on the y-axis and time duration on the x-axis. The loss curve can be approximated from history (previous BRK drawdowns, frequency of such drawdowns and other factors etc). Many underlying assumptions do not follow the stationarity principle and could be used to 'adjust' the curve for different potential foresight scenarios. Of those assumptions, one has to consider the trend that BRK's market returns have been becoming more and more correlated with the S&P index (no longer such an uncorrelated pillar of strength in time of uncertainty). Another factor to consider is the growing proportional revenue and net income/cash flow streams coming from energy, a sector not appreciated for these qualities presently in an environment that is causing various degrees of transitory 'regulatory (un-)friendliness'.
Bottom line, your approach to avoid becoming nervous appears reasonable and does not require fancy models and all but i've spent some time recently on the potential for catastrophe results to impact targeted investments and this post required 5 minutes to share so..
-
17 hours ago, petec said:
Why *such* a big uplift from 2022?
...
And yes this is very meaningful going forward. Buybacks in a soft(er) market...
Many moving variables.
The most significant being
-higher adjusted operating profits/overall profits ahead of net premiums growth at relevant subs in 2023,
-reported (and expected for the full year) relatively low capital sent to relevant subs in 2023.
-
Impressive amount of info indeed but recovering from a hip replacement is not what it used to be.
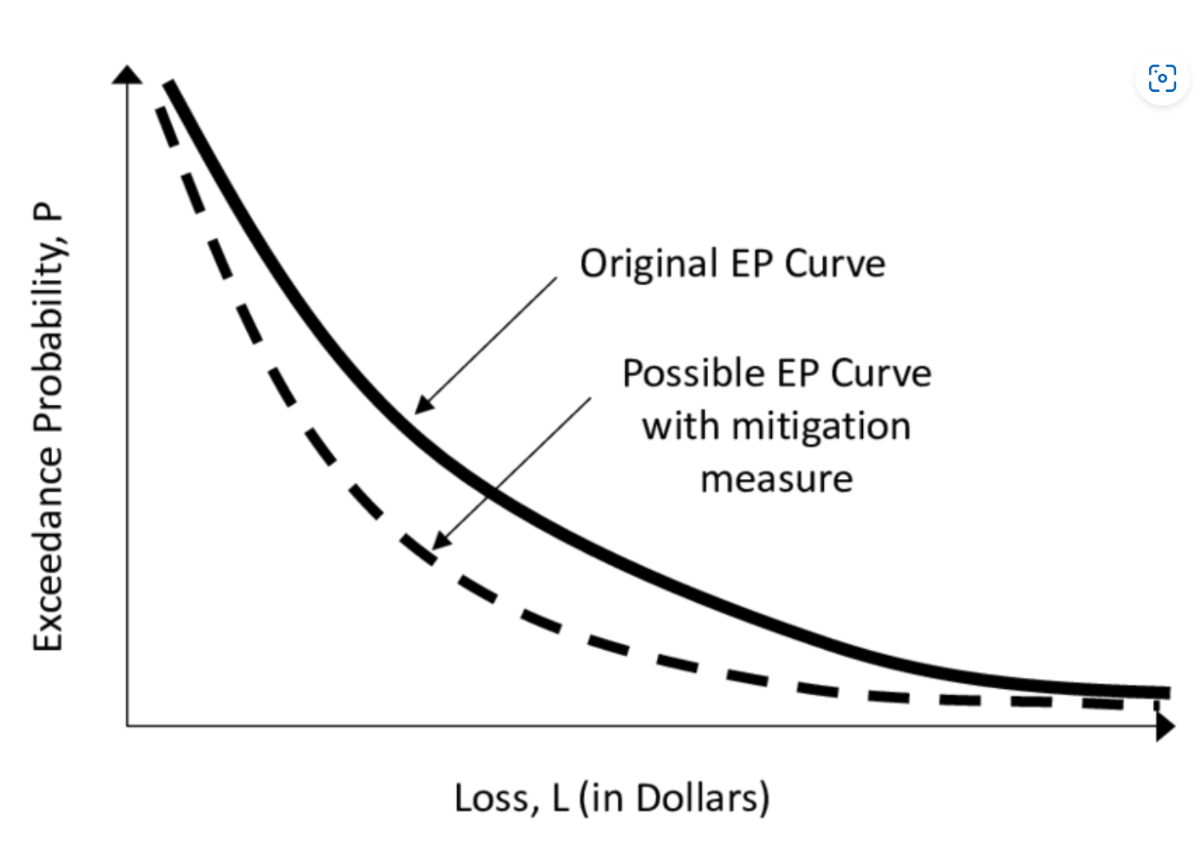
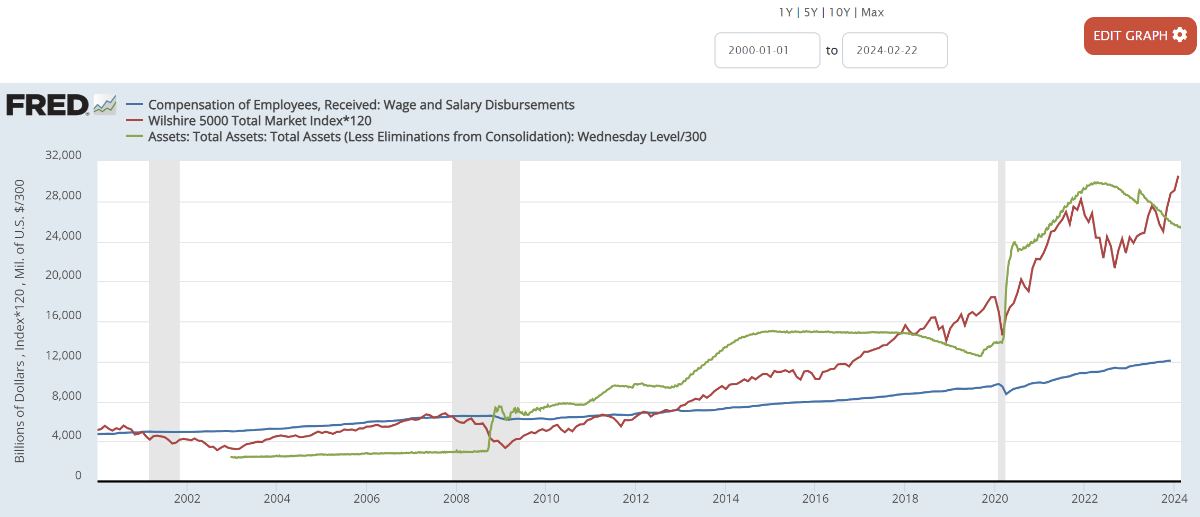
There were some comments about profit margins (overall market and some specific companies). Mr. Bloomstran suggests that we've seen a peak in margins but this is a dangerous area to forecast it seems.
Below is a graph suggesting that the NPM/GDP ratio has entered a new era with a positive slope instead of the cyclicality within a "band of normalcy" from decades before?
Below is what Mr. Buffett included in his 'market valuation and rational expectations' 1999 article.
It's hard to forecast even if the underlying reasoning is sound.
-----
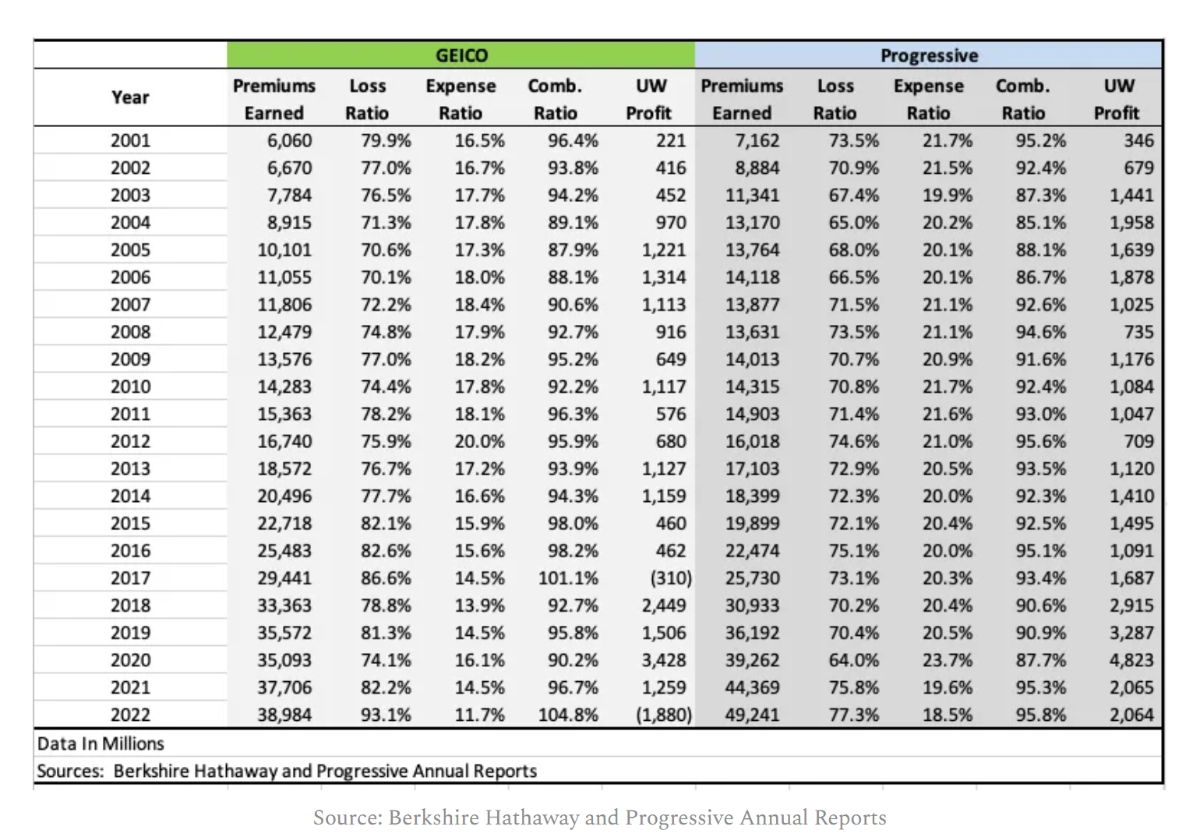
In the letter, there is a section showing that many BRK's subs have benefitted from rising profit margins in the last 20 years. Not Geico however, which showed a variable margin (combined ratio) over time; its value was more into growth and resilience (although many predicted an ominous demise not so long ago, especially compared to Progressive).
Unaudited numbers for 2023, Geico 90.7%, Progressive 94.9%.
-
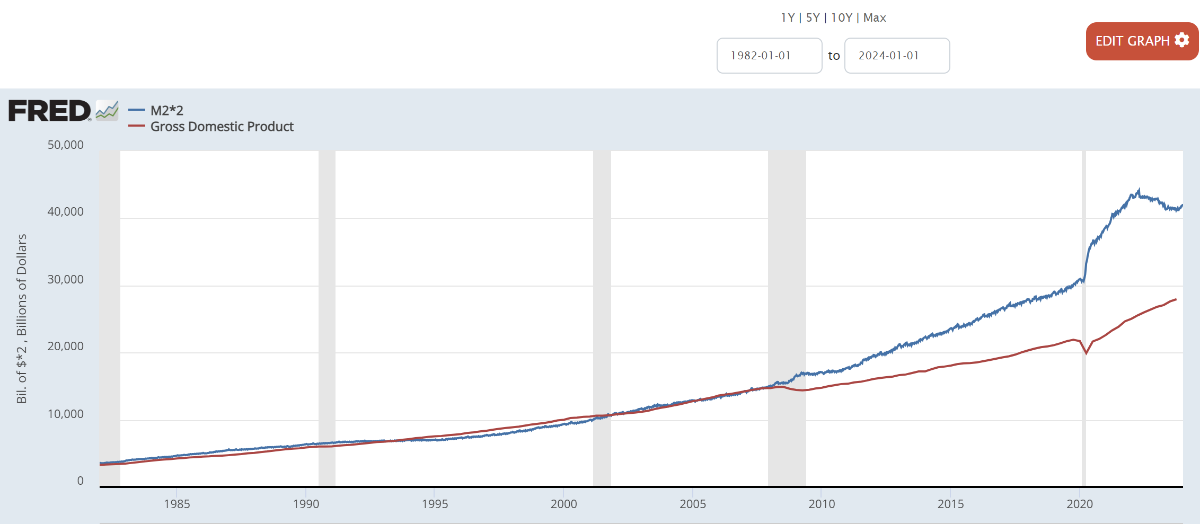
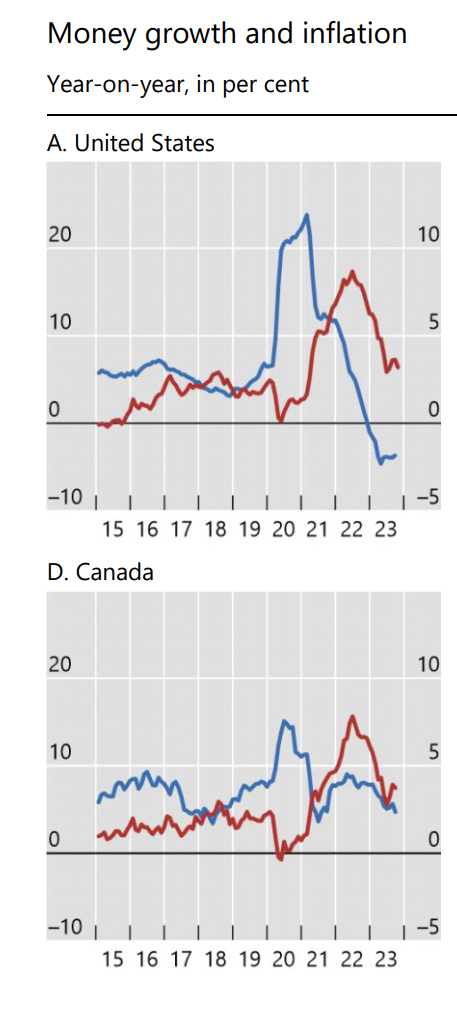
19 minutes ago, gfp said:
@Cigarbutt In the middle charts, "money growth and inflation," what are they plotting as "money growth?" It looks like the red line is "inflation." How are they defining "money growth?"
First apologies. These 'money' questions are incredibly interesting but is it worthwhile to discuss?
For entertainment value only then
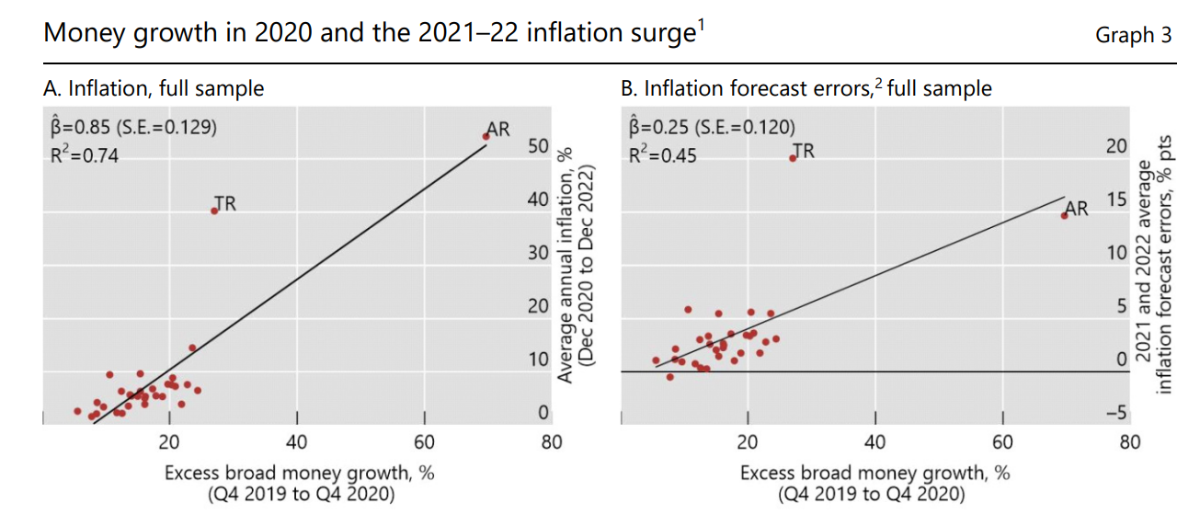
The ivory tower experts define excess money growth as excess broad money measures growth over GDP growth. Similar to:
-
3 hours ago, gfp said:
Greg Abel is leaving the Kraft Heinz board. I doubt there is much to read into this, probably just time management. Greg had a large increase in workload. Two Berkshire designees will remain on the KHC board.
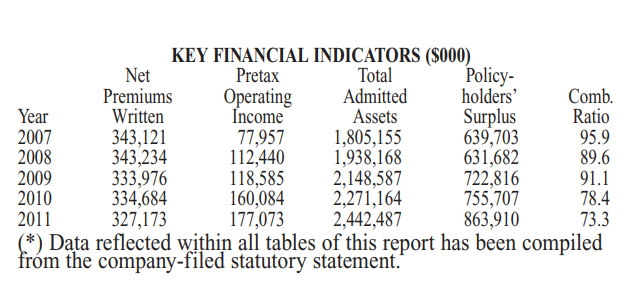
A word about Timothy Kenesey, who may have some work to do in his main line of business.
And a word about MedPro, the gem bought by BRK in 2005 for 825M. A gem like so many others hidden in plain sight within consolidated numbers. The MedPro topic is expanded upon here slightly as there may be a correlated message to another contemporary topic here related to unrecognized value when an insurer has recently entered a hard market.
When BRK bought MedPro, their market was in a mess but an unrecognized recovery was already under way (i guess it felt like then what is felt like now in relation to BHE's prospects?).
Retrospective look to the period before the 2005 acquisition:
The above is the total return curve for the industry's lines where MedPro has been evolving. The poor numbers reported in the 2001-3 period were affected by poor investment results but especially by bad underwriting results (both accident and calendar year reporting). So BRK bought in 2005 for 1.5x surplus value.
And then:
The above are MedPro's results in the years following the acquisition.
Ok this may be simply boring historical stuff but the MedPro gem is very likely about to (next few years) report very strong results.
Of note: the 'premium' paid in 2005, in retrospect, suggests that what GE accepted as a 'price' was not exactly efficient.
-
1 hour ago, gfp said:
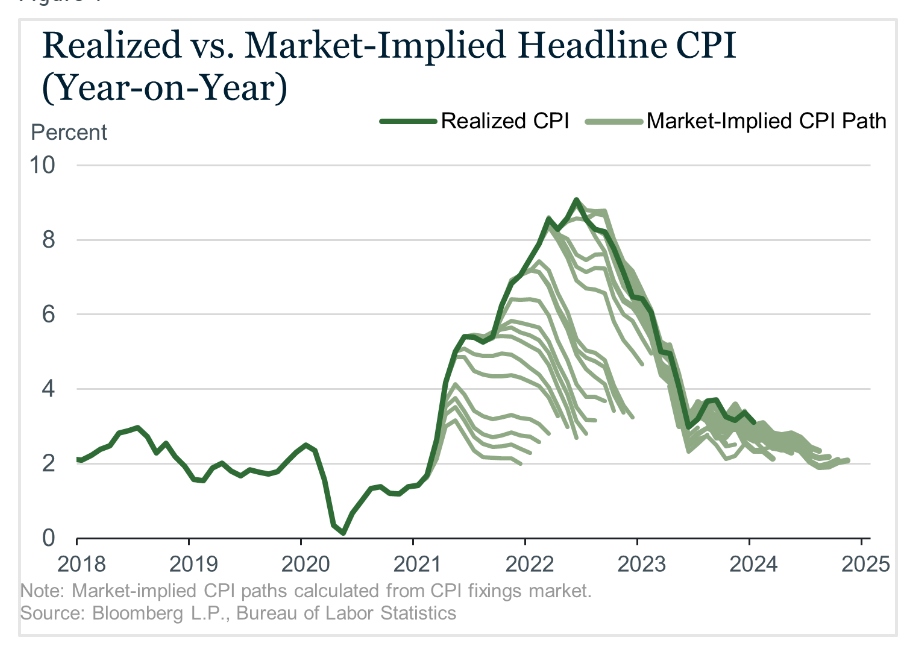
Are we gonna be OK? Should I be panicking because super-core ticked higher? Is capitalism working?
To the question "Is capitalism working?" who knows. i'd say it'll be fine. (may have some bumps along the way?)
Similar picture:
The 'market' had it right? Too early can be seen as wrong though?
-----
As far as the forces outside of capitalism, forces trying to modulate it (for better or for worse), there has got to be a link with recent excess money creation at large, accepting the possibility of lag events, confusing what transitory means?
-
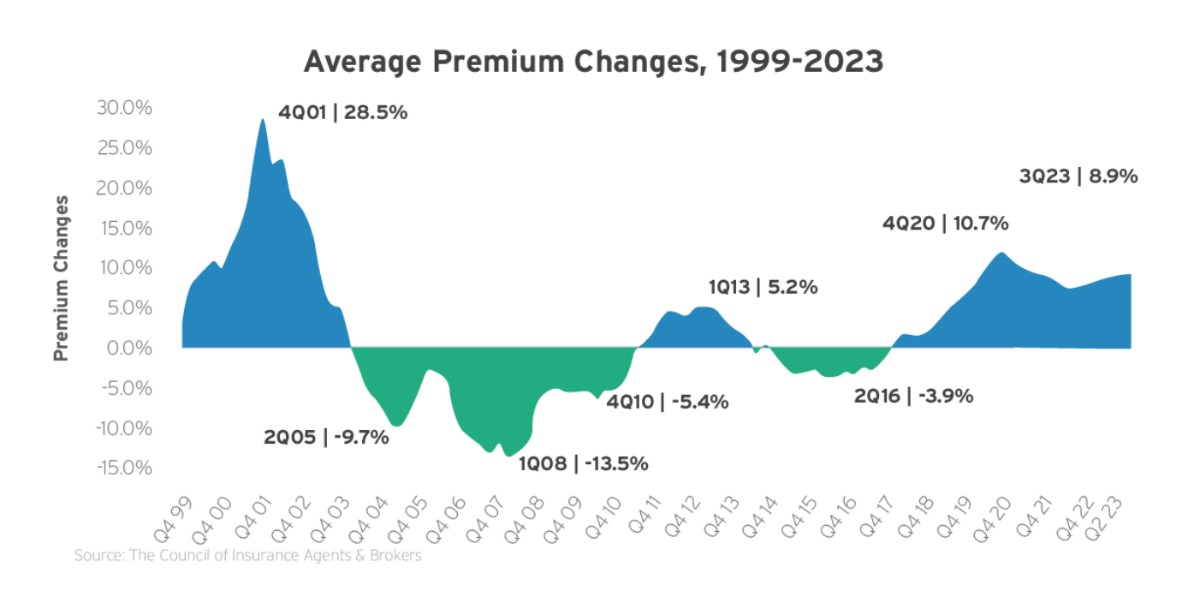
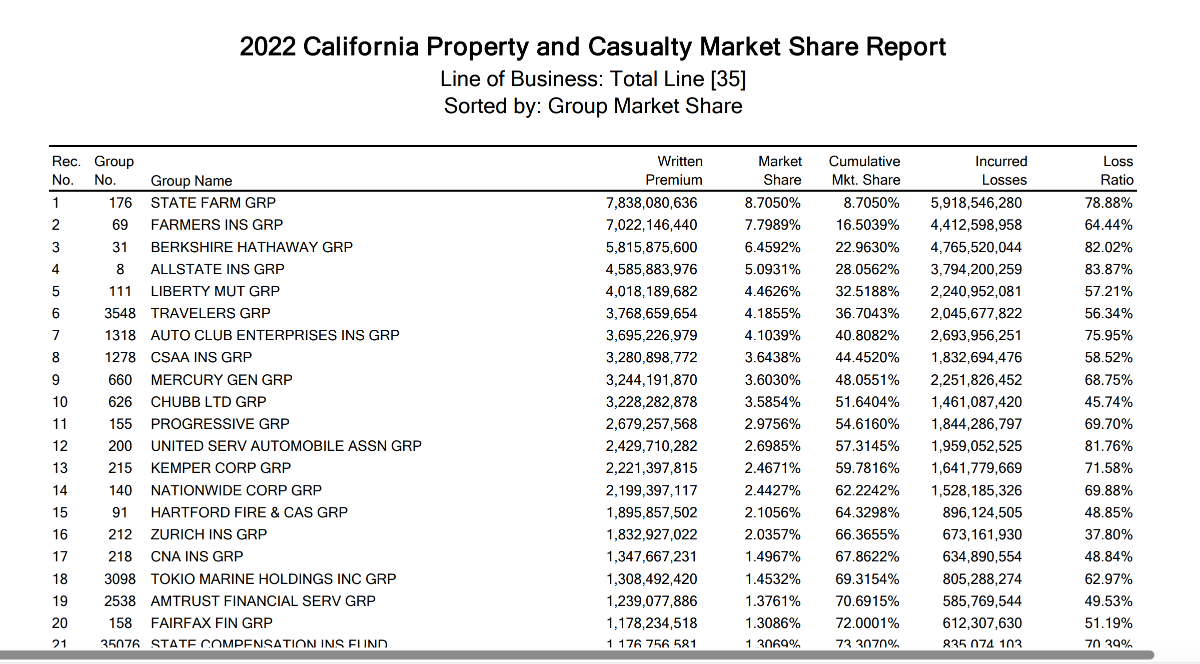
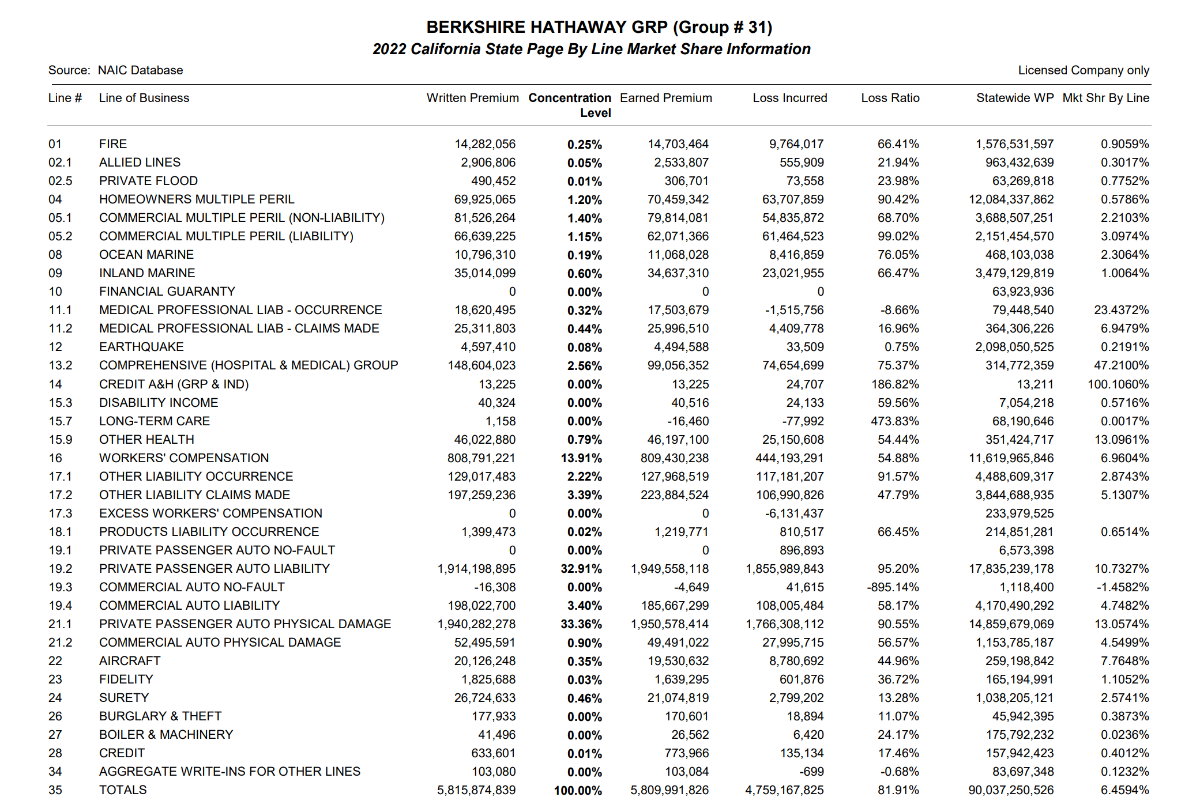
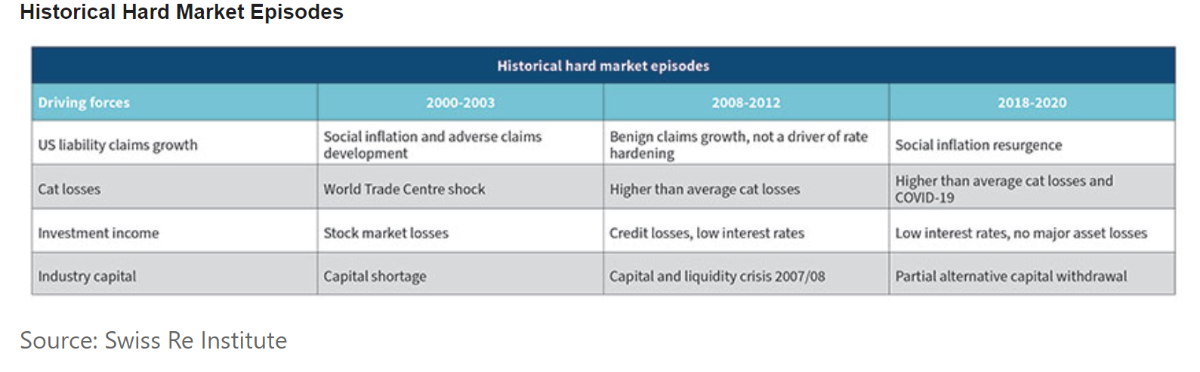
Some more thoughts about the evolving hard market. The following is about the US property-casualty market:
The recent hard market is similar in extent (area under the curve) to the 2000-4 hard market and FFH, once again, was able to grow much more than peers but, this time around, at least at this point, they don't have to absorb losses that materialized before (late 90s) and which are yet to be reported.
The best scenario would be for the hard market to continue and the ideal scenario would be that new momentum be given to more hardening as a result of pain from the asset side of the balance sheets at large with FFH potentially remaining more flexible during a relative downturn.
However, it seems like the hard market may be abating.
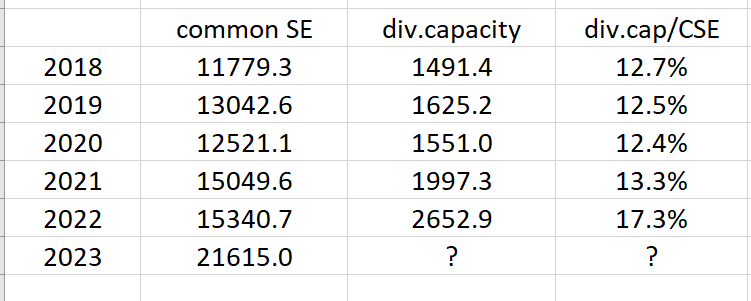
If that's the case, it will be interesting to see how FFH (at the holding company) use the dividend capacity at the subs.
Summary table form the last few years:
The dividend capacity at end of 2023 is (estimation/guess) likely between 3.6 to 4.5B.
So, dividend capacity has been growing at a higher rate than equity during rising premiums requiring more capital.
Interesting (forward-looking), no?
-
34 minutes ago, gfp said:
Don't hold your breath...
But I would bet that someone figures out you can't treat the utility this way and expect what you got in the past.
Maybe it's a way to play the regulatory competition game across states of the union or just a way to cap damages and obtain a pass-through mechanism to clients.
Yes, don't hold your breath because, if BHE plans to leave Oregon (or hyper-regulated California or whatever), they certainly don't act that way presently.
Just following a significant rate increase obtained last January in Oregon, Pacific Power filed 10 days ago for a plan aiming at a 16.9% rate "adjustment" including innovative insurance-related solutions and an inspired by PC&G recent travails but improved catastrophic fire fund with significant contributions from parties other than the utility itself (which keeps skin in the game obviously).
Oregon rate proposal (pacificpower.net)
06_Joelle_R_Steward_Direct_Testimony.pdf (pacificpower.net)
They also just produced an extensive 420-page document (date Feb 22, 2024, 2 days after the annual report release, what a coincidence..) which would provide a framework to sort of ring-fence this issue across the following relevant states (perceived as less friendly? and relevant to BHE liabilities, known and to be reported), Oregon, Washington, California and Utah. The report's main theme is Lessons Learned, which may be the carrot that Greg Abel will be seen to carry.
Opinion: What Mr. Buffett is doing appears to be an assist (with the meaning associated to ice hockey).
Adapted meaning of an assist: In ice hockey, an assist is attributed to the player of the scoring team who shot, passed or deflected the puck towards the scoring teammate.
Apologies for the hockey example but i played outside hockey today and the girl taking care of the ice rink (who happened to play very well) told me this was likely the last day of the year (very very unusual for this time of year at this latitude, from memory first time ever in February) so one has to adapt to changing circumstances (players, climatic conditions) i guess.
-
1 hour ago, anony208 said:
Buffett in 2023 letter just issuing an empty threat then?
From my understanding, Mr. Buffett suggests that 'we' have to figure out what 'we' want (for energy delivery to clients) and i guess that should be the result of rational and constructive discussions (with COBF as a microcosm of these discussions).
-----
In the previous post, you suggest that as a result of "CA over-regulates everything not just utilities", "I expect this to eventually lead to a slim down of BHE perhaps even a complete exit." (my bold)
The logical extension of this statement would be for BRK to exit all regulated businesses in CA.
So why will they continue to write a massive amount of insurance contracts in the "over-regulated" state of CA?
-----
Maybe Mr. Buffett's long term assumption that people in charge will do "the right thing", as recently as in 2008, no longer holds?
-
23 hours ago, glider3834 said:
Peter Clarke...
And I think that is starting to show up in the numbers too, I did this table below which illustrates.
opinion for entertainment...
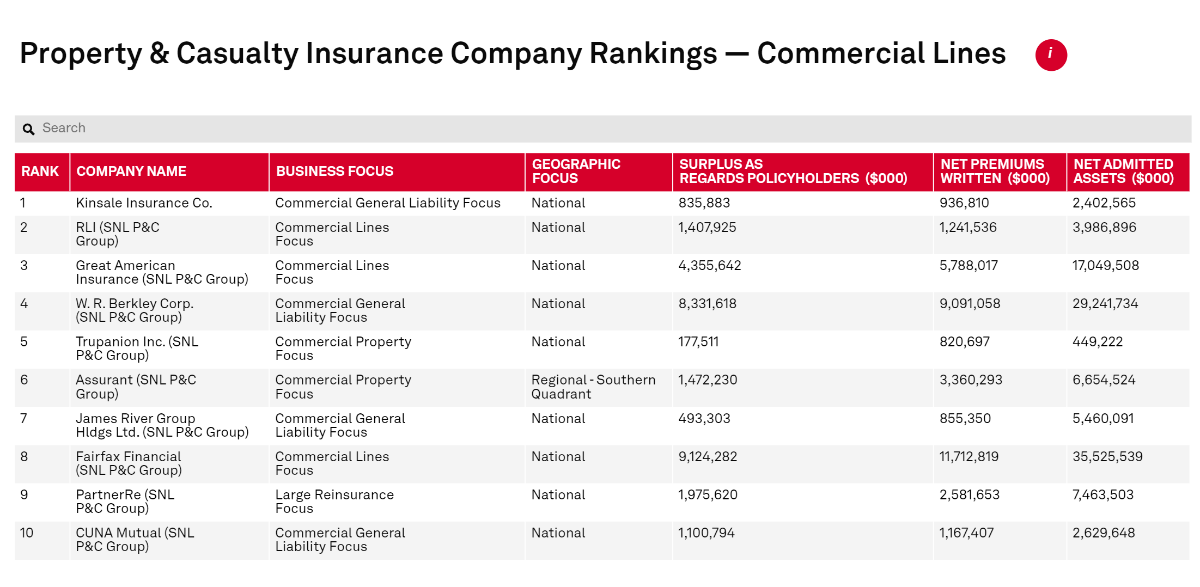
The link you mention also discusses the potential advantages of specialty lines. One of the keys for the transformation (survival) of Crum & Forster about 25 years ago was the rapid move out of commodity lines to more specialized lines with very obvious positive underwriting results. The specialty market has been growing faster than the general market and FFH has followed. When using a similar proportional table as the one you've included above (using the last 8 to 12 years), specialty lines (as defined by FFH) have grown a lot but not significantly versus total premiums at large.
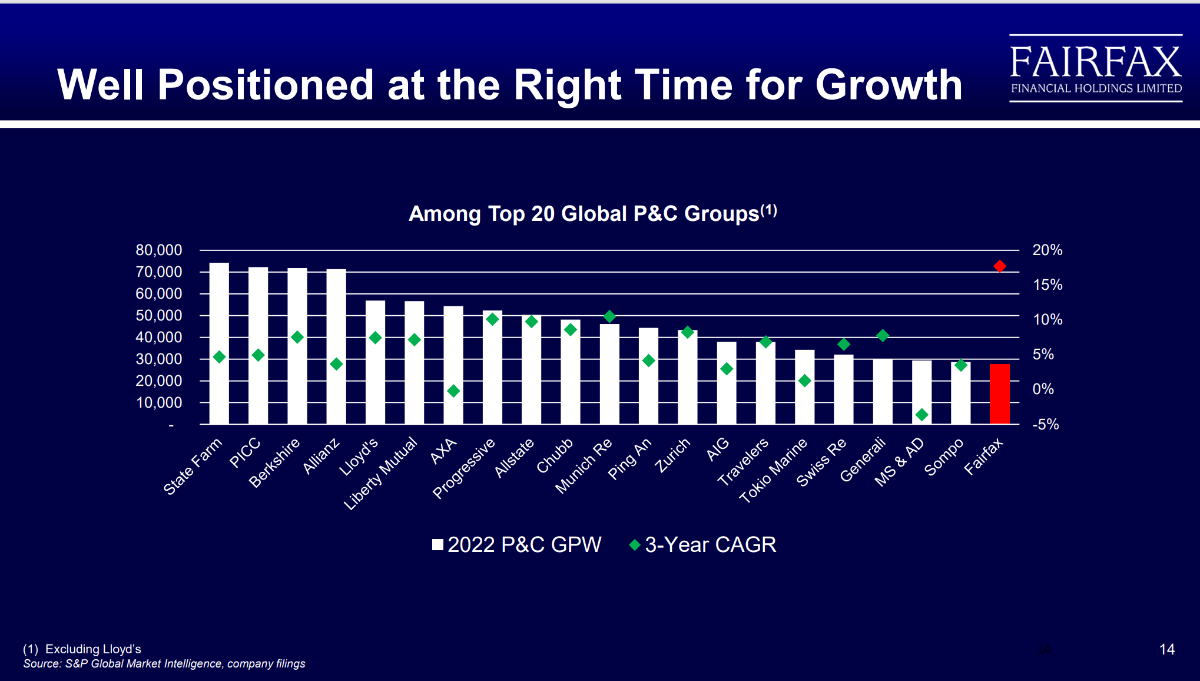
For some years now, S&P Global has produced a ranking with the last one being:
"The U.S. Property and Casualty Insurance Performance Rankings are based on statutory financial results collected and compiled by S&P Global Market Intelligence. They are determined using 13 financial metrics from 2022 statutory filings grouped into six buckets: rates of return, underwriting profitability, balance sheet expansion, investment performance, prior-accident-year reserve development and premium growth."
S&P Global describes how the above rankings show that some relatively small players have been able to grow profitably a lot from a small base and expanding into specialty markets. They also describe that FFH was able to grow profitably both their niche specialty segments and also their much larger portfolio of commodity-like products.
i would venture to say that there is some 'moat' in there, especially when considering the now longer-term track record.
-
4 hours ago, anony208 said:
I doubt CA regulators are going to change course due to this letter. CA over-regulates everything not just utilities.
So I expect this to eventually lead to a slim down of BHE perhaps even a complete exit.
Then, you may want so send a memo to Omaha to help them realize they are doing some regulated business in California.
-
A few words on the evolving Energy situation.
Yes, of course, one has to wonder how the US ('We') will navigate the meanders between deregulation an reregulation in the energy universe (especially relevant now with the democratic drift question, the unusually high level of bipolarization, unusual inability to "get things done" etc versus the actual present challenges: wildfire costs, distributed energy, climate-related issues, huge capital needs etc).
Opinion: Mr. Buffett is a great communicator but also a great negotiator.
For Geico in the 1970s, he let Jack Byrne be the contractor and carry the stick while he remained the architect and became personally involved (with the carrot part) interacting with Max Wallach, a key DC insurance regulator, in order to reverse what seemed to be an obvious end of going concern destination for Geico.
For the Solomon scandal, he also became personally involved with regulators and law makers (especially Nicholas Brady) in order to actually reverse a government decision with ominous implications for the company.
Not so long ago (2015, NV Energy vs SolarCity), there was some drama (potential unfairness of return on equity for the utility with net metering over distributed solar energy) and there were negotiations but who actually remembers now the relatively deep questioning about the potential ability to resolve this issue?
The issues now are larger (1-how to deal with wildfire costs and 2-is the trend for less-friendly regulated approved reasonable returns a secular one?) and it's not clear who Mr. Buffett needs to talk to but he somehow decided to use the stick and is clearly sending a message (the annual report will obviously be read by relevant regulators all around the country).
For the wildfire costs which are very large, the damages to be paid have been and will be determined by juries and the court systems and that's unlikely to change. What needs be figured out is a way to cap those damages (outside of clear negligence and recklessness) and to pass those costs to the electricity consumers. It will happen somehow.
Interesting reference:
For the regulated ROE question, much has been said about "energy justice" inputs which have had, at least so far, a limited and patchy impact on rates approved. It's about a balance of forces and some of those forces underline the unusually high executive compensation (an idea that Mr. Buffett certainly approves) as an excessive input into the approved rate decision.
Also, now that approved rates sometimes go down from something like 10% to 9%, before mounting the barricades, an historical perspective may be helpful keeping in mind that interest rates, apparently, at least in some instances, act like gravity on valuations.
Any idea as to why this has suddenly become such an existential issue?
-
9 hours ago, dartmonkey said:
...pessimism...suspicion...not be as good as they look? ...skepticism...
Maybe and the aim should be to try to (constructively) destroy the thesis, but in this specific case (expected underwriting results within the next few years, absent extrinsic material surprises)...
Every hard market is different:
and how a specific company opportunistically takes advantage of a specific hard market is different (just think of the opportunistic capital that comes in the market after very large catastrophe years):
Will string of startups truly benefit buyers? | Business Insurance
FFH has grown premiums very significantly during this last hard market (net premiums earned 2018: 12066.0M, estimated net premiums earned 2023: about 22100-22300M). Not as impressive as the growth in 2001 to 2004 but quite significant.
During a hard market, price of policies increase very likely ahead of underlying policy costs and underwriting standards tighten which very very typically results in reserves linked to "current" accident year policies to become redundant over the duration of the reserves. For all hard markets (not only the last three) (the opposite applies for soft markets but in the other direction), some time after the hardening starts, the accident year combined ratio will tend to (not always) go down (as was the case during the 2001-4 period for FFH) and reserve redundancies will very typically get recognized (as was the case for FFH in the years that followed the 2008-2012 hard market).
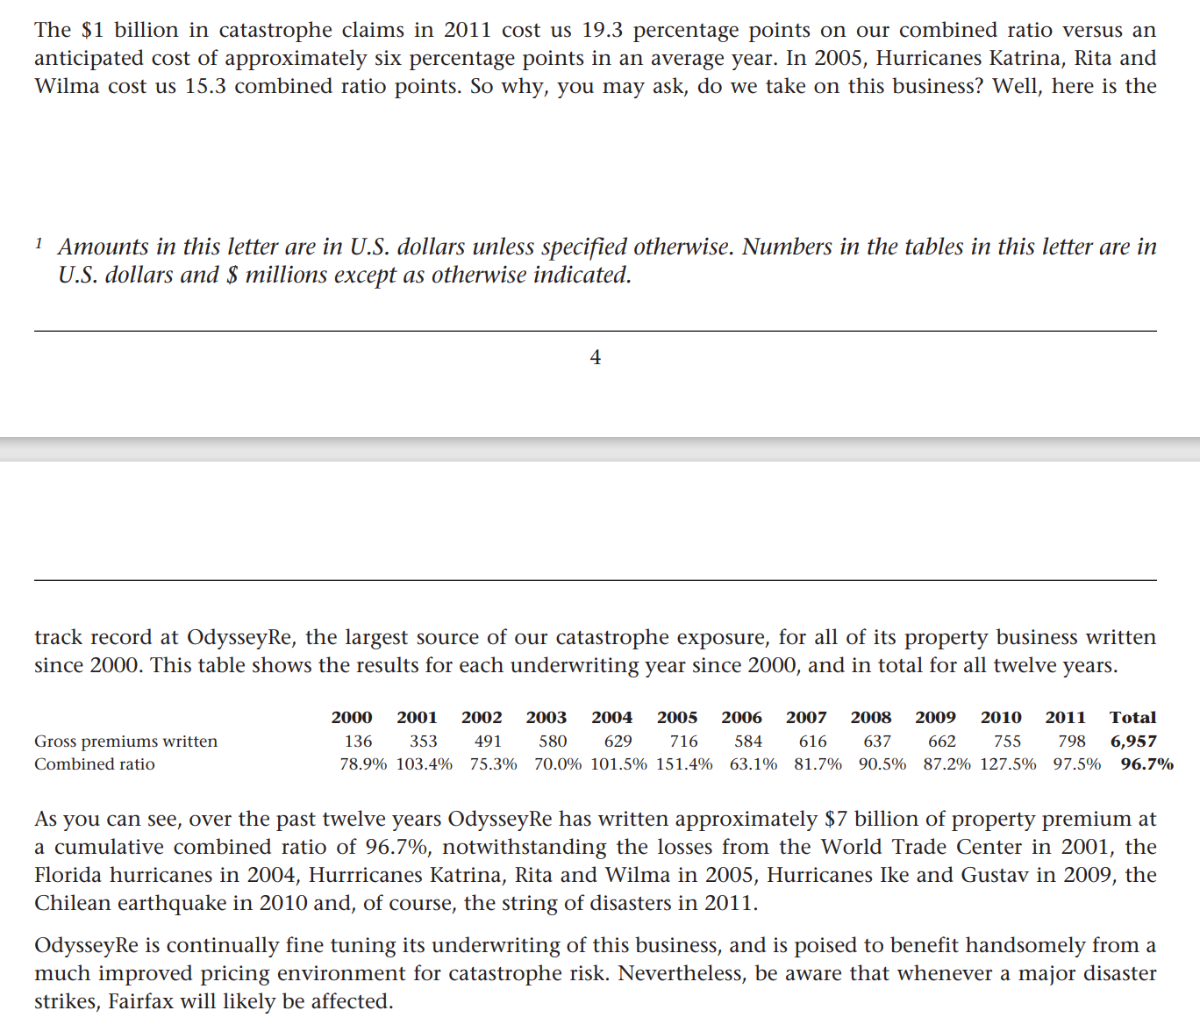
As far as catastrophe losses, it appears that FFH management is quite mindful of the potential lumpiness of results (in both directions) and they've periodically commented on that aspect, including after the difficult 2011 year and they seem to be focused on making a reasonable return over time and, in the last two years, have been reporting adjustments including reduced exposure at Brit.
-----
From now on, i will try to focus on the downside but (opinion) the progress that FFH has shown over the years on the underwriting front has been very impressive and (another opinion hopefully ahead of the cheery consensus) underwriting results are likely to drive various measures of return on capital.
-
4 hours ago, Hamburg Investor said:
...to dig deeper...
..other points?One has to wonder if your time is well spent on some shared minutiae here but your posts triggered some kind of trip to memory lane (and a thick file). Disclosure (variable position sizing for me over time) and opinion: the 'market' has often gotten FFH's valuation approximately right but not always. For example around +/- 2001-2, the market's quotes resulted in an opportunity to buy an uncomfortable asset at quite a steep discount, meaning, as an equivalent, that one could buy an insurer with a price embedding some kind of an additional adverse reserve development cover and potential upside for better underwriting going forward (and some other potential upside to be uncovered over time). Now, from the underwriting point of view (a key ingredient for FFH), it looks like the market presents (has been presenting for some time) another opportunity by being too slow in applying a premium necessary for a much improved and consistent insurance underwriter (the picture has been changing for some time now but, from the legend, apparently Newton only realized some deep insights about gravity when the apple actually fell).
-----
The following is a fragment of stuff i've been following. Warning: it may contain errors and some 'in-house' numbers are clearly not up to USGAAP/IFRS standards.
Ok, we could talk hours but i aim to visit my mother-in-law today (who shows significant cognitive decline) in order to play Bingo with her so i'll stick to some essentials?
Some comments
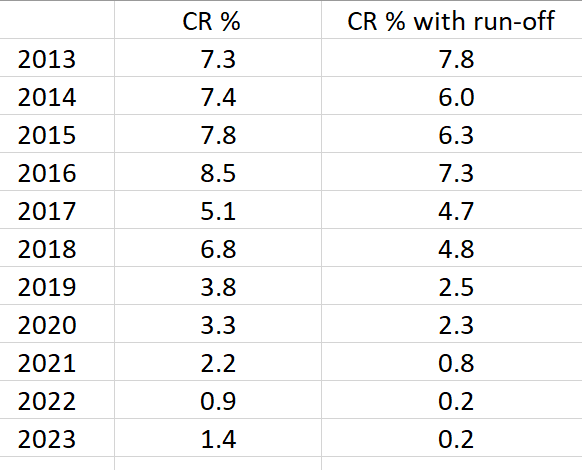
-AY CR adj. is an in-house measure to represent FFH accident year combined ratio adjusted for reserve development (including run-off) and catastrophes % points.
-CR as reported is FFH as reported.
-comm. CR is a reasonable proxy to compare under, ie US commercial lines
Some 'messages'
-AY CR is a reasonable way to assess performance over time. For FFH, compare 2007-16 to 2017-23.
-When compared to US commercial lines, FFH has done better for reported combined ratios but (opinion based on some minutiae not included here), it would look even better if their reserving process was less conservative (precision: conservative reserving is something to look for and not a comparative disadvantage). Also some years (2011 19.3, 2017 13.7, 2021 7.5), FFH had to absorb higher than usual catastrophe combined ratio points which helps to explain poorer performance vs commercial insurers in general. Also for the period 2017-23, FFH on average reported 7.3 catastrophe points compared to a slightly lower level of catastrophe combined ratio points before which also helps to 'justify' the lower superior more recent performance compared to commercial line insurers. My understanding is that FFH aims to maintain average catastrophe points to 6 combined ratio points or lower (something like that) and it appears that they are taking real actions to achieve this. Anyways, with FFH becoming international, more diversified and with more exposure to reinsurance, the commercial group comparative is becoming less relevant.
-The most important message perhaps is the fact that recently reported numbers over the last 2 or 3 years seem to confirm quite clearly a more positive path for further significant underwriting profitability. Starting with a baseline 87.8 and adding 6 points of catastrophe points and adjusting for expected reserve releases, it's very reasonable to expect reported combined ratios between 90 and 95% and likely closer to 90 than 95.
-
2 hours ago, blakehampton said:
Thinking about macro is goddamn information overload
Apologies for adding to the information overload as there may be better things to do and what follows, almost for sure, has very little utility for 'top' and 'forecast' discussions...
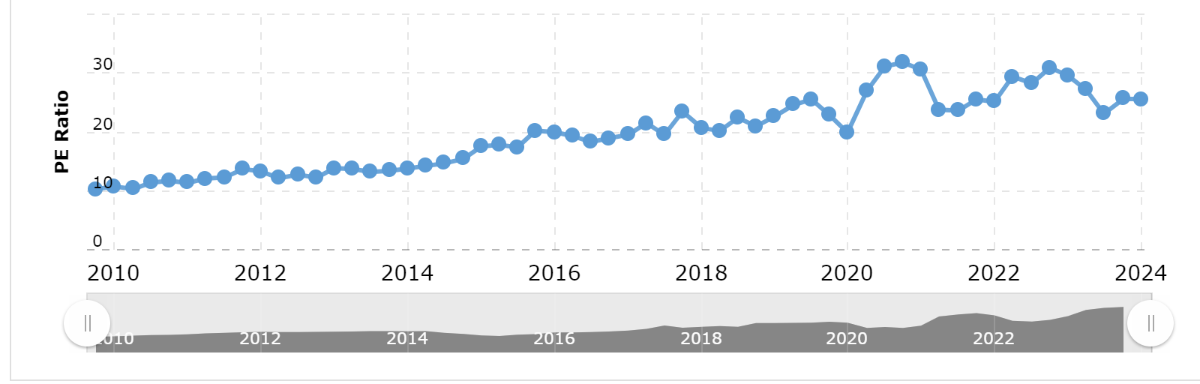
If you want to 'believe' the hot potato effect you may be interested in the following. The hot potato effect is often thought of in relation to the (initially intended) effect of QE on banks' willingness to lend (this has been shown not to be an issue or a real transmission mechanism especially since the Fed has decided to pay interest on excess reserves). However, the hot potato effect may be real on another relevant level. Most QE (90%+) was carried out with non-banks and then, as a separate balance sheet effect, new base money or new deposits are created (yes, as 'they' say, out of thin air) and then this money tries to find its way to other securities that promises to realize a superior to 0% return with a potential for asset inflation disconnected from fundamentals?
Of course, the cashier at Macdonald's does not see this but he/she may feel it?
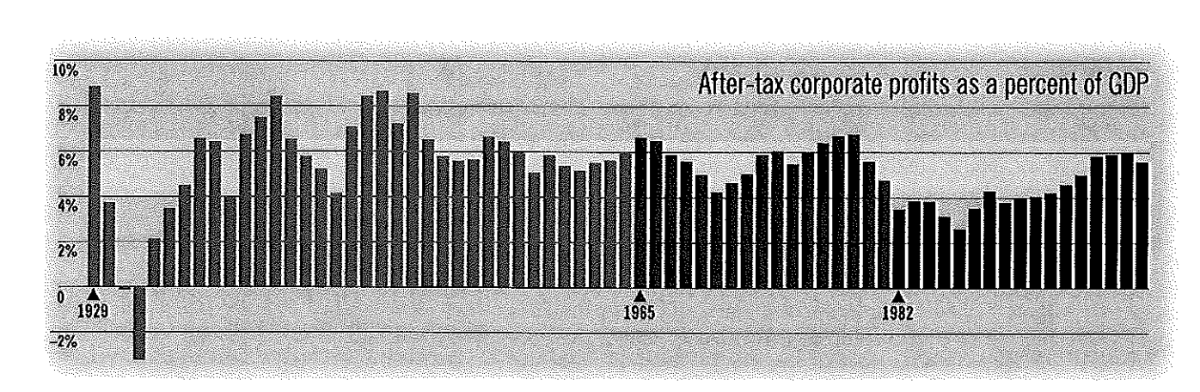
MCD's PE ratio since...
Have MCD's fundamentals changed in correlation with higher valuation multiples or?
-
2 hours ago, Hamburg Investor said:
Yes - thanks, I changed that.
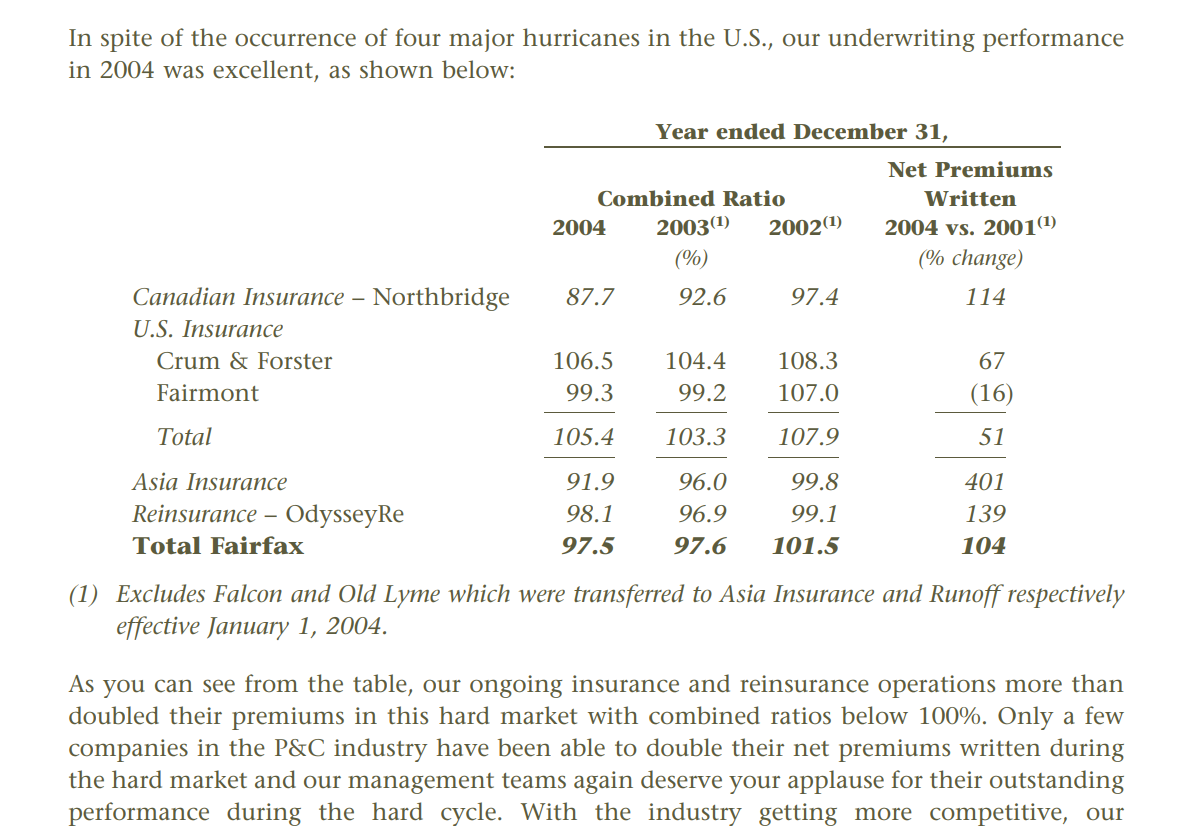
The comment was not to make you "change that", it was because several aspects of your post are interesting and, before commenting on this specific aspect, i wanted to make sure we were on the same page. The 2001-4 topic is both interesting and, especially, relevant for today (i think).
From 2004:
Later in the report:
Reserving
All in all, I am very happy to report that our reserves held up well. Any development at Northbridge and OdysseyRe was absorbed in their excellent combined ratios.
-----
FFH expanded ++ in the late 1990s during an unusually soft market (during the nadir of the cycle in fact) and invested in very very poor underwriters (means bad results now and bad results to come when the tide goes out on reserves). So thanks to very unusual and large covers (Chubb- and SwissRe- like), thanks to the very hard market that followed (2001-4) and (critical for FFH survival) thanks to FFH's unusual ability to raise capital in a quite constrained time for them, FFH was able to absorb the HUGE negative results from the late 1990s that eventually were recognized and was even able to report decent combined ratios with a positive trend from 2001 to 2004.
Now in 2024, 'we' have just lived through a moderate hard market for a few years and now, what could happen?
-
13 hours ago, Hamburg Investor said:
The question I wanted to find an answer to: How has Fairfax CR developed over the years? What is the trend?
There's one exception: After 2011 until 2004 FFHs. CR ratio improved. M y best guess is, that FFH changed its insurance portfolio after 9/11; but I am pretty sure others here know better than me.
...the US PC Insurance market per year on average (which is not perfect as an "index" to compare FFH with; but what would be better, where we get numbers easily?! I have been searching for a long time and would be grateful for any tips).
20240221_CR_VergleichFFH_MKL_BRK_Zahlen.xlsx 16.15 kB · 3 downloadsDo you mean from 2001 to 2004?
-
On 2/17/2024 at 3:04 PM, Viking said:
Great conversation @StubbleJumper and...
3.) It looks to me like Fairfax has been upgrading the quality of its insurance businesses. This suggest underwriting profit is likely to surprise to the upside moving forward (like it has in 2022 and 2023).
That's a point that needs to be underlined.
-Short version
FFH's underwriting has improved and this improvement can be seen in reported numbers and more can be inferred to support the conclusion that future underwriting results are likely to surprise, positively, overall, over the next 5 years.
-Longer version
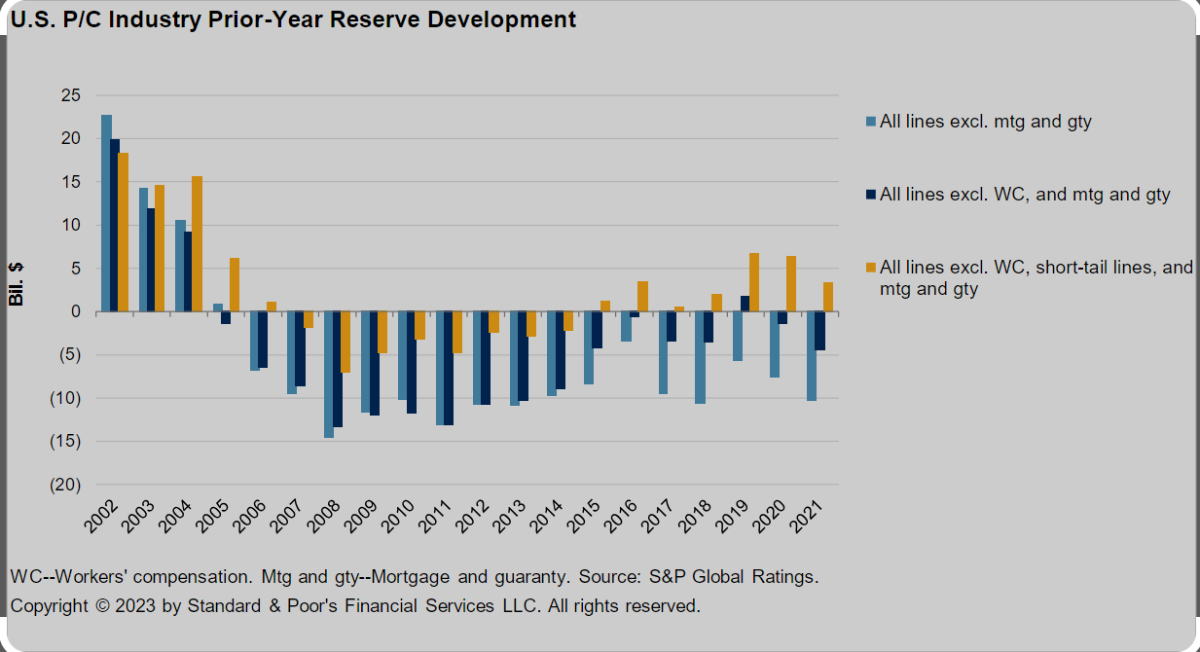
This has been discussed before (a few years back in these pages and with you at times...). Here are two pictures. The first is the reserve cycle which is tied to the underwriting cycle.
This is a longer term graph which includes US P/C (relative proxy for world P/C) and which shows how reported combined ratios eventually benefit from reserve releases a few years after a hard market has started and how the opposite occurs after a soft market. Opinion: for FFH with their insured lines profile, their comparable industry follows more the yellow bars, bars which should be compared to FFH's actual results (see below).
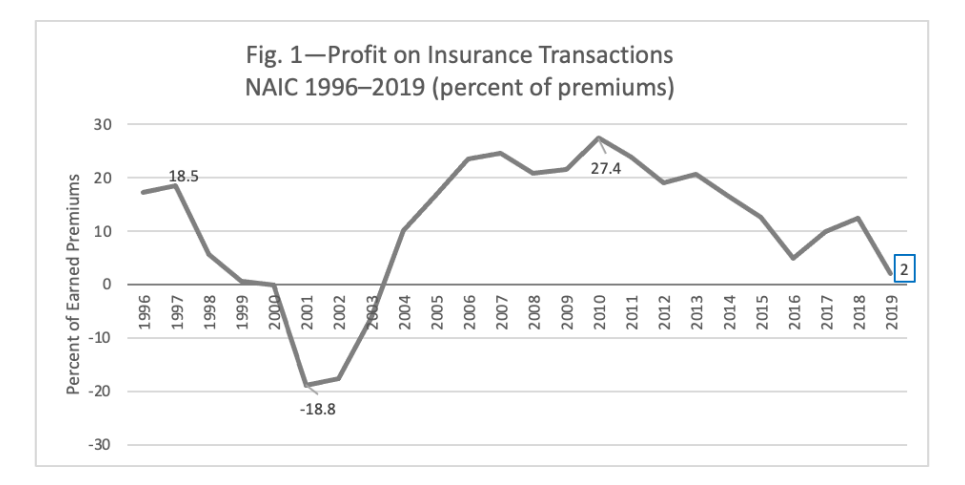
Here's another with 2022 results (from NIAC, US P/C):
So more of the same and a significant adjustment needs to be made for workers comp which, at the industry level, has seen a very unusual and high rate of reserve redundancy for a few years including more than 6.6B for 2022, thereby indicating otherwise a recent net adverse development pattern. Note: FFH writes WC policies but the proportion is much less than at the overall P/C level. If avid for details, one can go through their IFRS and otherwise appropriate disclosures and dissect the reserve development pattern at Zenith. Spoiler alert: this additional work does not materially change the conclusions from this post.
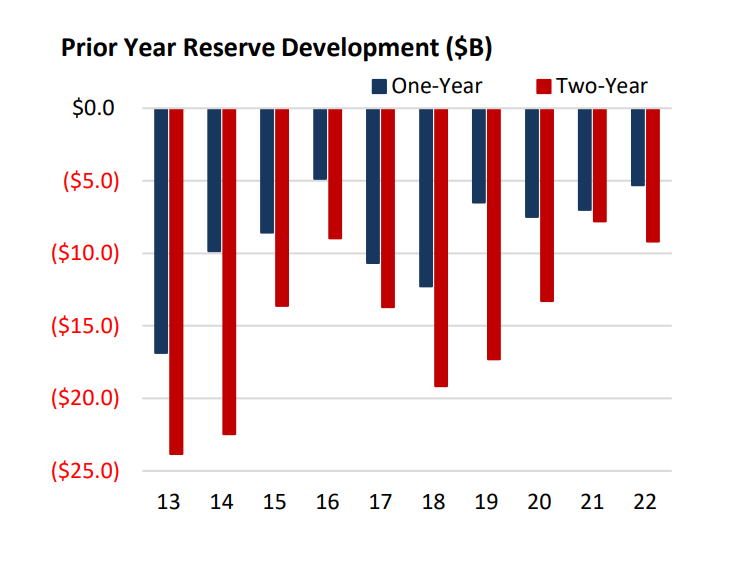
Here's from FFH:
The first column is reported directly and represents the CR % points of reserve redundancy at operating subs. The second column requires some basic math and includes the run-off earned premiums and reserve development there also. Several aspects stand out but the main point is that FFH's pattern of reserve releases has been more or less parallel to the industry but better (few % points overall), is likely to improve over the next few years as the market turned around 2018-9 as more recent positive float reserve development will more than compensate older negative float reserve development. The big bonus though (and possibly underestimated and presently unrecognized?) is the fact that FFH grew their premiums very opportunistically, compared to peers. This means that the expected reserve releases over the next few years are likely to surprise to the upside and it's helpful to remember that, for a company writing at a ratio of premiums to equity near one, each one % point of improvement in the reported combined ratio, which includes the accident year combined ratio (which is expected to be reported at slightly to moderately below 100, on a net basis, over the next five years) and the reserve development CR %, corresponds to a pre-tax one % point of improvement in ROE.
Technical stuff related to the above Excel table:
-the 2023 result in the second column is likely correct or close to correct but this needs to be checked with the release of the annual report
-in Q4 2023, 0.7% of CR was released at operating subs, for a total of 1.4% for the year, perhaps putting some weight to the hypothesis that the trend for gradually higher reserve releases may have started to turn to the upside for the quarters to come...


How is the Fed going to cut rates with inflation over 3%?
in General Discussion
Posted
Relating to the recent rise in profit margins (since 1999 when Mr. Buffett voiced his 6% 'normal profits' assumption), the material reduction in corporate taxes plays a role but there are other specific material variables,
including maybe a common denominator?
-----
Relevance for our day-to-day search for alpha?
Since 1999, where i've 'looked', most (by far) of the improvement in net margins at relevant investment opportunities have come from lower debt service costs and lower corporate taxes, not from higher margins related to what @Dinar describes ie companies that (apparently) have the intrinsic ability to obtain and maintain superior products versus simply the possibility that monopoly power has gone up because of etc etc
Maybe i'm not wired to 'look' where the real money is?