Hamburg Investor
-
Posts
229 -
Joined
-
Last visited
-
Days Won
2
Content Type
Profiles
Forums
Events
Everything posted by Hamburg Investor
-
Agree 100%. The Top10 Equity portfolio should be around 4.1 bn dollar in 2020. 1. So Blackberry was representing 8%. 2. FFH-TRS wasn't existing, but is - together with Eurobank - the biggest contributor of the Top10 holdings 3. Foran Mining wasn't part of FFHs portfolio 5 years ago (at least it were fewer shares, don't know) 4. Metlen wasn't part of FFHs portfolio in 2020 5. Thomas Cook India seems to have grown into the Top10 (your argument... winners are overrepresented) 6. Resolute First Products: Was sold in July 2022; It's only part of the list, as it seems to be one of the 10 "most impactful holdings" of the last 5 years. 7. Stelco: Was a Top10 in 2020; as it's been sold in Nov 2024 it's in this list only as it still is "one of the 10 most impactful holdings of the last 5 years. It's the list of the "most impactful winners of the last 5 years". So it's not even the Top10 holdings of today. I think the informative value of the CAGR is therefore very limited. Nonetheless the list is instructive in a way, somehow. To me it shows e. g., that they got the size right at its winners. But it shouldn't be overinterpreted! Does it mean, that FFH has done bad overall investments over the last 5 years? Of course not, you and me know, that they were incredible good at it. It's just, that the table clearly is not able to answer the questions, HOW GOOD they were on average (CAGR), as it ONLY highlights the best of the best.
-
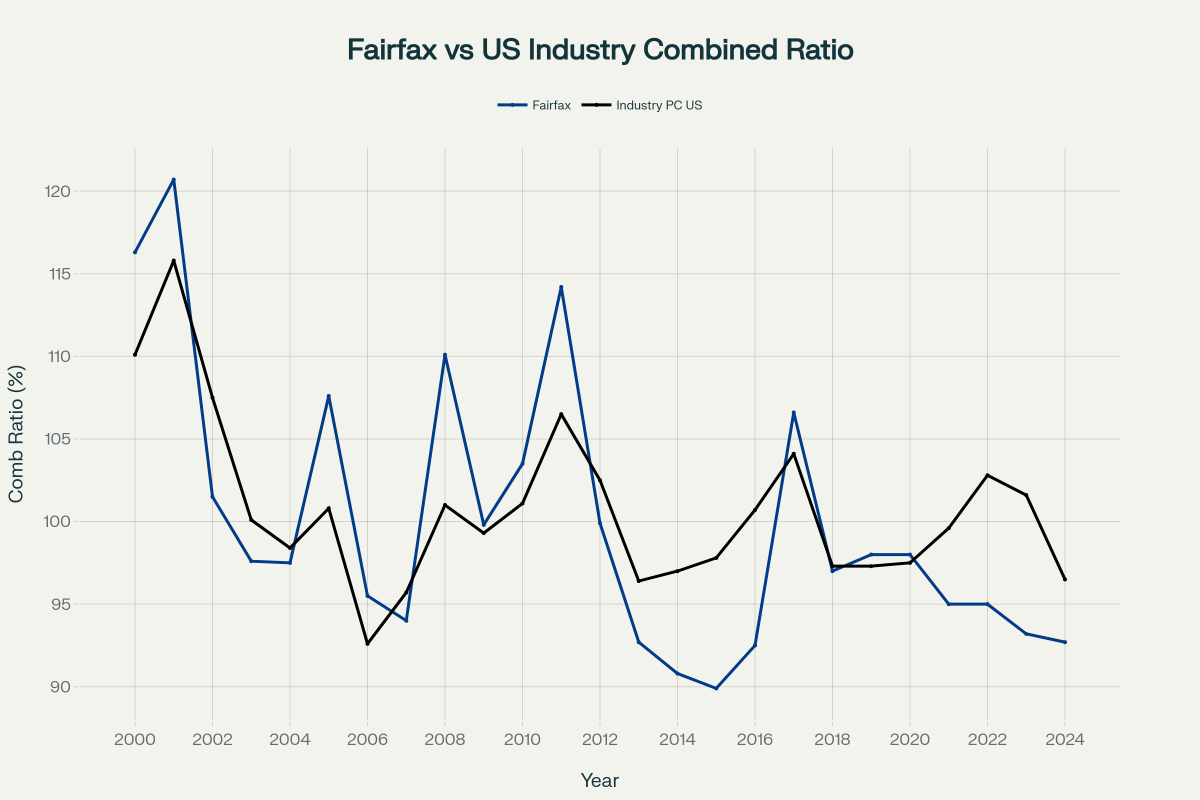
Thanks; Perplexity helped me with this. I was researching the numbers myself and took some time to find the aggregate P&C US numbers. I was looking for an easy graph about the evolution of quality of FFH insurance business. BTW: The small drop in the years following 2016 represents the time when Prem bought a lot of insurance companies. I think those are the reason for falling back to a more „normal“ (instead of a superior) combined ratio.
-
Absolutely! Which can be seen in the (unorthodox) graphic attached. The red dotted line wents down when Fairfax was less profitable than US P&C Insurance Companies in aggregate. And up when Fairfax was better. It paints a pretty clear picture. It goes up by one, if Fairfax CR is better 1% in a given year. In aggregate, Fairfax went up since 2011 until 2024 from minus 30 to plus 20, so 50 points in 13 years or nearly 4 points per year. Better than that, in the 7 years before 2011, FFH lost 28 points in aggregate or 4 points per year. That's an improvement of Fairfax combined ratio of 8 percent points pre 2011 versus after 2011 (if you include 2001 to 2004, than it's more like 6 1/2 points; that would include 911, which might be seen as a little random). All this only, if you are willing to define the P&C US as "the market". Which one could discuss of course, but to me it felt like the best available comparison.

-
You are right and I am wrong. 10% pretax ROE is not really helpful. I am not accountant... Thank you!
-
You are right and I am wrong. Can we assume that premiums account for around 70% of the float on average over many years? If the ratio is reasonably stable, then a factor could be incorporated. Thank you for your comment!
-
But how much more is float worth? I haven't found a good formula for that question yet, it's more like a rough idea, but I still find float fluid and difficult to grasp. My thoughts: 1. In my view, an insurance company with consistently free float (combined ratio: 100) and no growth is likely to be worth less than the same amount of equity. The reason is that, in practice, float is invested entirely in bonds. It will therefore only achieve bond-typical returns, i.e. below equity. 2. The float of an insurer with a negative combined ratio but no further float growth is worth exactly as much as equity if the total return from bond returns and profits from the insurance business over the years generates equity-like returns. To put it simply, a 4% bond yield and a combined ratio of 94% (i.e. a 6% yield) result in a total return of 10%, which I would consider to be equity-like. Such float would therefore possibly be just as valuable as the same amount of equity. 3. If the float also grows, it is worth more than the same amount of equity. But how much more exactly? Certainly more if growth is strong and less if it is weak. Price leadership, as in the case of Geico, has historically often led to particularly strong growth. Can annual growth simply be added to the return? So 4% bond yield plus 6% profit from the insurance business plus 5% growth/year, i.e. 15% total return overall? Of course, all of this is always intended as an average value (CAGR) over many years. But: Float and inflation make it more complex (I) But float and insurance business have a special relationship with inflation. It is said that, ideally, float grows at least in line with inflation. After all, every insurer will strive to pass on the inflation of insured items directly to its customers. The fact that this is possible is interesting and actually rather atypical for equities and other sectors. Most companies cannot simply raise their prices in line with inflation; only those with a moat – and well-managed insurance companies. But that's not all about Float and inflation - it gets even more complex (II) When inflation rises, bond yields also rise. Insurers therefore benefit twice when inflation is high or rising: the float grows more strongly AND yields grow. Low inflation, on the other hand, leads to low float growth and low yields (which was clearly evident a few years ago). While most sectors (and the economy as a whole) benefit from low inflation of around 2%, insurers grow when inflation is high and benefit from the resulting rise in bond yields plus float growth (which was also clearly evident a few years ago). Sorry, but there's even more to float and inflation (III) And it gets even more complex: Berkshire, Markel and Fairfax all invest according to value principles. In other words, they prefer to invest when markets are undervalued. This is typically the case when inflation is high and bond yields ("risk-free interest rates") are also high. And what typically happens to the stock markets when risk-free interest rates rise? That's right: valuations within stock markets come under pressure. If I can earn 6% interest on my money without risk, then a company with a PE ratio of 40 looks extremely expensive. Ideally, this causes stock valuations to fall. Insurance companies therefore generate large amounts of cash precisely when the "risk-free interest rate" rises, stocks potentially fall and buying opportunities for value investors arise. So from the perspective of a value investor this anti cyclical behavior of insurance business matches exactly their investment principle: Buy low. How do you value that? So, bottom line: What is that float worth (especially in the hands of a value investor)? Buffett says his insurance business is worth more than the respective float. But how much more? 110% or 120% seems too little to me (otherwise Buffett would surely not have been so explicit). Perhaps 130% or even 150% - or even more? I don't know, but maybe valuing "high quality float" like FFHs with 130% of float shouldn't be completely off the mark, from Buffets words alone. What do you think? Two additional general thoughts: 1. Berkshire and Buffett would never have been so successful without the "discovery of float". He is a brilliant stock picker, but so have others been (albeit few as good, which is very obvious in Buffett's early years). What is unique is that he discovered the value of float, consistently used it and made it known. Shelby Davis probably understood it too, but hardly anyone knows him. 2. "Float plus equity investment plus value investing" remains Buffett's legacy as a formula for high returns. This is demonstrated by Berkshire, Markel and Fairfax. These three are by no means the same, but they are related. It is no coincidence that these three are among the best performers on the stock market over 40 years (MKL, FFH) and 60 years (BRK) respectively. Berkshire might be Number 1 of all stocks since Buffet took over, FFH is number 8 since it started and Markel clearly must be amon the top 1%. That speaks a language. So maybe the value of float is even much higher, than I anticipate. One reason might be, that the earnings from no cost float are not equity related. Think about that for a moment. So BRK, MKL, FFH all get extra returns from a machine (think: float), that claims zero equity and that no other business has. That clearly pushes ROE. And - as Munger said: Over the very longterm you get the ROE of any investment as your return.
-
I don‘t think, you‘ll find a lot of people taking the long position for someone who died 100+ years ago… Fortunately there’s a good relationship between the Danish and the German in our region across the border. A lot of respect on both sides of the border and special rights for the minorities. Danish schools in Germany and German schools in Danmark. Political parties of the minorities on both Sodes of the border do have speciel support and rights. Would be great if all wars would end with such cultural understanding and coexistance and respect for each other.
-
So you are from Danmark…?! I come from the very (very!) northern part of Germany. Where the vaillages are named „by“ and the land has been Danish until 1866… What are your stock picks?
-
Well, personally, I’m interested in euro. That’s the currency. I have to pay my bills. So for me that’s all important. But it doesn’t make a lot of sense for me to compare my performance to the S&P 500 in euro. What would that say to me? This year the dollar lost around 13% against the euro. Doesn’t make a lot of sense to measure my performance in another currency then the S&P 500, doesn’t it? Historically, since 2011, most of my stocks Americans. So the S&P500 just felt as the normal index to compare and I would stick to that even though Canadian stocks are over half of my portfolio recently. In the context of your question and the forum here, I would think that the majority for investors here have over 50% of their portfolio in American business. At least my impression is that American stocks are discussed the most. So there might be investors here like me having more investments in Canada than in the US, but in the end, you have to find one measure of for all of us, if we are building an average. One would get a (very) rough overall impression if forum members are good in stock picking or not. Or what else could be a useful outcome?
-
Yes, it’s nearly unbelievable, how the equity investments performed in recent years. @Viking: A big thank you at the end of the year goes out to you. I don’t write too much, but everyday I drop by here and read. It’s like you would show all the little mosaics in incredible detail and than one only has to step back for getting a rich picture or better than that a movie, that shows evolvement over time. And that big thank you of course goes to all other contributors, the bigger and the smaller ones. I learn a lot from all of you!
-
My return is after tax, fees, commission, and without dividends (that's how I track): Up 29.6% in US Dollar, and 23.1% in CAD. I live in Germany, so Euro is most relevant for me (up only 14.3%), but I only have around 15% in European stocks and 55% in Canadian dollar (FFH, BN, BAM, FIH) than US dollar (30%). Biggest winner by far was Protector Forsikring (up 84% in Euro; I decided to sell some FFH and invested the proceeds into PROT, as the FFH position got too big for my risk appetite with 50+% of portfolio . So I sold FFH in October 2024 and bought PROT; it's up over 100% since and now 9% of my portfolio). FFH moved the needle the most with 43% of the portfolio in the beginning of the year, now it's 47%. BN, MKL are up over 20%, BRK, DHR, META all up over 10%. BAM is down 3%. My smallest positions are down, with Smurfit Westrock loosing 37% and Hermle 11%. At least I got the position size right... I did just some minor trimming this year. I am quite happy, as it's my 4th year in a row winning against the S&P500 with returns of 0% in 2022 (versus minus 19% for the S&P500), 29% in 2023 (versus 24%), 41% in 2024 (versus 23%) and now 30% (versus 17% for the S&P500). All results are after German tax of 26% on realized profits, fees, commissions and dividends (but most of my stocks don't pay dividends). FFH helped a lot, but not only. After all rising interest rates helped my non tech portfolio with e. g. a lot of insurers and value investing oriented investments a lot. So @John Hjorth, in which currency should we vote? I guess in US dollar? Or Canadian dollar?
-
@dartmonkey Just as a follow up, not to be misunderstood. If we are talking about ROE, then of course it’s important to mean the exact same thing. Charlie Munger once said that over the very long term, an investor’s return in a stock will roughly mirror the business’s return on equity. This statement is deeply insightful, but only if ROE is understood in an economic sense, not as a narrow accounting ratio. What Munger really points to is the idea that a business with a high and sustainable ability to compound capital – a strong economic “engine” – will, over decades, deliver shareholder returns that broadly track that compounding power. In this view, ROE is less “net income divided by GAAP equity this year” and more “owner’s earnings generated on the true equity base of the business.” For holdings and serial acquirers, the standard GAAP ROE often underestimates that engine. Goodwill, intangibles and conservative accounting can bloat the equity line, while reported earnings can lag the real value creation from smart deals and operational improvements. To get closer to Munger’s idea of ROE, it is more useful to think in terms of owner’s earnings and look‑through earnings: the economic earnings attributable to shareholders, including their share of retained earnings inside subsidiaries and affiliates. If we do that with FFH, then we surely will come up with higher ROE then what accounting is saying. And that is true, even though you are, of course, right that the true equity base will be higher. But the R is even more higher. A practical way to approximate this for complex groups is to focus on the growth in intrinsic value per share: for example, starting from the growth of book value per share plus dividends over multiple yeara, and then adjusting qualitatively for cases where book value becomes a poor proxy (e.g. very asset‑light businesses, or where market values of holdings diverge strongly from carrying values). In other words, when talking about ROE in the Munger sense, the reference is always to this economic, look‑through return on owners’ capital – not the year‑to‑year GAAP ROE printed in the financial statements. I am sure that’s how we both think, don’t we?
-
My portfolio: FFH (45%) MKL (12%) BRK (11%) BN, BAM (10%) Protector Forsikring (9%) DHR, including several spinoffs like FTV (6%) Smurfit Westrock (2%) Maschinenfabrik Hermle (a German Micro Cap with 800mn market cap. Hermle is a German leading manufacturer of high‑precision 3‑ and 5‑axis CNC milling machines and machining centres used in demanding industries such as medical technology, aerospace, automotive, tool and mould making, and optics) - 1% Rational AG (a mid cap German company with 8bn market cap, Rational AG is a German company that develops, produces, and sells professional combi-steamers and multifunctional cooking systems for commercial kitchens worldwide, with a market capitalization of around €7.5–7.8 billion) - 1% FIH (1%) My top 6 stocks combined represent 87% of my stock portfolio. 77% of my portfolio lies in insurance companies willing to invest float into equity (with the exception of Protector, one could call them „insurance holdings“ or „insurance conglomerates“). Being a German private investor I pay over 26% tax on profits and dividends. That’s an important reason, why I try to limit turnover and find longterm compounders, sticking to those even in crisis (like FFH from 2013 to 2016/2020 or MKL today). Trimmed my portfolio last year, as FFH grew to big as a percentage of my portfolio. Most of the trimming took place in October 2024. Invested the proceeds into Protector, which grew over 115% on average since than, even beating FFH big. That was my last bigger trade.
-
I don’t think we are that far apart, but my thinking is more like the following: Whatever „R“ a company has accumulated until end of year in any given year (like accounted Earnings plus hidden earnings like e. g. the 20% to 50% holdings ) should be divided through „E“ of beginning of the same year. So yes, the „E“ is higher today, lowering ROE of today all else equal - but than the same amount of hidden „E“ should have been „R“ in the years before, and we shouldn’t forget that, as that’s all important! In the released numbers of prior years that „hidden R“ is exactly missing. So when you are saying real „E“ is higher by 10% today, than you should have added those 2.5 bn dollar to „R“ in the years before, before calculating the „real“ ROE of those years. And those were years, when the „E“ was way smaller, so any additional „R“ has a more meaningful impact on ROE in those years than on todays. In other words: For every „E“ there has to be a „R“ before imho. So just applying a higher „E“ today, while at the same time ignoring the higher real „R“s (and ROEs of the years in the rearview mirror), ignores an important part of the story. It’s comparing apples to oranges. Either you ignore the higher hidden returns and higher equity until they flow through the books - or you apply for both. Of course it will run through the books later, and than there’s tax to pay etc. so you could apply a theoretical tax rate to that 2.5bn for any given year when recalculating the roe. And of course you are right, that than the real „E“ of today would be higher, so that would lower the future ROEs. As @Viking has laid out multiple times I agree that there are more hidden assets. As an example some years ago FFH sold a pet insurer for 1.3 bn. And in this forum I think most (if not all) participants were surprised, that FFH owned such a thing. Earnings were around 800mn to over 1bn from that sell decision alone in that year. I would be surprised, if we won’t be surprised again. Regarding higher „E“ as for the 2.5bn and that being a drag to future ROEs: I’d find that a rather static view as a starting point when thinking about FFHs future. Don’t the higher „real“ ROEs of the years behind us (as laid out here) point to some general overall quality of management, which will not just disappear like that tomorrow? At least I think so. So I‘d start to think about future ROEs (and potential reinvestment returns) by looking at the same metrics of the past as a starting point, instead of projecting a static (or linear) return to a higher equity.
-
+1 Totally agree. The accounted ROE already is really, really nice, but the „real“ ROE is even better (and the real look-through PE ratio). That’s one of the underlying reasons why my base case is a triple of share price over the next five years, while it could easily get to way more, if the „real“ ROE would average above 20% and the market finally realizes what’s happening. Have a merry Christmas everyone - all the best from Hamburg, Germany, to all of you!
-
I @Hoodlum, thank you. I am not a professional investor, just investing for myself, so clearly don’t know anything about that. @yqsun: I know, that a lot of shares have to been bought, my question was rather, why (or how) seller and buyer of stock find together not on the stock exchange, as I’d thought mispricing would be a thing both institutional seller and institutional buyer could get into reputation trouble: Like one of them would have to answer, why they did such a bad deal (like: „Why were you selling the funds Fairfax shares so cheap - it was obvious they would bring more on the open market“ or the opposite site of the trade being criticized like „Why were you buying a big chunk so expensive, it was obvious the price would be cheaper on the open market“).
-
sorry for asking, but whom are they talking to and why? Is it that they are expecting a better price? But why should the seller at a low price from their perspective? So is it likely for them to find someone owning a. a big chunk of FFH and b. willing to sell in the moment where momentum kicks in…?! That concept of selling for the latter only makes sense, if the owners don’t expect the price to go up more over the next weeks and months. And, I mean, owning a stock outside of any index defines you as an owner a relatively „independent“ investor in contrast to an institutional investor, so I’d assume less pressure to sell. Where am I wrong here?
-
Yes, congrats to Prem, his team! What a journey! I‘ve been sticking to FFH since 2013. And my feelings are mixed: It feels logical and right. How could this company stay overseen by Mr. Market forever? So price should go up now a bit or more. But I am all in FFH with around 45% of my portfolio in FFH and am not planning to sell a share, even if it would triple tomorrow (Is a pe ratio of 23 too much for a company with a SAFE longterm 15+% ROE, maybe even 20%+ ROE over the next couple of years? I don‘t think so, but clearly that’s a point where one might find other opportunities…?!) So the only way for me of getting a bigger share of FFH as a company would be buybacks. as I am not willing to put more eggs into one basket by selling other stuff, pay high taxes on that and buy more FFH. Still hoping for a low price in the future, as I like watching the share count shrinking over the years - but this index addition isn’t helping with that goal…
-
I think we all should be absolutely happy, that analysts don't understand Fairfax and that Markets are not fair all the time. Is it entirely consistent to benefit from a structure and system (such as the market) because it offers us purchasing opportunities, while at the same time getting annoyed when the price does not reflect the intrinsic value after we made our purchase? Why should the mispricing end? Why should we have a right to it? Who says so? We have no right to expect the market to always turn in our favor when we need it to. Those aren't the rules of the game, and there's little point in getting upset about it. Either you accept them, or you simply don't invest in this game. And better than that, we all profit from the low share price again (so we not only profited when we purchased our shares): We are all net buyers this year with every share we hold throughout the year. If things continue like this, each of us will own 5% more of this wonderful machine on December 31 than we did on January 1. And we got that 5% of a machine growing with 15% to 20% at a great discount! If Fairfax continues to grow at this rate, the price remains constant, and Fairfax puts all its profits into buybacks, then Fairfax would buy back all its outstanding shares in less than 10 years. Think about that for a moment: If Fairfax price stays were it is today forever and it would put everything in buybacks from now on and you would hold just one share for less than 10 years, you would own whole Fairfax! How is that a bad position? And with every share bought back, you get nearer to that point owning the whole (Okay, which you won't reach in the end of course; but still it shows something about the value creation of the buybacks at these prices... So we should be happy, shouldn't we?) If the market price would always mirror the growth of earnings (so knowing, what the earnings will be and discounting that), none of us would beat the market. None! Noone would have profited from BRK, as the discount of future cash flows would have resulted in such a high price in 1960ies, that it would have given the same return to us than any other equity investment at the same time. If the DCF would be 100% accurate and easy for everyone to do, if everything was transparent for everyone, if all the numbers of the future were known und understand, we would all get the same returns. Unfortunately, there is no market that always responds when we want it to. But why lament this fact? Would it really be so great if the rules of the game were such that the market always responded when and how we needed it to? Where would the fun be in that? And where and what would the art of investing, the challenge, be? And we can't change the rules anyway, and the realistic alternative (everyone gets the same return) is not exactly attractive. In other words: No Mr. Market, no buybacks. No wrong analysis somewhere in the world, no outperformance somewhere else. It's not the articles and podcasts bringing other people to understand the beauty of Fairfax (as much as you all helped me and I am really grateful!), that help us outperforming over the longterm. It's the Brett Horns. The Mr. Horns of the world prepare the ground for our outperformance. No Brett Horns, no great entry price for Fairfax for us and no buybacks.
-
That's not how I read the following sentences "The portfolio seems full of right tail options with high margin of safety. Plus 10-12% IRR ideas when levered 3:1 are 30%+ pre-tax ROE." Isn't that "ideas" referring to leverage on a single investment basis? So leverage one by one; or am I misinterpreting that? We had that same argument a few days ago, if I got it right. Where I stumbled across it. But I think it was 15% ROE that was leveraged to 45%. I didn't ask about it, but maybe someone remembers. The float argument makes sense, but I believe this leverage is currently more like 2.6 or 2.7 (and falling, as the insurance business is now growing more slowly than the investments again).
-
+1 I read again and again about the 3:1 lever they seem to use and would like to learn more about it. Is this always done by debt incurred by the acquired company? I don't imagine it's easy to get affordable financing for such a lever, unless the acquiring parent company secures the financing. I would very much appreciate someone sharing more information on this strategy and how it's done. I wonder whether Fairfax should not be able to achieve even more than 20% ROE over time. I am finding more and more arguments in favour of this. One, back of the envelope: the insurance business generates around 10% (4% interest on bonds plus 6% through a combined ratio of 94%; you can say more like 8% or 9% and that's fine). I think float to equity is around 160% (or 170%?); this would allow us to assume a rough current ROE (pre-tax) of 16% from the insurance business alone. And the equity is very roughly invested in companies (... TRS ... FV to CV ... and much of the value is still invisible even within that...) and much of it is then also leveraged, so that some investments do not yield 10-12% IRR, but possibly over 30%. Is it presumptuous to assume 12% to 15% on overall equity of Fairfax alone? Why not? That would then be a 16% return from the insurance business plus, for illustrative purposes 14% = 30% pre-tax (and pre-overhead cost) ROE. Of course, the holding company also produces internal costs (as with Berkshire), but these seem to be manageable (how big are those?) and are growing less rapidly than the company itself (as with Berkshire). And it is becoming increasingly apparent that Fairfax benefits from huge tax deferrals (as does Buffett) and that there is a lot of compounding going on within the company. In other words, the profit itself is concealed or hidden. It is not the entire profit that is taxed, but only a small portion of it that is visible. So if, for example, we assume a tax rate of 20%, this is not based on the gain in intrinsic value, but only on the nominal profit. So the "real" tax rate may only be 10% on the "intrinsic gain" (please do not take the 20% and 10% at face value; this is only to illustrate the point). If "real tax" on intrinsic value would be more like 15%, than we'd end at a bit over 25% ROE and would only have to subtract the overhead cost from this. I just wanted to express the structural idea of whether one could also look at the whole from this perspective with such a framework. The figures are, of course, questionable. Is 10% return permanently possible in the insurance business? Where is the margin of safety factored in here especially into the equity part of Fairfax (it isn't!)?
-
@73 Reds: Totally agree! So what can we learn? 1. Good returns can be done in boring areas, not the fancy ones! 2. It wasn’t that obvious to invest in BRK 13 or 23 years after Buffett took over. You had to a. understand the business concept (float etc.) and b. be happy with only 1 or 2 decades of business history in c. a situation where the Berkshire of - say - 1985 wasn‘t the same than the one from 1980, which was very different from the one 1975, which was major different from when Buffett took over. So you had to understand the float concept, which was just implemented over time along the way, trust the jockey, and have the guts to invest into something „new“, that changed continuously. And there was no „older version“ of Berkshire, like we have today, when watchibg the Berkalikes. People weren’t dumb and we are not better today than people were in the 80ies. Basically I see Fairfax today as a bit of a similar opportunity. Of course Buffett is not Watsa and today isn’t the 80ies. That’s not my point. But the concept rhymes and the situation. Fairfax is I think as big as BRK was in the 90ies, Watsa knows about the power of float, invests equity into stocks, is a value investor, pays nearly no dividend, knows a thing about culture, has a small team at the head office… Both companies (and Markel) are within the best stock performers since present management took over. Well, from my perspective, that’s not totally different.
-
My thoughts: 1. High price of one share. One share cost over 1.000 dollar most of the time (not in 1980 and 1981 or so). People don't like to buy shares that are so high. It's a bias. But people don't like buying penny stocks and they either don't like buying a stock for 1.000 dollar (how much is that 1.000 dollar from around 1982 inflation adjusted to today?) At least that was the reason, why Gayner hadn't bought it beginning of 1980ies. 2. Buffett wasn't talking other people into BRK. No Marketing. 3. Insurance is boring. Nifty Fifty were the cool stuff. Japan. Tiger states. New Market. "It's not fancy talking about an insurance stock on a cocktail party". 4. Relatively high price of BRK in terms of e. g. PB Ratio. If you don't understand the business, you might think there's reversion to the mean. Although pb ratio was below 2.0 pb ratio for most of the time, the average insurance stock was valued way cheaper on average. I know a bit about insurance because of Warren and his idea of float and its value. I think before Buffett, this was hardly discussed. There was just no Berkshire before Berkshire (btw: Was Davis well known in the 80ies and 90ies?!). 5. As far as I know the "Buffett hype" began more like end of 80ies. Until than there were only little news articles about or from Buffett. I know: There are some famous articles, that are often cited. But there aren't that many in the beginning of the 20 years timeframe we look at here, and they were lost in the noise of the stock market articles. Growth of BRK was very high in the 70ies; but it was a small business. So it needed some time to get big. People don't write and read a lot about mid caps. 6. Looking back, it's incomprehensible, that BRK wasn't more expensive. But there was a premium for Berkshire compared to other insurers; it just wasn't high enough from today's perspective. 7. Today the "Buffett System" is known and discussed in depth and very broadly. That wasn't the case beginning of the 80ies. 8. I think Quality investing was rather unknown and not as widespread as it is today. People were reluctant to pay a premium on the price, even if the company was good. Look at Berkshire itself: Munger had to talk Buffett into quality. This more a "grey" argument, but I think today there's more quality investment investors (especially after the financial crisis). 9. The investments Berkshire did in the early years weren't quality. If you're a quality investor, you might have had a look to BRK, but if the investments within BRK weren't felt "quality" (but the opposite), and you had to pay a premium, that doesn't go together very well. 10. 1980 BRK under Buffett had a track record of 13 years, 1990 23 years and 2000 33 years. Looking at myself I want to see a longtime track record. 23 years seems to be a minimum. There are a lot of people not buying Fairfax and Markel as those are not "old businesses" having a track record of only 38 years. Those 38 year old businesses are called "Baby Berkshires". I guess, a 13, 23 (and even 33 years) track record isn't long enough for a lot of people. 11. BRKs stock price sometimes went down over 50% (was it three times from 1970 to 1990? Unsure, but sometimes that happened). So BRK wasn't like a steady winner in each and every year (there weren't a lot of steady winners in those years I guess). People don't like volatility. And they don't like to pay a premium, if e. g. 5 years before, the stock was valued at a similar premium and lost 50 percent. 12. The Buffett system is known and understood very well - today. Float plus Value investing plus a small team plus investing a bigger part into equity (and into wholly owned businesses). Buying back stock. Owning (and buying) assets and stocks with hidden value (like Blue stamps). If you don't understand the power of float etc. you just don't buy it. 13. In the 1970s, there was still the textile business, and this industry was (certainly visible to many investors) in serious crisis. The restructuring took some time. It's perhaps like Fairfax and Blackberry: what didn't go so well lingers in the memory for a long time. 14. At the end of the 1970s, Berkshire also had problems with its insurance business and suffered major underwriting losses. 15. From 1973 to 1975, the share price halved (see also above). 16. Many investors love simple business stories. A bank, a car manufacturer, an energy company. Berkshire had a newspaper, an insurance business, textile companies, Blue Chip Stamps and sweets, etc. Many investors will have been put off by this smorgasbord. 17. Again the track record beginning of 80ies and 90ies: Berkshire wasn't easy to understand, as ist changed all the time. From Textile to insurance and other ingredients. And then from value investments to quality ones. So when only looking in the rearview mirror in the 80ies and early 90ies, those returns always came from another episode, that just lied behind and weren't giving any information about the future. So you had to bet on the jockey and his ability, rather than on an intact investment story over X decades. 18. Maybe float of BRK stock wasn't big enough for big investors to buy in? 19. Institutional imperative: It's hard to buy something so special. If you're wrong, investors will ask you, why you bought such a (dubious) thing at a premium, that's not part of a big index. My best guess is, that it's a combination of all those and a lot of (!) other factors. My overall thinking is a bit like this: Any company with an ROE of, say, 18% (this is just a random example) that can reinvest at the same rate will double its book value and more or less its share price every four years. That's a 128-bagger after 28 years (since 1997 until today), a 256-bagger after 32 years (since 1993), a 512-bagger after 36 years (since 1989) and a 1,024-bagger after 40 years (since 1985). It is evident that the further back you go with such extreme ROEs, the clearer it becomes that even unimaginable purchase prices would still yield very good returns. The initial price in any share with such returns appears absurdly low after 2 decades and more. So when your question is asked after X decades, we think: "It must have been so obvious. One could have paid multiple times the price and it would have been a great investments still. Why hasn't anyone seen it?" You could probably have paid ten times the price for Fairfax Financial in 1986, and it would still be among the top 1% or 5% of the best share investments. I just want to point out, that such extraordinary returns make the question of yours more fascinating, while at the same time, we as investors often just don't understand the power of compounding in every moment (think: "Today"). Every investment with 15+% returns will give us back so much over time, that 20, 30 years from know, it seems like a no-brainer to buy this stock, if we look back. But in any moment there's so much noise. People talk about Bitcoin, Military stocks, AI etc. But there will come peace and after AI there will be Quantencomputer; and maybe that will turn around tech totally or it might be the end of Bitcoin too etc. Still people think they know, how live will end up in 20 years. And they think, if there appears a fancy new technology, a new topic, that investing into any of those new tech stocks will bring extraordinary returns. But that's wrong most of the time. Who invested into internet stocks in the dot com bubble was right, that the internet would change our live totally. But 99 of 100 of those business models weren't good. It was the same with railway. That were very bad investments, while people were right, that its transport capibillty and the speed would change the world dramatically. But people always think they can pick the winners within those fancy sectors. It's a bias. So those interested in stock market more often than not are "gamblers". They like the adrenaline. That's why they head to the stock market. And I think Berkshire wasn't fancy. Insurance. Hard to understand. Boring. Textile business. Oh my god! Really? Blue Chip stamps. Boring. Candy. I like it, but that's something for my kids. I could invest into Japan, there's so much going on in Tokyo these days. Newspaper? That's 100 years old. What's the story? That's boring. Japan sounds fancy. They don't even pay a dividend? And where's the stock price? What? 4.000 dollar??? 20.000 dollar??? For candy, Blue chip Stamps, Insurance and Textile businesses? Sorry I am out. That can't go up any more. 18% per year over 30 isn't fancy. A 100% return per year over 2 years and a cool AI story is.
-
Thank you, @djokovic1, that is an interesting comparison! The valuation of Markel (and Berkshire) in comparison to FFH was one reason, why I shifted my shares from 2020 onwards. Today, my portfolio looks like this: 45% FFH, 9% MKL, 12% BRK, 9% Protector Forsikring. So 75% of my portfolio is in insurance companies, with Brookfield (BN/BAM) accounting for another 7% and Fairfax India over 1%; both also have insurance shares, which would bring the total "insurance-related" part to 81%. Purely from a pricing perspective, I would like to focus even more on FFH (and on Protector) and reduce MKL and BRK. The problem is that I would lose about 25% of the MKL and BRK volume sold in a switch process (due to taxes in Germany, spread, trading costs; BRK and MKL have multiplied, so that almost only profits remain and we pay over 26% tax on stock related profits here in Germany). And I would also like to be diversified to a certain extent. And I have found that luck can change between MKL, FFH and BRK. FFH was the big winner in the financial crisis, but not in the following Voldemort years. Markel performed very well for a long time, but that has now changed. However, I still see MKL as an outperformer in the market in the long term and the risk is different from that of Fairfax. MKL has also achieved a 15% ROE over 35+ years; not bad in my eyes and I trust management. And Berkshire? It has also had its good times since 2007, but of course it no longer comes close to its historical returns looking forward. But it is no longer really an insurance company. Which, given my high concentration in this business of 75%/81%, is perhaps not such a bad thing. I see BRK almost more as a diversified holding company. And Protector is hopefully simply what the other three mentioned were in their early stages. In any case, the past 20 years of Protector look good and I don't see them changing the strategy, risk profile etc. I am always thinking about balancing the risk (and award) in the right way. But it just gets hard, when you are relatively concentrated from the start and one hits the ball out of the park. Watering the weeds and harvesting the flowers is not a good strategy as we all know. But what do you do when you have some nice flowers and others that are even more beautiful? At least, that's how it feels right now. (Any suggestions welcome!).
-
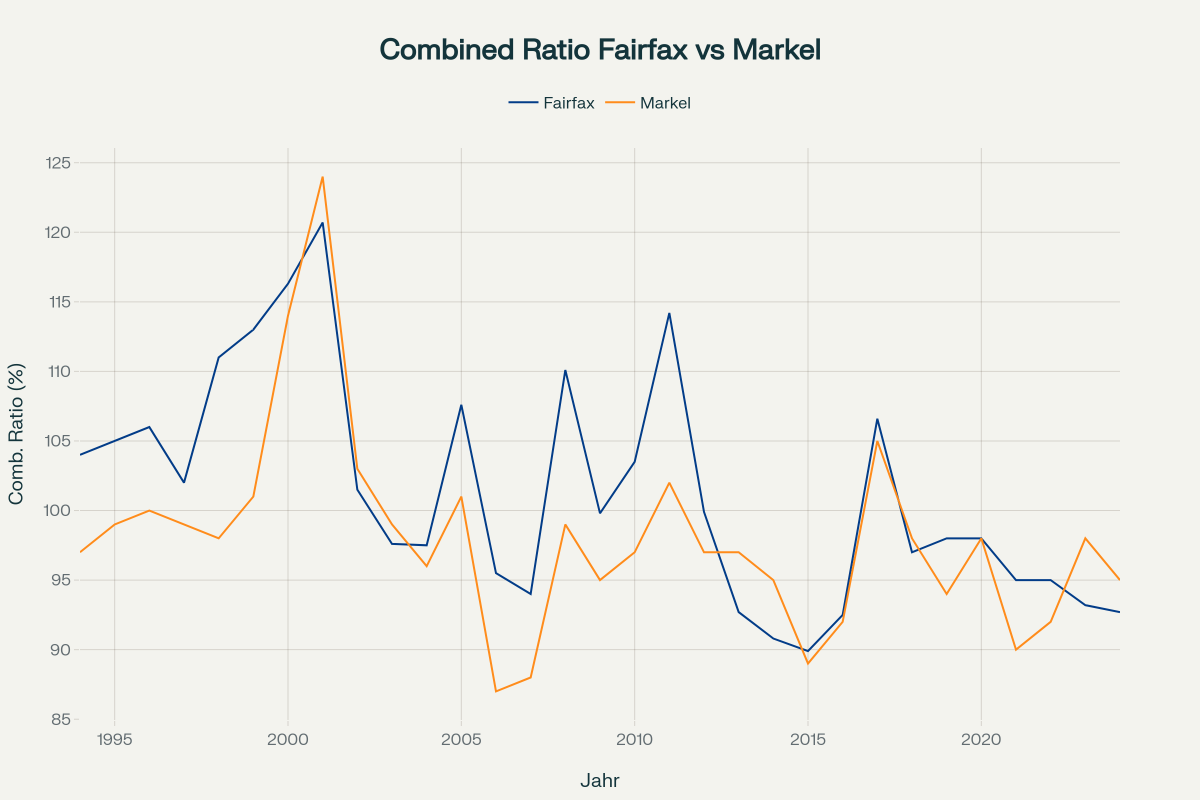
The Combined Ratios of Fairfax Insurance Business over time: From bad to good! I finally managed to use AI to turn some tables into graphs (don't ask!). I gathered all the data for Fairfax, Markel from annual reports (no guarantee that it is always correct) and the rest from an extended internet research. Here are the graphs and the most important findings: 1. Combined ratio of Fairfax vs. Markel over the years First, let's take a look at the CR comparison: What stands out? Markel was significantly better than Fairfax for a long time, but that has changed over the years. Since around 2013, both lines have been very close to each other, and in recent years Fairfax has even become slightly more profitable than Markel. I bought both companies around 2011 first; my expectation was, that Markel would stay the winner maybe even as long as forever. So for me, this is spectacular, looking back 14 years later and watching such results. The overall trend is even more evident in the 5-year average: Fine. So Fairfax has been about as good as Markel since around 2012 or 2015, after being about 5 percentage points worse than Markel in many years. The only convergence of the lines around 2001 (slightly later in the 5-year chart) is related to 11 September; so we can safely dismiss that as a one-off event. What does this tell us? Could it be that Fairfax has become significantly more profitable overall in structural terms? After all, we are not comparing Fairfax CRs with average longterm CR figures here; rather, we are comparing with another company, that is exposed to the same trends (e. g. soft market, hard market). 2. Let's take it one step further: Let's compare Fairfax with the P&C US industry Here, too, we see that Fairfax only briefly outperformed the market after 11 September 2001; apart from that, Fairfax rarely matched the market's CR until 2011; often, the CR was much worse, sometimes even 7 percentage points. This changed around 2011. From 2011 to around 2016, Fairfax was significantly better in some cases, and has been since 2021 as well. In between, Fairfax roughly mirrors the market. This is even more evident when you add up how Fairfax has performed relative to the market over the years: To explain the red dotted line: the right X-axis shows Fairfax's cumulative overserving over time in percentage points of the combined ratio. So the red dots show, that Fairfax had underperformed the P&C US Market by a total of almost 30 percentage points between 2000 and 2011 (i.e. slightly more than 2.5% per year). Since then, the red dotted line has risen steeply, with a pause only between 2016 and 2020, ending at around 20 percentage points of outperformance. In the 13 years since 2011, Fairfax has thus made up a total of 50 percentage points (from minus 30 to plus 20), or just under 4% per year. Bottom Line: What a difference! Until 2011, Fairfax lost 2.5% percentage points per year against the average US P&C company, but since then Fairfax has gained 4%. In other words, Fairfax's insurance business (which is not only US) has become about 6.5% percentage points more profitable in relation to the market after 2011 (compared with the timeframe 2000 until 2011 ). Why? It has already been mentioned here many times: Andy Barnard has been president of Fairfax's insurance business since 2011. We can only be grateful to him!!! Are Fairfax's good CRs here to stay? Compared to the market, I would say: it looks that way. Is Fairfax's insurance business independent of general market movements, of soft and hard markets? Absolutely not – the curves do not show this. One more note: this comparison is flawed! Fairfax has (increasingly) insurance business outside the US. And yet I am comparing it with the P&C US market – which is methodologically completely inaccurate. In my view, however, it is still the best comparison (after all, the US market is still the largest for Fairfax) if you don't want to go to enormous effort. My only goal is to gain a rough initial overview – I consider this approach to be legitimate for that (and only that!) purpose.