Hamburg Investor
-
Posts
230 -
Joined
-
Last visited
-
Days Won
2
Content Type
Profiles
Forums
Events
Everything posted by Hamburg Investor
-
Insurance - The Engine That Drives Fairfax
Hamburg Investor replied to Viking's topic in Fairfax Financial
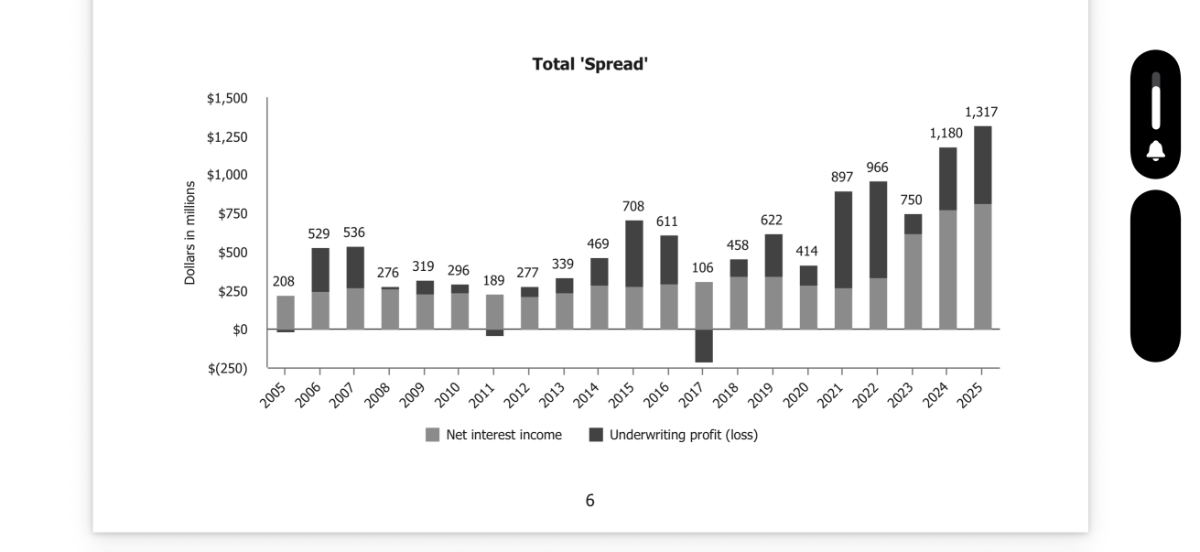
They have mentioned it but definitely less than BRK and FFH. Tom has something to say about the BRK model, maybe he uses his own words and own framing, instead paraphrasing Buffett? E. g. here, where he writes about the „spread“ in his 2025 shareholder letter. https://s202.q4cdn.com/749045284/files/doc_financials/2025/ar/MKL-12-31-2025_ARS.pdf BTW: I really like the 5 year financial results table in Toms shareholder letter.
-
Wow, now I get your point! What makes this strategy genuinely brilliant is a layer most investors miss and one I hadn't fully internalized until now: regulators force insurers to hold low-risk fixed-income assets with the float, which at first glance looks like a constraint that caps returns. But by structuring acquisitions as convertibles etc., Fairfax hijacks precisely that regulatory straitjacket and turns it into a compounding acquisition engine. The "boring" bond portfolio isn't just parked capital anymore, but it's quietly pre-financing takeovers at locked-in prices, subsidizing itself through above-market coupons along the way. When conversion finally hits, Fairfax owns the company at a cost basis that the open market never had access to. Funded largely by the target's own interest payments. The float isn't the constraint. It's the weapon.
-
Could you please explain the mechanism you have in mind in more detail? I think I forgot or misunderstood that too. How can the turnover of float (so about the 25bn you refer to) be used as a debt like funding? I always thought that the invested float is regulated. So like in fact most of it has to be invested into bonds and only a small fraction in equity. So if you'd invest a bigger portion into equity and change the "risk" (from a regulators perspective) when turning over after two years, you'd loose your rating. As the float returns from my understanding go straight to the holding (and you seem to refer to the float turnover, which from my understanding has nothing to do with returns). Of course the insurance subsidiaries could change the debt level; but again that would change the risk from a regulators perspective I guess. In fact I am missing the link between "turnover of float" and "opportunity to buy equity" without changing what regulators define as risk. Would be great to learn more about that. @SafetyinNumbers
-
Thank you, @Viking! Great post! I was aware about a lot of the aspects, but I wasn't aware, that Thorndike put that into such a nice book; I will read it! Thanks! With FFH, BRK, MKL, BN, BAM being at the core of my portfolio, I am heavily invested into longterm compounders where the CEOs have aspects of that way of thinking. Your article was a starting point for me regarding checking my own investments and lookin for new and smaller ones. This was not done systematically - but maybe someone is interested in the results, that Perplexity found in that process. Please find attached! Some companies just don't fit really and a lot of criticism could be done, but I think it works as a starting point for further investments; at least for me. Would be interesting to learn, in which of those others here in the forum are invested. I am invested into Protektor (10% of my portfolio; I sold some FFH shares two years ago as it just became over 50% of my portfolio and that felt too big for me; and invested the proceeds into Protektor, which doubled since than), FFH, MKL, BRK, BN, BAM, DHR and Rational (just a small fraction; they build cooking systems for a la card and Franchise restaurants; world leader in that sentiment; too expensive for me to invest big). outsider_investments_table_en_colored.html
-
Those words of you resonate a much with me. It mirrors my situation a lot; being located in Germany I never (!) met someone live being interested in Value Investing. We have a lot of speculators here, and all the more, when the markets are up and when daily news writes about it. I got asked two weeks ago about SpaceX and if I would invest into it. I didn't even know about it and said that frankly... People know I am interested in stocks, and if it gets to stocks (which is not very often as no-one is taking time to read about; you just don't learn about stock investing in school, not from your grandparents or fathers... It's just no-one is invested longtime) always ask me for Bitcoin and Tech. That's so typical for Germany. Investing is on noones radar; speculation is. They all want to get rich quickly and when they ask for Tech, I tell them "I don't know about that stock. Only thing I know is, that Tech is not among the best sectors to invest, if history is any guide; the last 20 years are an exception from the rule". I really like reading your stuff too, @Maverick47. Thanks! Where are you from?
-
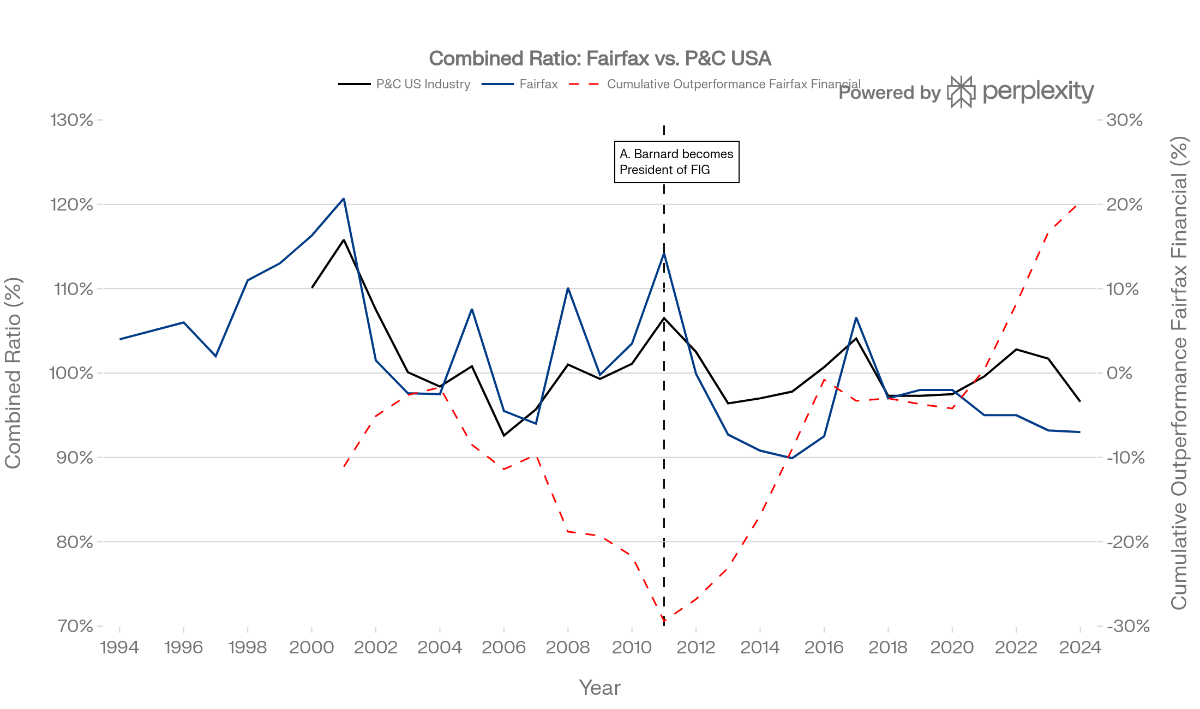
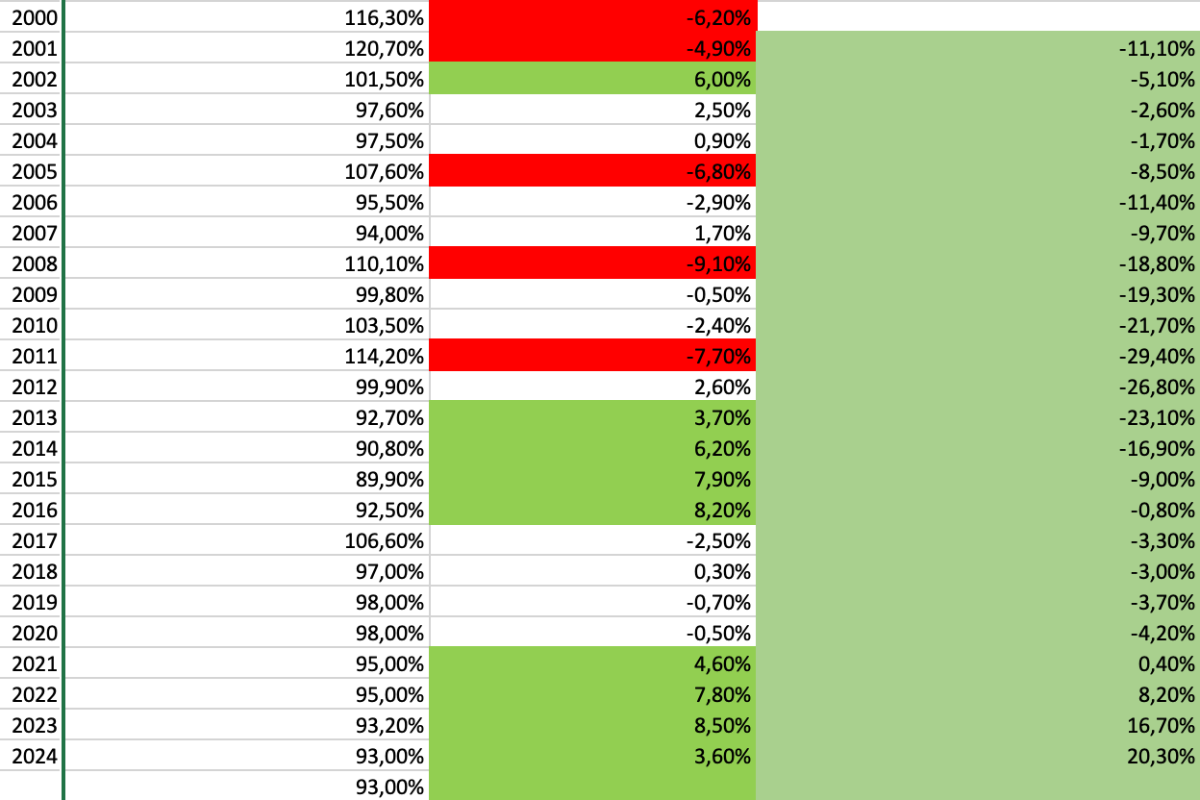
Same Company, Different Underwriter: How Fairfax Went from 4 Points Below the Market to 4 Points Above It – In a Single Year FFH Was a Bad Underwriter. Then 2011 Happened. It Hasn't Looked Back Since. I've been digging into Fairfax's combined ratio data relative to the average U.S. P&C insurer, and I want to share what I think is one of the most compelling changes in the Fairfax story. I'd also genuinely love to hear pushback from those who see things differently. The Data: A Clean Break at 2011 When you measure Fairfax's combined ratio against the U.S. P&C industry average year by year, the picture is striking: Before 2011: Fairfax underperformed the average U.S. P&C insurer by roughly 2.5% to 4 percentage points per year, depending on the starting year you choose. 2000 and 2001 were really bad years (the red dotted line directly starts below 100. 2002 to 2004 was the exception). From 2000 to 2011 the yearly percentage points, with which FFH lagged the average US PC Insurer summed up to nearly 30 percentage points. From 2004 to 2011 it's nearly a straight line of underperformance: The red dotted line in all but one year (2007) dropped. After 2011 until 2025: Fairfax has outperformed the average U.S. P&C insurer by roughly 4 percentage points per year – consistently, and in aggregate that summed up to 50 percentage points over 13 years running. The swing in relative underwriting performance between the two eras is approximately 6.5% to 8 percentage points per year. In insurance and watching nearly a quarter century, that is not a rounding error, that's not a coincidence. That is the difference between a mediocre underwriter and a genuinely excellent one. These are two fundamentally different businesses. Why 2011? What Actually Changed? Andrew Barnard became President of Fairfax Insurance Group in 2011. Those who have followed Viking's and others exceptional write-ups and scissions on Fairfax will already know how thoroughly he documented the cultural and structural changes in Fairfax's underwriting discipline around this time. What changed in practice was substantial: underwriting authority was decentralized to individual business units, accountability for combined ratios was tied more directly to management, and a culture of underwriting discipline replaced what had previously been a more growth-oriented, volume-first approach. Reserve adequacy improved. Lines of business that were structurally unprofitable were cut or restructured. The result was not a gradual improvement – it was a near-immediate re-set of underwriting culture that showed up in the numbers within the first few years and has held ever since. This is not correlation dressed up as causation. The mechanism is documented, the timing is precise, and the results have been durable. On Acquisitions: An Argument For, Not Against A legitimate question is whether part of Fairfax's CR improvement after 2011 reflects the addition of better-underwriting businesses through acquisitions – Brit, Allied World, Gulf Insurance, and others – rather than purely organic improvement. I'd actually argue the opposite: the fact that Fairfax consistently acquired and integrated businesses that improved rather than diluted its underwriting performance is itself evidence of better management judgment. Pre-2011, Fairfax had a pattern of acquiring businesses that added underwriting volatility. Post-2011, the acquisitions have been disciplined and, on balance, accretive to underwriting quality. Isn't that another data point showing, that the strategy has changed and that FFH after 2011 had a hunger for another type of insurance company? It is also worth noting that North America remains Fairfax's dominant market. The core North American insurance operations – Northbridge, Odyssey Re, Crum & Forster, Zenith – have driven the bulk of earned premium throughout this period. The structural improvement is not an artifact of geographic mix-shift toward more profitable international markets. The house was rebuilt from its core. That's why I think it's not perfect, but legitimate to compare FFH with the US PC insurance market. On the "Hard Market" Argument – I'd Genuinely Like to Understand It A view that comes up frequently here is that Fairfax's strong recent underwriting results are primarily explained by the hard market. I want to engage with this seriously, because I may be missing something. Comparing Fairfax's absolute CR today to prior years would indeed be misleading. Combined ratios move with the underwriting cycle. A 93% CR in a hard market is not the same as a 93% CR in a soft market. Agreed entirely. But this analysis doesn't do that. It compares Fairfax to the average U.S. P&C insurer in the same year, every year from 2000 to 2024. The industry index experiences the same hard and soft markets as Fairfax. The comparison re-calibrates automatically each year: "What did the average U.S. insurer achieve this year? How did Fairfax compare?" In a hard market, the average U.S. insurer also improves – so Fairfax gets no automatic credit in this analysis simply for operating in a favorable pricing environment. The market cycle is effectively stripped out by design. So my genuine question is: Does the latest hard market and the softening market of today somehow benefit Fairfax disproportionately relative to its U.S. peers in a way that a relative comparison would not capture? If so, what is the mechanism? I ask in good faith; not to score a point, but because if there is a flaw in the methodology, I want to know. On Volatility: Less Than You'd Expect One final observation that I find genuinely surprising: the year-to-year volatility in Fairfax's relative performance since 2011 is remarkably, relatively low. Yes, there are exceptions: 2017 stands out, with major hurricane losses pushing Fairfax's CR above the industry average in a difficult year for everyone. That is exactly what you would expect from a company with meaningful catastrophe exposure, isn't it? And the following three years FFHs performance was nearly mirroring that of the average US PC Insurer. And yet, the red dotted line has been remarkably consistent; no harsh ups and downs. The red line in the chart doesn't meander – it trends upwards at the same pace, year after year, with a small step back and a pause. But In 9 out of 13 years FFH outperformed the market between 2.6 to 8.5 percentage points; wild and different years with hard markets and soft, through COVID, through cat years and quiet years alike. For a company that critics have historically described as an unpredictable, volatile underwriter, that consistency is itself part of the story. The Bottom Line Fairfax was a structurally below-average underwriter for many years. In 2011, something changed – sharply, lastingly, and with an identifiable cause. For 13 consecutive years, Fairfax has outperformed the average U.S. P&C insurer. The gap between the pre-2011 and post-2011 eras is roughly 6.5 to 8 combined ratio percentage points per year, driven by its core North American operations, sustained through acquisitions, and more consistent than its historical reputation would suggest. That does not look like a market tailwind. It looks like a structural transformation that happened in one year and has compounded for 13 (or 14; I guess the 2025 combined ratio for the US PC businesses will be above 93%). What am I missing?
-
+1 All great points.
-
Isn‘t float the lever, not premiums? And float is more in the direction of double equity (less, if we count in all the hifden value). And 2 to 1 is relatively high leverage, isn’t it? Yes, I guess the float leverage should go down over the years. But there are some ingredients in FFH, that are quite different to BRK: 1. FFH: A real worldwide insurance foot print I am pretty sure, that FFH has the widest geographical insurance business. They are on all continents. FFHs premiums come not lnly from the USA an Canada; they come from Ukraine, Arabia, Poland, Asia, South Africa, Botswana, Vietnam, Singapore, Brasil, Colombia, Uruguay, UK, Germany, France, Hongkong, Indonesia, Sri Lanka, … It‘s over 30 countries. This might be a great opportunity to keep growing, as there might be opportunities in strong growth countries. Like India, but there are a lot of other emerging markets in Asia and orher parts of the world. BRK never focused its insurance businesses in other countries - I guess it’s below 10. At FFH going to a lot of countries is a strategy. It’s great to be, where the world grows. I am pretty sure, FFH will buy more Insurance businesses and grow that number actively over the years. GIG was not the last deal to grow thhe footprint. 2. FFH: Smaller insurance businesses than BRK FFH has 20% of its insurance businesses in mostly very small businesses. These are - again - the ones located in other countries. But the argument for growth here is not the same: Small businesses tend to grow stronger than big ones. Yes, big portions of the premiums are in relatively big insurance companies like Zenith, Allied, Crum & Forster, Odyssey, Northbridge. But still 20% is in those small insurance businesses - and we see this portion growing from year to year. Be it alone - or through investments from FFH itself. 3. Culture & Learning from others. Apart from being located in 30+ countries, which are partly growing strong, and apart from buying in into new countries over the years, and apart from the fact, that those small businesses tend to grow stronger than the big ones, culture and the opportunity to learn from each other is another growth driver. Say, you are a small insurance business in a small country. Isn’t it a great opportunity to learn about AI strategies from other insurance subs these days and maybe even share cost for developing new tools? An insurer in Botswana clearly is no competitor for an indian or Brasil or German insurer. So why not share best practices with each other? I am pretty sure, that leveraging opportunities like these between 30+ businesses will help the small insurers a lot. I don’t know if that happens today, but why shouldn’t they do it? I guess being an insurer in Botswana, being backed by FFH gives a lot of tailwinds to you and helps keeping the course, handle critical times, get cash to invest, if opportunities arise, keep costs down - and, as a result, grow even stronger. Imho although I agree, that FFH in 10 and 20 years might be leveraged less, I don’t see the float leverage to come down at the same pace than at BRK.
-
I was just referring to the past. Yes, averaging down is harder today; on the other hand buybacks were around Zero in the 1930s if I am right. And today it’s at 2.2%. And buybacks are not so different from averaging down - you’re getting a bigger part of the whole (and it’s even more tax efficient for A lot of investors than divs). So together that’s more like 3.2%. That can easily grow to 4% or more in a crash scenario. Not great, but if you find good businesses at reasonable prices (I‘d happily buy FFH 20% off from Fridays close… ) not bad either. If one is a longterm holder of stocks and doesn’t have to sell for 5 to 10 years, a normal bear market will not end in a disaster imho. Time and Buybacks (and a little bit of divs) will help to head even stronger into the next bull market. If you have to sell bigger parts of your portfolio within 5 years - that’s not so good.
-
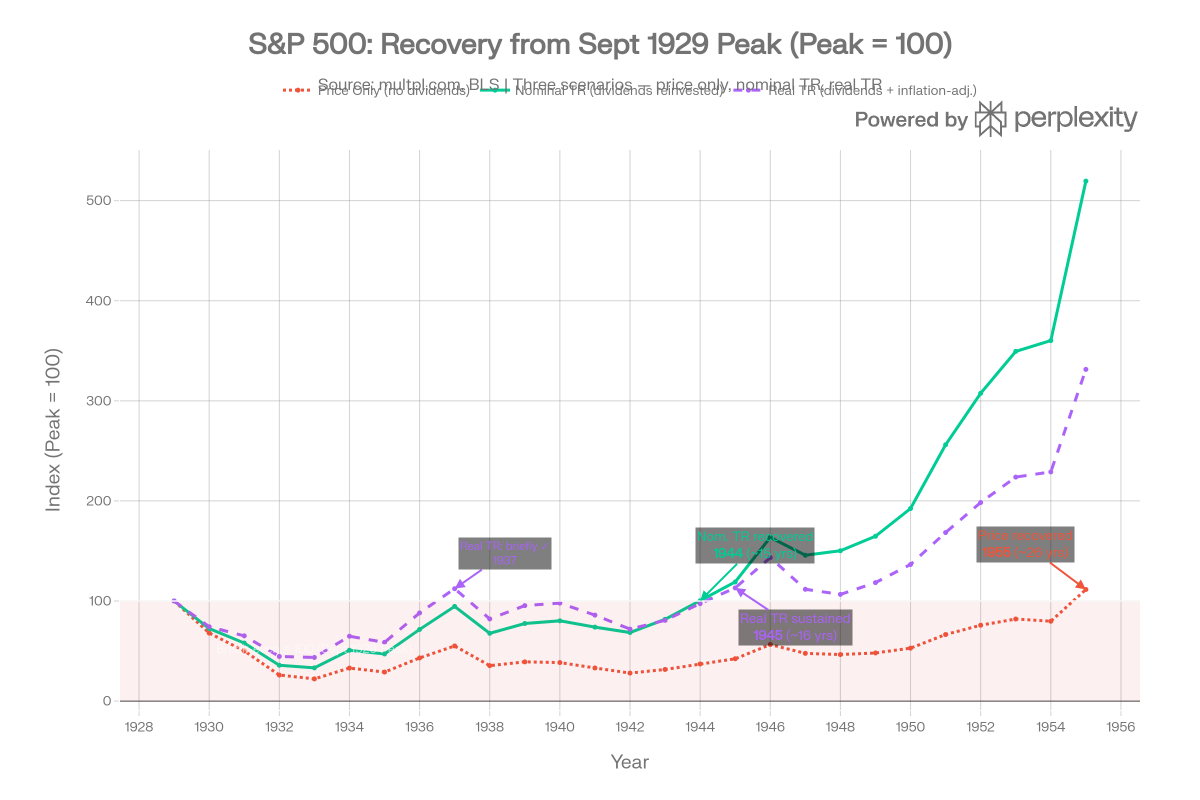
Historically it came from dividends (spiking after 1929) and inflation (deep deflation). With dividends reinvested and looking at real returns recovery happened as soon as 1936 (!) instead of 1954. It went down a bit below the recovery line after 1936 until 1944 again; in parts wwii was a major reason. the outcome was over 3x in 1954 with dividends reinvested (real) and over 5 times (nominal) compared to the chart without dividends. Of course that’s only history. And it’s without taxes, costs etc.
-
I didn’t understand his points either. You‘ll never know where stocks move to. Their might be a financial crisis, a scandal, a big hurricane or a war with Iran around the corner or the risk free yield night implode or explode tomorrow. AI changed a lot stock process and Quantum computers might too in future. There’s just no calendar for planning such things. In Germany the Berlin wall fell overnight. So if price moves are a concern, than don’t buy stocks. That’s not a FFH topic. And there were a lot of assumptions regarding this board, where I‘d disagree and would have been interestibg to understand why snd how he came to conclusions, e. g. that most of us only know the last 4-5 years (I‘d guess, the overwhelming part of writers here have owned FFH some time before 2022/2021; some a lot longer than being in this forum, like me). He seemed to have a clear picture who we are, how we think, putting people in Drawers, without laying out, how he came to that conclusion. He asked, became an answer from me with feedback, but hasn‘t even replied. No problem with that, but putting that together with reading the other answers at least I don’t found a lot of data points here bringing me to the conclusion, him being interested in layibg out his rationales or being interested in a discussion. Which is fine, but if you don’t want to discuss and learn and think about your rationale; why do you go to a forum?
-
- How do you know that? My impression is a totally different one: That those are only very limited. Most posting here are either longterm holders or they were in before 2021 sometime. That’s a tiny tiny percentage of all FFH holders and I don’t know if you are referring to those posters here or if you have other data points; would be interesting to learn more about that. I don‘t follow you here. The price decline isn’t unexpected for the most writers here. Most people had no „expectation“ at all regarding the price. And I can‘t recall anybody predicting any price at all anytime and I am reading constantly nearly everyday here. What I read is, that people are happy or unhappy if the process goes up or down. Some want it to go up fast and others slow or later (like me). But that’s not the same as expectation or prediction. There was a fun question some time ago, if we‘d think the price would be over/under x dollar in 2027 or so. Were you reading that as an expectation or prediction? I didn’t read it like that. Nearly all writers here seem to reference there postings on intrinsic value. Price is debated often, but I don‘t read anybody „expecting“ or „predicting“ any price. Guessing for fun about pricing in x years? Yes. Thinking about longterm results? A lot. But that’s a big difference to expectations and predictions. My perception (which might be wrong): The individuals having a big portion in FFH here in the forum are from different ages - not in there 20s and not so many in there 30s, but all other ages. Most were putting a lot into FFH between 2020 and 2022. And than it compounded rapidly. Don’t agree. Noone knows anytime, why a stock goes up or down shortterm. So it’s the realistic, everyday situation, that people tell them only guesses to spouses if they should (and the should not!) tell them anything about price moves, why a price changed. I can tell my wife, why I think FFH will be worth much more in 10 years than it is today. And that’s what I do. I tell her, that it’s a good business in my view, not a stock. But I always tell her, that this only means the chances are relatively good, that FFH will be selling a lot higher in 10 years compared to other things, we could put our money to, and better than the average, but that the Market is crazy, so that price could all be different, as there’s a Mr. Market etc. Telling a narrative about stock price evolution should be avoided imho anytime, as it could give listeners a wrong layer of security feelings; as if price would be predictable. And if that layer of explaining breaks, which ultimately will happen, when prices fall, emotions get through and people/spouses do irrational things, won’t believe you anymore etc. And for a reason. Every narrative about stock price evolution - the more over half a year - is just nonsense. So when you write, that having no narrative for explaining the shortterm moves would be a bad situation, than I totally disagree. The fault happend before on your site imho: You were telling your spouse nonsense about the „why“ before, as there is no „why“ shortterm and often not even longterm. At least, that’s what I always tell my wife: „I don’t know, why the stock went up or down now and I do not have any idea, if it will move higher or lower.“ I don’t know how often I told her, that Mr. Market is not predictable. We discussed, if FFHs business could really be worth double as much in less than 2 years; we came to the conclusion, that this was nonsense, which shows, that price should not be taken too serious. „Only thing I can tell you: Fairfax is firing on all cylinders these days and Mr. Market doesn’t offer enough money for that.“ That‘s what I told her often and still tell her. I don’t get this question. It’s based on a false assumption. Any stock could be worth less in five years, crash, or skyrocket… By definition, you only know what has happened to stock pricings of any stock over the next 5 years after the next 5 years. How can you base a decision on that today? That’s the case with every single stock, not FFH specific. So it’s a misleading question. If we knew which stock would go up before, we should buy it. But why think about something, that obviously isn’t possible? In another post before you were adressing that FFHs share price was lead by the insurance cycle (you named the soft markets) in a major way over the decades. Is there really a pattern, that’s so clear? I never analyzed price patterns in depth, but it would clearly be an interesting finding, if there is such a pattern! My gut feeling (and it’s nothing more, I could be totally off here!) would be, that there were other patterns (e. g. hypes and short attacks, bad insurance years, derivative bets). Do you have more information about that pattern to share? I would not suggest that. There is no use in trying to find clear winners on the stock market over 5 years, even 10. Anything can happen anytime. Imho if you’re investment horizon isn’t long enough, or if a potential loss is no option for x per cent of your portfolio, than you shouldn‘t own stocks with that.
-
I get the point, but at least I don't think, that's helpful, if we try to get to the ROE of FFH. To me, that's the real question. As nearly all FFHs earnings go back into the business (or in buybacks) and only a tiny bit gets paid out, overall growth and ROE should be relatively near to each other. As a rule of thumb I better like to think about FFH by comparing BVPS in one year and BVPS a several years later. Than adjust bvps to the big "wrong" numbers in hidden value in both years - starting and end. And than you get to a cagr between those two points and add 1% or a bit more to the CAGR for the dividends. To me that number you get to seems to be reasonable near to the "intrinsic ROE" of the years. And the ROE - getting back to Munger - should mirror the return you get over the years, if you buy FFH at intrinsic value. Normally I don't adjust e g. to deferred taxes etc. "I know, that I don't know" everything. The whole machine is trimmed to safe taxes, build cost free leverage e. g. through deferred taxes and e. g. the pet insurance businesses was a vivid memory, that there are a lot of hidden things we don't even realize there are. So in my mind the number I get to is conservative in a way.
-
Yes, and your nick name here is a testament for that approach. I think business correlation is not the same as business risk at least in this case. At least I see all three insurers having a very, very low risk profile compared to all other sibgle stock investments. First BRK in my eyes lowers the risk of permanent loss of capital in nearly every stock portfolio. So many different income streams, a lot of wholly owned businesses (so less risk of running out of cash as the independence from Mr. Market is really great), so much cash on hand. I have high respect for anybody reaching for higher yields in a conservative manner like you do I guess. But for me having nearly 50% of my portfolio in FFH, I want to have a safe haven to counter that „half of all eggs in one basket“ risk and I think BRK is the perfect match. I get stock market like returns, but as safe as it can get. So I have around 10% of my portfolio in BRK. Second I hold Markel with nearly 10% of my portfolio as I still see some important differences in risk conpared to FFH. E. g. the float leverage of MKL is less big than FFH (but higher than BRKs). So there’s less risk than FFH, but higher performance potential than BRK. And now no Reinsurance risk any more (while it has been lower before, compared to FFH). No reinsurance risk gives MKL a different risk profile, so rosk diversification. Of course I don’t expect MKL to bring the same returns like FFH with a lower ratio of float/premiums to equity. And don’t forget: the insurance businesses of both have a really different profile too and that’s growing. I really like the worldwide diversification FFHs just grows into from a risk perspective; and I like the specialization MKL has in its niche. MKL has a lower risk profile and it has a different risk profile, as it holds other stocks and owns other businesses and the management is different. The most important thing for me: Both Prem and Tom are clearly value guys (or, as Buffett would put it: „They are both from Graham and Doddsville“) Toms and Prems toolboxes are clearly not the same from an investing perspective. I see a lot of mistakes Prem has done in the rearview mirror, that I don’t expect Tom to do ever - and vice versa. Do I like FFH more than MKL? Yes. But was Tom the better jockey to bet on between 2011 and 2016? Definitely! Do I think Prem will do such bad decisions again? Of course not. But is this a sure thing? No - so diversification helps. In a nutshell for me I think investing into 1. value management driven 2. holding companies 3. with a lot of different income streams, 4. having a decentralized structure 5. levered by a solid, profitable insurance business, gives an investor the lowest risk any single investment can give. The 5th point is imho especially interesting, as generally I think float leverage shouldn’t be too high from a risk perspective (ideally not more than 1:1 between float and equity but more than 1:3). Higher leverage like 2:1 gives a big chance of high outperformance with just a bit hogher risk. FFHs leverage seems really manageable and let’s me sleep well at night; still I see BRK and MKL being a bit safer in a black swan event. I totally understand, that my approach doesn’t match your hurdle rate and that’s totally understandable and fine and I respect it. I guess (but I might be wrong), you’re having a different view on risk (more like different sectors lowering risk?) and I‘d appreciate reading about your perspective.
-
Re: On the correlation of FFH, MKL and BRK Worth revisiting the framing here. Correlation measures co-movement of prices, but price volatility isn't really the risk that matters for long-term investors. Permanent loss of capital is. The more useful question isn't "will these three fall together in a downturn?" but rather "could any of them permanently destroy purchasing power?" That leads to a quite different conclusion. BRK as industrial conglomerate Berkshire today generates the majority of its earnings from BNSF, Berkshire Energy, Pilot Flying J and dozens of other operating businesses, completely independent of underwriting cycles or capital markets. Insurance contributes roughly a third of operating earnings and arguably reduces overall risk by attaching low-cost float to an already fortress-like industrial base. Classifying BRK alongside MKL and FFH as "primarily an insurer" understates how different the business actually is. MKL post-2025 Markel exited its Global Reinsurance Division in August 2025. What remains is a specialty direct insurer with limited catastrophe exposure, plus Markel Ventures, a collection of quietly cash-generative industrial businesses. The largest single source of underwriting correlation with FFH has been removed. FFH's differentiated portfolio FFH does carry a large global reinsurance book and that is real exposure. But the investment side looks quite different from MKL and BRK: Eurobank, Fairfax India, Bangalore Airport, and meaningful hard asset exposure through Minera Alamos and the emerging Eldorado Gold position via Foran Mining. In a deflationary global crash, the one scenario that pressures all three simultaneously, those gold and copper production assets would likely hold value while conventional equity portfolios suffer. That is genuine differentiation. The structural advantage all three share Pure investment portfolios become forced sellers in crises. None of these three companies does. BRK has $330bn in Treasuries and industrial cash flows. MKL has Markel Ventures. FFH has operating companies across four continents. The ability to sit still, or even be a buyer, when others are forced to sell is arguably the most underappreciated feature of the holding company model. Where your point stands A simultaneous global collapse in equities, credit and economic activity would pressure all three. But that scenario hits nearly everything. The more targeted response would be a modest allocation to gold royalty companies alongside these three, and interestingly, FFH has already partially addressed that through its mining positions. All three holdings are very diversified in their own internal structure and have a very low risk of permanent loss of capital. All three have so many different income streams and opportunities to invest their capital - that gives each of them a very low risk profile imho. Combining all three together in a portfolio spreads the risk even further, given their very different concrete stock investments, wholly owned businesses, geographical foot print etc. Particularly given BRKs low insurance exposure, MKL's reinsurance exit and FFH's real asset exposure lowers the overall risk profile meaningfully - at least in my eyes. Thinking like an owner, not a trader.
-
What I don’t get is, why most investors think investing in one of them would be the best idea. I think a lot of investors invest into different AI stocks or more than one of the Mag7. But only a few seem to think about investing in all three BRK, MKL and/or FFH. The power of float plus value investing plus investing a bigger portion of their investments into equity plus a decentralized structure (…) helped all three to be get to the Top1% of all American stocks, as far as I know. That combination is a secret sauce imho. They all brought between 15% and 20% CAGR over 40 to 60 years. If FFH is in your circle of competence, MKL, BRK are maybe too. I don’t like putting 100% of my investments into just one stock. So Fairfax is double the size than BRK and MKL combined in my portfolio. To me that feels safe and offensive too. BRK has just less float leverage, but Buffett wents away. MKL was the top performer in the 2010s of the three and for a reason. And FFH has the best times ahead; but still they all have different insurance leverage and insurance business. They are invested in different regions and stocks. E. g. I like BRK as I think it’s the safest business in the world. If the blackest swan event ever happens to the world, I think BRK would be the last man standing, in a lot of scenarios longer than FFH or MKL. I think it’s good to have such a thing in my portfolio. Even if BRK just mirrors index performance over most of the years, I think I will be happy having it in really, really bad years. Chances are very high, that BRK will give a lesser good performance; but that’s okay, I don’t own BRK stocks to outperform, I own it as an insurance against a severe once in a century market storm, still giving me market like returns. And MKLs management has grown intrinsic value by 15% CAGR over the same timespan than FFH (which has made around 18% or 19%), with much less lumpy performances, with less derivative investments. What’s wrong with a compounder 15%, that is in my circle of competence? In any case, MKL seems to have a different risk profile compared to FFH. It’s smaller than BRK and I think will give better returns than BRK, and smaller returns than FFH. But still amrket beating. But you know what? 15 years ago I would not have thought of FFH having a lost decade in front of them. I wasn’t aware MKL leaving FFH in the dust over the next 7 to 9 years. Even BRK outperformed FFH over multiple years. And I might be wrong again, now predicting FFH being the clear winner. Having all three in my portfolio let’s me sleep better, as I know I am wrong from time to time. I have three insurance compounders from Graham and Doddsville in my portfolio - and even if one fails, which I don’t expect, but if, the others should do really good and overcompensate.
-
All good points and I agree. They just use a bigger toolbox. However, I need to correct myself on one point, at least when comparing it to BRK: FFH has just far more opportunities for buybacks than BRK (and MKL). It’s less a matter of wanting to and more a matter of being able to. BRK rarely fell below its intrinsic value (nor did MKL). One could add several credit and financing tools. Like the deals between FFH and Kennedy Wilson. Those were structured across several years, combining direct and indirect lending, portfolio acquisitions, and equity stakes. Berkshire did something similar, for example during the financial crisis (BoA, Goldman. All in all it’s obvious, that „optionality“ is a strategy at FFH and they found even more than BRK.
-
+1 Optionality is a big driver for FFH. BRK and MKL come to mind when comparing your argument about optionality to FFH. What sets all three apart from other insurers is their willingness to invest in equity on a large scale - first, in individual stocks, and second, in entire companies. To my knowledge, there are no other insurance companies that have done this on a similarly large scale. So all three „win“ from that more in optionality. But regarding optionality there’s more to FFH. FFH gives itself even more optionality than BRK and MKL: - Large-scale buybacks - TRS - Large-scale foreign investments in equity (BRK’s investments in Japan point in the same direction; but in my opinion, that isn’t on a large scale—Buffett operates primarily domestically) - Foreign investments in the insurance market - Macro bets (deflation, housing derivatives) - Systematic large-scale acquisition of company stakes with co-investors on board (Buffett has done this as well - but again, not systematically or on a similarly significant scale, at least not relative to total investments). The difference between FFH and BRK/MKl is, that FFH does all this systematically at big scale. You‘ll find the others partly doing the same; but not at that scale and not that iterative. In my view, this all adds up to a major advantage for FFH over the other two. The weighted performance of all these additional options also points to an expanded Circle of Competence for Prem (though I remain cautious about derivatives overall; but they are just one segment). If one weighs the investments in global companies (Ireland, Greece, India), global insurance company acquisitions, derivatives, buybacks, etc., I generally view these as drivers of overall success.
-
Really like this chart! Thank you! @investmd! Many of us might have been aware, that FFH is much more into insurance, than BRK was; still it’s a great and insughtful perspective. Actually my personal take from the chart is… 1. FFH lower valued by Mr. Market. Brk was valued higher at same equity than FFH is valued today (1996 vs. 1997) 2. FFH with (much) higher float leverage. FFH has (probably much) higher float leverage than BRK had through float (1996 /1997 vs. 2002). Risk free returns might have been higher 1996/1997; still compared to the market, that lever helps FFH with outperforming the market more than BRK could. And maybe even helps driving FFHs roe higher than BRKs. 3. FFH 1 1/2 decades ahead regarding premiums FFH has (probably manyfold) that much premiums compared to BRK (1996 vs. 2012 - FFH is 16 years ahead. That’s a lot!). Assuming FFHs overall insurance business is more profitable (in absolute terms) over time, FFH has a stronger roe driver ahead compared to BRK. I haven’t done the math, but watching FFHs insurance business letting the average American insurance business behind by around 3 to 4 percentage points per year on average since 2011 (compared to lagging it by the same amount until 2011; so that‘s an improvement of 6 to 8 percentage points against the market after 2011 to before 2011), that gives a lot of confidence to me for FFHs future! Of course I could be mislead. E. g. BRKs premiums and float could have standed at 99% of FFHs from 1996 to 2002/2012. But I don’t think so. Haven’t looked at the numbers, so I could be off here. But my gut feeling is, that the direction could be very roughly right. There is more leverage built into FFH today than it was in BRK. And the market loved BRK more, than it loves FFH today. (And FFH is smaller and my guess is will stay smaller. As the biggest reason for staying smaller is buybacks, that helps returns all the more). Of course higher leverage means higher risk at least in theory and maybe in practice. So everyone has to do his own due diligence. As always.
-
Yes, I like the TRS too, while I like buybacks even more; and I like a combination of both more, than just one of them. Buybacks alone would push the price rises more sharply; the TRS does not have this effect; unfortunately, it does, however, cause the company’s overall value to rise more quickly, which necessitates ever-larger investments, and we know, of course, that larger investments often don’t offer the same high returns as smaller do. In any case if Fairfax is trading meaningfully below intrinsic value, an even lower share price is not automatically bad news for a long-term owner. In fact, it can improve the economics of capital allocation. The key reason are buybacks and the TRS. The lower the price relative to intrinsic value, the more value Fairfax can create per dollar spent on repurchases, and the better the risk reward within the TRS. At cheaper prices, the company can retire more shares (or potentially earn higher returns in case of the TRS), which increases the intrinsic value per remaining share for continuing owners. In that sense, a falling price can actually improve forward returns, provided the underlying business value remains broadly intact. That is also why I do not regret not having cash on the sidelines. Holding back cash would have required me to assume that a stock already trading well below intrinsic value would become even cheaper. That may happen, of course, but it is not a position I consider especially logical or necessary if the discount is already wide enough. From a long-term shareholder’s perspective, cheaper buybacks are economically beneficial even if I personally do not add another share. Fairfax can effectively increase my ownership percentage in the business by retiring shares at attractive prices. I get a larger claim on future value creation without deploying additional capital myself. And the TRS potentially rises upwards strobger giving higher earnings. More broadly, a lower share price also raises the bar for alternative uses of capital. If Fairfax can repurchase its own shares at a very attractive implied return, then any outside investment should have to clear that hurdle. That does not mean buybacks are “risk-free,” and it does not mean the company should repurchase stock without limit. Intrinsic value is only an estimate, buybacks can move the market price, and management still has to compare repurchases against other available opportunities. But the logic remains: the deeper the discount to intrinsic value, the more compelling repurchases become at the margin. So, stated a bit more sharply: the further the stock trades below intrinsic value, the stronger the built-in tailwind for long-term per-share value creation both by buybacks and by the TRS, of course assuming the intrinsic value estimate is roughly right and management remains disciplined in allocating capital.
-
Many thanks, @Viking. And for all the insights you bring to the table here. It‘s really inspiring and I learn a lot! Yes, they want to get paid for the risk they take. My reasoning regarding short duration was taking that as a basis: Do you EVER get paid with yields standing at 1% for taking longterm risk? I mean if the 1 year yield stands at 1% (so not a shorttime dip) for some time you won’t get much more for taking the 4 year risk, right? @Hoodlum brings that to the point nicely: The second part I go with you, but I‘d like to add: Going very short resonated a lot with me; to me (my bias?), that was very rational. The others were irrational. And I‘d like to add, I have no idea, where yields stand anytime in the future and I will never try to pinpoint that. That way I can’t be wrong… Only thing I am pretty sure: - Yields move. Normally they don’t stay where they are for very long. Than something unexpected happens and yields move. - 1% is not normal and not the average over decades
-
Could someone please explain how they are likely to manage the duration of the bond portfolio? My (very simplistic) understanding is something like this: They have an idea of what ‘normal’ yields are. If interest rates are lower, they go shorter. If interest rates are high, they go longer. On average and over many, many decades, this approach should yield a higher effective return than if one were to focus ‘only’ on the claim duration. At least as long as there is no hyperinflation and the yield doesn't e. g. stick at 1% forever. But as long as it swings up and down between - say - 0% and 8% and builds an average around the width of that, that seems a pretty good strategy; of course you have to be happy with lumpy returns. But the advantage is that you can get out of the low-interest-rate period quickly, and if rates are above average, you lock them in for longer. You won't be right all the time, but over time it seems a better strategy. It’s perhaps a bit like how a private individual thinks about a mortgage, only the other way round. When interest rates were at rock bottom, I bought a house. In Germany, everyone takes out a 10-year fixed-rate mortgage. I fixed mine for 20 years and pay 1.18% interest for the next 15 years. What could have gone wrong? After 10 years, the interest rate could have been around 0.5%; but that wouldn’t have been a huge loss. Or it could have risen massively and multiplied to 3%, 5%, ... So 20 years to me seemed being the only rational choice: If it's heads, I win big; if it's tails, I lose almost nothing. I discussed that a lot with my friends, some of them bought a house in the same timeframe. But they all locked in the 10 year mortage, as it was 0.2% cheaper. I just don't get that, as the risk reward seemed so clear to me. That always reminds me of FFHs Bond portfolio and how they managed it. Every other insurance business locked in 4 or 5 years, totally ignoring the special situation. It's a bit like people are used to doing things all the time, but they don't react, if the Environment changes. "We have always done it like that" It seems to be a very powerful guiding principle, and it does seem to put people at ease. You don’t have to think about it. However, I’m unsure about a number of points regarding how FFH manages its Bond portfolio ("I know, that I don't know" a lot about that topic): It seems to me that staying short at 1% interest is not very risky. But going long at 10% – when there’s a potential threat of hyperinflation – could also be dangerous. Do they also adjust based on their own macroeconomic outlook? I could imagine you might go even shorter or longer at 4% if you observed something extraordinary. For instance, if politicians were to intervene in interest rates or China were to withdraw massive amounts of capital. But I’m not sure; that would effectively be a macro bet – and I’m not sure whether you would do that with insurance capital. Sorry if I'm simplifying things a bit here. My knowledge is just very basic.
-
Wow, thank you! Great job! Do I get it right, ... that today the equity investments are up 10.3% since YE, ... while market value of FFH is down 5.2%, ... which means, the implied market value for the rest of FFH is valued -13.4% (so market value of FFH minus all equity investments, adjusted for buybacks) Just want to make sure, I get it right. It's really crazy, what one is able to do with AI and Claude. Thank you again!
-
Agree. I never wrote, that dividends are good. What makes you think that? I know. That's my point. We are at the same page. Yes, FFHs goal is 15%. My example with 18% is just that - an example. I just took it to show a general mechanism. I think you give too little credit to Berkshire & Buffett. I don't believe Buffett ever wanted to grow Berkshire's asset base at the expense of growing per share intrinsic value. If you even causally read past Berkshire annual reports, you would notice that Buffett almost always referred to maximizing per share intrinsic value. Finally, the focus should not be on getting big or small, but incremental returns on reinvested capital, and the comparison to alternatives. Again, we are on the same page. I was referring to a path – something concrete that actually happened in reality, not just to a mental model. There are several reasons why Fairfax could end up with more meaningful buybacks than Berkshire in practice: For many years, Fairfax’s valuation has been on the low side. Even its index inclusion hasn’t really changed that. Berkshire’s situation was very different; the stock has generally traded at materially higher multiples. Buffett is far more famous than Prem. Berkshire is an American company that became a “must own” vehicle in the world’s deepest capital market. That global attention has tended to prevent Berkshire from trading at the kind of persistent discounts Fairfax has seen. Prem is only about twenty years younger than Buffett, but Fairfax’s market cap lags Berkshire’s development by roughly 35 years, and Prem is already bringing the next generation to the forefront. It is unlikely that Prem will ever attract the same level of public attention Buffett had in the 1990s and 2000s, which in turn makes structurally lower valuations for Fairfax more plausible. Prem started to use buybacks (and, when appropriate, share issuance) as part of his playbook much earlier in his career than Buffett. I don’t blame Buffett for not doing repurchases over the past 10–20 years – even the best investors don’t get every capital allocation decision exactly right. But it is at least plausible (and I would say likely) that Prem would have been more aggressive with buybacks in a situation comparable to Berkshire’s huge cash build-up in recent years. ... In that sense, my point was not that Buffett didn’t care about per-share intrinsic value – he clearly did. It was that the actual path Fairfax is on today could lead to less growth in market cap than Berkshire’s historical path. And again: Being small is helpful, if high returns are wanted. The investment universe is larger when you’re smaller. That’s Buffett’s argument, not mine. As I recall, Buffett once said that he would still achieve 50% returns a year if he only had a million dollar to invest. And today he talks about how BRK might achieve a slight outperformance over long investment horizons. The only reason: size.
-
I think we are talking past each other a bit. I was not arguing that buybacks are always better than reinvestment. I was pointing out a structural difference: Fairfax today pays a dividend and buys back stock, while Berkshire in the 1980s/1990s did neither. That likely means Fairfax will grow total market cap more slowly than a pure 100% reinvestment model. But it may also compound intrinsic value per share better than many expect if repurchases continue to happen at a meaningful discount to intrinsic value. And in the real world, the question is almost never whether a company can reinvest 100% of earnings at its historical average ROE. The real question is what to do with the portion of earnings that cannot be redeployed internally at equally attractive rates. A reported 18% ROE does not mean every incremental dollar earns 18%. It only means the blend of decisions, some very good and some not, produced 18% on average. In practice, no allocator gets only the winners. That is why buybacks below intrinsic value can be so powerful. The hurdle is not the company’s historical average ROE. The hurdle is the return available on the next dollar retained. In the best version of this, management funds the clearly superior internal opportunities first and then uses the residual capital to buy back stock below intrinsic value. That is a very strong combination: you get the upside of the best internal opportunities without forcing capital into the weaker tail of the opportunity set. Put differently, management can sometimes buy more of its own business, and more of its own future capital allocation, at a discount. That is a high hurdle for most alternative uses of capital. So yes, internal reinvestment is best when it can be done at very high returns and in size. But that does not contradict my point. My point is simply that Fairfax’s path from here is likely to look different from old Berkshire’s path: less about maximizing absolute size, more about maximizing per-share value creation. And by not getting too big too quickly, Fairfax may preserve higher incremental returns for longer.