Hamburg Investor
-
Posts
229 -
Joined
-
Last visited
-
Days Won
2
Content Type
Profiles
Forums
Events
Everything posted by Hamburg Investor
-
+1 One other big difference versus BRK in the 1980s/1990s is that Fairfax is already returning large amounts of capital through both dividends and buybacks, while Berkshire did neither. In 2024 Fairfax returned about $1.93–1.95B to shareholders, roughly 50% of earnings, and in 2025 it returned about $1.94–1.96B, roughly 40–41% of earnings. That matters because a great business that retains 100% of earnings gets big very fast, and the bigger it gets, the harder it becomes to reinvest every new dollar at the same high rate. A business that can instead use a meaningful part of earnings to buy back stock below intrinsic value can keep compounding per-share value at a very high rate without needing the whole enterprise to become gigantic. Buybacks (below iv) hold market cap down AND push iv/share! Take a simple example: start with 1,000 shares and 100,000 of equity, so intrinsic value starts at 100 per share. Assume both companies earn 18% annually for 20 years (I am oversimplifying iv as bv to keep the example shorter). Company A reinvests 100% of earnings. Company B retains only half and uses the other half to repurchase shares at 75% of intrinsic value. After 20 years, Company A has 1,000 shares outstanding, equity of about 2,739,303, and intrinsic value per share of about 2,739. Company B has only about 117 shares left, equity of about 560,441, and intrinsic value per share of about 4,787. That is the punchline: Company B ends up with only about one-fifth the market cap of Company A, and only about 117 shares left out of the original 1,000, yet it creates vastly more value per share for the continuing owners. Bigger is not better if the smaller company is buying in stock below intrinsic value. So yes, Fairfax may be entering a Berkshire-like capital allocation phase. But because Fairfax pays a dividend and is aggressively shrinking the share count when the stock is cheap, the per-share compounding path could end up looking meaningfully better than many investors expect.
-
Thanks again, @Viking! Wishing you and everyone from this forum a great experience! Hopefully I will make it someday!
-
+1 The gift that keeps on giving. And as a sidenote: It helps not growing so fast into Berkshire dimension. Which would ultimately reduce future return opportunities. Every dollar reinvested into buybacks serves longterm shareholders all the more.
-
But maybe it’s a better idea to think of interest rates being „normal“ around 4% or 5% - and thus going longer or shorter in dependence of where rates actually are? Of course you could still be on the wrong site, as Mr. Market seems to rule bond yields too over short timeframes But if 4%(or 5% or whatever) should be normal, than it might be a good idea to invest into 1-years and if it’s at 8%, than go for 10-years (or whatever). At least, if it swings around 4%, than this might be the better strategy over the lobg run (might be lumpy of course…) I am not an expert, so please feel free to criticize; happy to learn…
-
Wow - Treasury yield stands at 4.418%. It‘s just as always: Folks expect the yield to go up (or down). And than something happens. A war. Another war. Lehman. Covid. Tariffs. No tariffs. War is over. Trump versus Fed. Euro Crisis. Chinese reducing treasuries. A huge deficit. The expectation it might fall. The reality, that it doesn’t. I am clearly NOT saying, that I would have known anything of that before. I just do not know. I just don’t get, why others think, they could. If I understood Buffet right, than he can‘t too; still others are sure, they know. Anyway: So maybe FFH running their portfolio at 2.5 years these days is a good move again?
-
Okay, so you need to replace $21,139m with $16,930m (that's the number from 2024). In that case, wouldn’t the equity portfolio have grown by 21.2% rather than 17%, with earnings at $3,584.2m? I must admit that I also find it difficult to find the right size here. Maybe someone else here could help us?
-
I Agree - somehow, somehow not. My points would be: Even the best investors of all time sometimes did/do bad. => Does this mean, we shouldn't criticize? Of course not - just the opposite! It just means, that not all critics should hold one back from buying, just as not one brilliant move should be the reason for buying. Apple has done bad decisions in the 80ies and 90ies and Coca Cola has done bad decisions. Blackberry was a bad investment, that Prem made (and still holds). The whole concept of holding bad insurance companies by Prem and very high leverage in the 2000s in general is to be criticized as are the bad investment decisions (a lot) of the 2010s. Buffett bought crap too, Berkshire itself being the testament for that. I myself underlined, that those were bad investments. The discussion is not about criticizing. We all are having a sharp eye on everything ( @Viking would be the first to assist you, that Prem has done bad in the 2010s) . That's why we are here. To be critical. To learn, To think. The real discussion in this forum is about distinguishing the important from the unimportant. And that is where different perspectives sometimes clash here in the forum. That’s what a discussion is all about, isn’t it? Specifically regarding FFH: What happened at FFH in the 2010s? My view in a nutshell: (Essentially, the concept consists of an insurance company using free float (and deferred taxes) as leverage, a fairly large proportion of investments in equities, a long-term investment focus (as opposed to a quarterly focus), a focus on value investing (as opposed to growth), a decentralised structure, a culture in which everyone is incentivised towards long-term success, etc. A concept that clearly works. BRK, MKL, FFH prove this. All three rank among the top 1% (and some among the top 10 overall) of all shares in their respective countries.) zero rates (=> not Prems fault, an outlier. Clearly not ‘normal’ times, if we look at the last 100 years) growth beating value by miles (not Prem’s fault. An outlier. If we look at the last 100 years, growth hasn’t beaten value on average – the opposite is true) A long soft market (not Prem’s fault. Hard markets are rarer; but clearly it didn’t help and was under average) Since 2011, the insurance business has been managed better than ever before. Bad investment decisions, derivatives (Clearly Prem’s fault. That was not good!) => FFH faced fierce macro headwinds from various sides in the 2010s, the likes of which had never before converged on such a massive scale. => At the same time, he made very poor decisions. And since 2016/2020, the picture has shifted dramatically: A long hard market (big tailwind!) interest rates at – historically – normal levels (4% is historical just around average... 1970ies was high, 2000s was low...) growth still beating value, but perhaps a little less (that's still a headwind, as long as you are a value investor; it's hard to beat the market, if Mag7 goes through the roof and you don't own them) Great investment decisions (plus maybe even a bit of luck) => FFH got a nice macro tailwind from various sides in the 2020s. => In my eyes today's macro is more normal, maybe even a bit better than average, but clearly nothing completely out of the norm. Others might consider the long hard market as only criterium, but I don't, as its returns are not only driven by insurance profits. Others might think of 4% interest as "higher than average", but I don't. Others might ignore or value less the fact that ‘growth beats value’ still holds true. But that's fine (and still a nice point for discussions!) => At the same time, Prem made very good decisions. => Overall/underlying (in my eyes really important): Prem building a new, better structure over the whole timeframe (2010 until today): Better insurance business: Compared to MKL and to P&C in general, the CRs today are better on average over the years; Prem lagged behind other P&C insurers’ CRs by miles until 2011 (3%, 4%, 5%); now he’s better than average (like 3% better or more) => That’s what you see when structures change, regardless of hard and soft markets that come and go. Worldwide diversification less volatility in earnings through a new portfolio structure (wholly owned businesses) ... (hopefully, not sure: Stronger focus on quality investments in general (as opposed to a focus on "cheap" - at least that's what Buffett learned and my impression is Prem is going into the same direction - but not sure!) (hopefully, not sure: Less derivatives and less bets; e. g. I understand the rational behind the TRS - but it's a bet on Mr. Market) My impression is, that we are having two opposing ways of thinking and everyone of us tends to be in between those lines (I’m deliberately exaggerating): There's one way of thinking here in this forum, that Fairfax management hasn't changed at all over the years and that the difference in outcome between 2010s and the 2020s is just driven by change of macro. So, in future, Fairfax’s returns will be determined solely by macro, as the company is structurally the same it has ever been. Another way of thinking in this forum sees learnings at Management level and a better structure than in the 2000s in the foreground. I don't think one has to decide for one way of thinking or for the other. Both can be true at the same time. At least, that's what I see. Everyone has to do his own due diligence.
-
But the 2025 stock returns were happening on the basis of year end stock investment portfolio of 2024, weren’t they? So investment portfolio ROE for 2025 takes the returns of 2025 and puts them in relationship to ye book of 2024. Or am I off here? I‘ve got the same problem. It would just make so much more sense to me to separate income from equity and from insurance/bonds. I am not an accountant, but I would intuitively like to put the whole stock divs and add those to the equity portfolio to get to a solid number regarding the real equity portfolio returns (I mean: Divs are an important part for understanding the returns and Prems ability in stock investment. And intuitively I‘d like to add the fixed income from bonds etc. to the insurance earnings (or losses). That way we‘d have two clearly separated and consistent baskets.
-
That reminds me of another stock. A textile business in the 1960ies. I haven’t bought for similar reasons (apart from I wasn’t born yet). The whole story of the guy buying the busibess was fun in itself: First the guy bought it becoming emotional (it was a dispute with the than owner about 1/4 dollar per share or so; I don’t tell the story to you, you won’t believe it!) Second, it got even better: The guy sticked to textile over 20 years, even though it was clear that business went to asia and wouldn’t come back! He not only held it - he even threw more money after the textile mills. The Opportunity costs over the years were as high as $200bn (no joke!). How happy I am - never buying it. What a disaster! Third, one could think he might have learned from that, right? But - no! One of the next things he bought was - a shoe business! That was 1993. And where has the shoe making moved to? Yes. Asia. Again. Can you believe it? Sticked 20 years to textile, shich moved to asia, and 8 years later buys a shoe business. So now we are at nearly 30 years of disaster and value destruction with a pause of 8 years. Fourth, he was an „airoholic“ (he claimed that word for himself as he got so many bad investments into airlines). I could go on and on… It’s always the same: People don’t change. They don’t learn. Never. They just stay like they have always been. I mean, he might have once come up with the idea of focusing on quality instead of just buying “as long as it’s cheap.” I bet he never learned that! Or buying entire companies instead of always just parts. Why not? I can’t imagine that he ever learned all that things. It's always the same with these guys. And than they get old and are as dumb as they‘ve always been. Well, okay, while he still owned the textile mills, he invested quite a bit in insurance companies. And that was rather successful. But he just sticked to all those textile, shoe business, airlines, IBM and had all that in his books. Anyway, how lucky I am I never bought that company! The guy and his shareholders certainly never struck it rich—and rightly so.
-
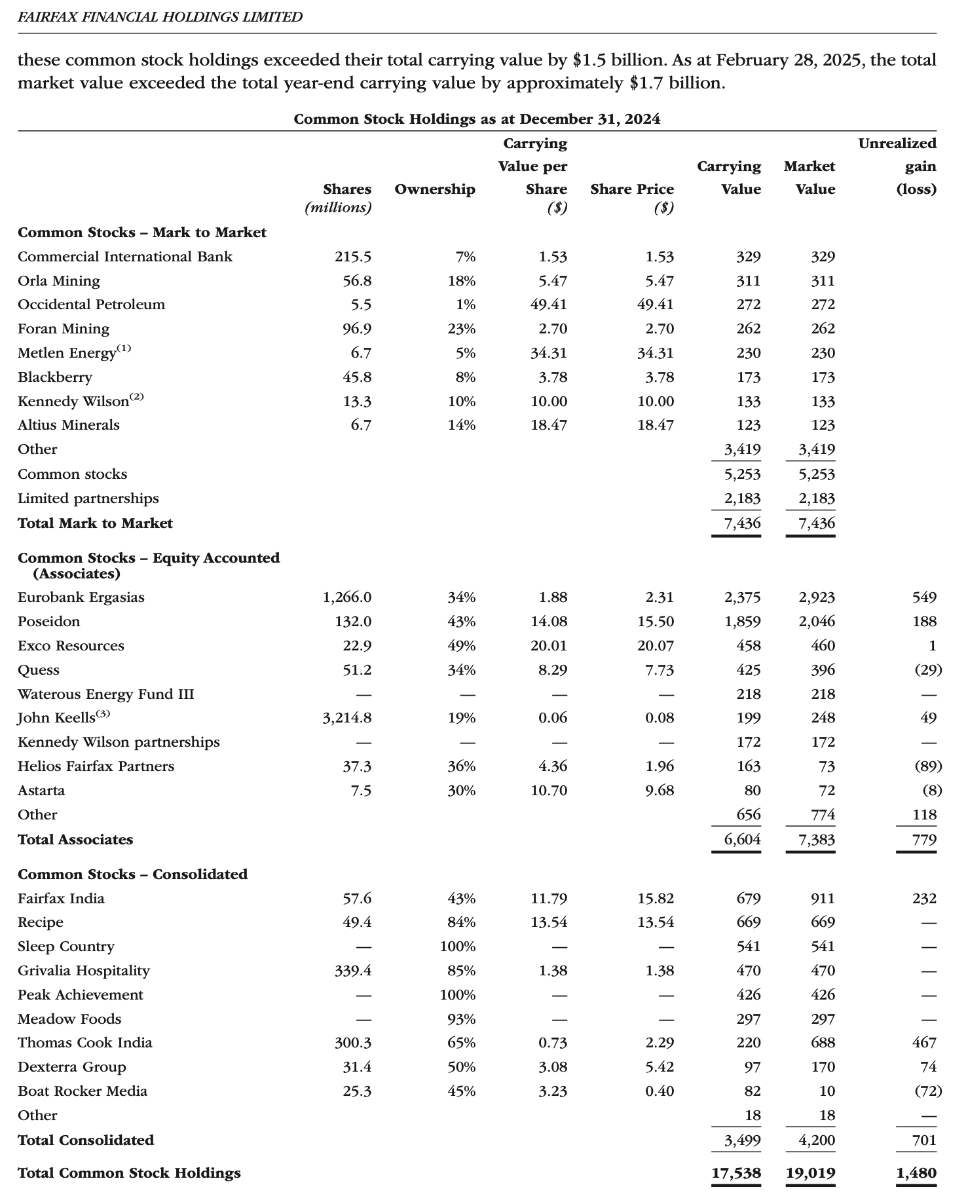
How did you arrive at $21bn? I may be a bit off the mark, but in the 2024 shareholder letter, the stock investments were stated as $17,5bn (CV) and $19bn (MV). Does the difference come from the TRS? I’m already curious to hear your thoughts on the point regarding ROE and the intrinsic value of the investment portfolio. I see the key point in the difference between the CV and the actual intrinsic value of the equity portfolio. My base case is, that a fairly valued equity investment portfolio from Prem will outperform the stock market (10%) by a bit (2%+). At least in the very long term, i.e. before any withdrawals or reallocations into the stock portfolio.

-
Thank you; I really like your table! It seems logic and rather uncomplicated way to understand things. I've got some questions to you: - I go with you, that 18.8% is nothing I would expect on average to be reachable. More like 12% or maybe a bit more over time on average. Maybe the 13% is a good number to start with. So ROE 13% on the equity part. - At the same time hidden assets are huge; and while it's good for intrinsic value, that they are not in the books yet (as this means, that they haven't been taxed yet - so the tax deferral gives an extra - hidden - cost free leverage to FFH), at the same time Eurolife, Poseidon... are only a small part of hidden equity returns of the past years, that now come to light. The value creation of Eurolife, Poseidon etc. hasn't happened overnight but has been growing steadily and all the time. The value has been created, but we just haven't seen it in the books. So we don't find that in the numbers and tables (with the rare exception of the $3bn+ of hidden value in the stocks, that are only missing for accounting reasons; but even those 3bn are not calculated in official returns, earnings, ROEs). This $3bn (and I guess more than that of real hidden value) is missing everywhere in the numbers - and so in your table. - So for that alone you could adjust the equity investments of the last 6 years back of the envelop and very rough $0.5bn upwards. The hidden value creation might even be bigger like $6bn within the last 6 years so $1bn/year might be another number. That's huge! - Another way to look at it is this: the value creation of wholly owned businesses is always inflated in the books. And this part is growing a lot within Fairfax (and before at Markel and Buffett) within the last years. So one could argue that "intrinsic equity" is bigger than "Face equity". And the hidden part of the intrinsic equity is creating intrinsic (often hidden) earnings every year. Is it understandable what I mean? If we may agree that Prem is able to earn ROE of 13% on the investment portfolio, than what do we both mean with that number? I can say, what I mean: For me that is just another way of saying "I expect Prem to outperform the value creation of the stock market by a few percentage points per year on average with his investment decisions on the equity investment portfolio." And I base this expectation of "better than average value creation" on the true intrinsic value as a starting point. Not just 13.2% of inflated 'face equity'. But 13.2% also on the hidden assets. And I am pretty sure that in the case of FFH the equity investment portfolio is bigger than the $20bn FFH had end of year "in their books" So if we assume ROE of 13.2% to be the average for the next e. g. 10 years, at least what I think is: "Yes, but I don't expect that 13.2% to happen on the $20bn face value of the investment portfolio (which would be 2.64bn earnings/year and which is the basis of the official numbers in the tables), but I expect Prem to get the 13.2% returns on $26bn+ (so more like 3.43bn+ of earnings/year). If I put back that 3.43bn, that would be a return of 17.2% on the "face value" of the $20bn of the equity investment portfolio. I am not sure, if that makes sense; I just find more and more hidden aspects, that makes me think, there might be more to it. BTW: What do you think Prem wants to say, when comparing last years investment return to the average of the 25 years? Is that just a random comparison, that came to his mind? Taking the average of a random number of random years of the past? Or is it dedicated, but this is just like Prem is saying "Oh wow, I didn't expect that returns of the first 25 years to happen again ever! I always thought it would be impossible to get back to that early investment portfolio returns ever. Not even in a single year. And now it happened - I can't believe it's true. But please don't expect that to come back ever! It's just a random onetime coincidence, something that's definitely never to come back again." - but where's the disclaimer than for the future - if it would be a onetime thing in Prems eyes, I am pretty sure he would have addressed it - but he hasn't. Or what else could it mean? I just don't find any other interpretation than "Okay, we are on a good track - let's see, if we can reach something similar again" The latter interpretation to me makes sense and at least I can't find any other reasonable interpretation of what the statement might otherwise mean.
-
The Most Remarkable Sentence in Fairfax's 2025 Shareholder Letter The single most remarkable line in Fairfax's 2025 shareholder letter - at least to me - is this one: "The total return on our investment portfolio of 9.3% in 2025 was well above our 40-year average of 7.7% and closer to the average returns of our first 25 years!" I've read this sentence several times now. And I don't think Watsa is just reporting a good year. He is quietly signalling something bigger: that he believes it is possible again to earn returns "like in the old days" on Fairfax's asset base. Not the 30–50% annual book value growth of the early years – but asset-level returns in the same ballpark as those of the first 25 years. It reads like a statement of confidence - and it’s an interesting data point. Prem marks 2010 to 2020 as outliers. Let me walk through why I think that matters – and why the story is more nuanced than it first appears. Is Prem making the case for 22%, 25%+ Compounding? Let’s do the math: The average arithmetic return on assets of the 1st 25 years was 9.7% (average from the five 5-year periods of 10.4%, 9.7%, 8.8%, 8.6%, 11.0%). So yes - 2025s 9.3% is just shy of mirroring that average. At todays float leverage of 2.8 such average asset returns would lead to a return of 27.2% pretax and - assuming a 20% tax rate - 21.7% after tax return. That’s huge. And that’s clearly not the same as 15%. Even if you substract corporate overhead. Incidentally, it’s quite interesting that Prem states more clearly than ever that FFH’s intrinsic value has grown significantly faster than its book value over the years and that this trend will continue; consequently, we can also interpret Prem’s target of 15% book value growth as a goal to increase FFH’s intrinsic value by 15%+ annually - maybe 16% or even more. Anyway, the 21.7% aftertax returns are (a) without counting in a profitable insurance business (with todays premiums standing at $1.596/share, assuming cr95, that adds another $80/share; which translates to 6.3% pretax earnings and would add another 5% aftertax roe - so 26.7%) and (b) without counting in any hidden assets, that should give extra leverage with equity like returns (if I‘d assume 10% roe on Prems equity investments I’d add another 1% roe per $3bn of hidden assets or - if 15% roe - 1% extra roe per $2bn. Of course, Prem doesn't promise such returns outright. And he even isn’t saying that this will happen every year or on average. Anyway, just a few sentences later he continues to cite 15% book value growth as his target and for good reason. You‘ll never know, if a zero interest rates regime or a softer than ever market or a big catastrophe or growth beating value in a major way or other things knock at your door and when. It‘s just, that all those drags combined are clearly outliers and far from normal and average. What the Five-Year Table Actually Says – And Doesn't Say The letter includes Fairfax's familiar 5-year period table: compound book value growth, average combined ratio, and average investment return, going back to 1986. At first glance, the three columns feel oddly disconnected. Book value growth swings from −0.9% to +57.7% without an obvious mechanical link to the other two numbers. That's because the table is missing its most important variable: the ratio of investment portfolio to equity. So I went through the old reports and if I got the numbers right, than In the early years, Fairfax's float was in the same ballpark as today; so like 1.5 to 2.0 book value was normal, at least at the end of the 5 year timeframes starting 1985 (there’s one peek/exception of 3.2 float to equity, but all others are below 2.0). But the Asset to equity ratio was way higher in the first 25 years; between above 4 and even above 10. So FFH used not only float, but normal credit as a second, even bigger layer of leverage (at least that’s my interpretation; please help me if I am wrong; happy to learn). So a 10% return on a portfolio that is 5 × equity means a 50% contribution to book value growth before underwriting is even considered, right? The float leverage is the hidden engine the table never shows. But in those early years, the float wasn't free. Average combined ratios over 5 years above 104%, 114% or 106% meant Fairfax was paying for its float through underwriting losses; AND I guess on the other assets (credit?). So those investment returns had to first cover that cost before creating any book value at all. The headline numbers were spectacular – but structurally fragile. The 2011–2020 Decade: What Happens When the Engine Stalls The 5 years table is brutally honest here. In 2011–2015 and 2016–2020, Fairfax finally got underwriting right – combined ratios below 100%, float becoming genuinely cheaper. And yet book value growth collapsed to 3.8% and 5.6%. The culprit was investment returns falling to 3.2% and 3.4%. Crushed by zero rates. For an insurer whose model depends on earning a spread between cost-of-float and return-on-float, near-zero rates were an existential drag - made worse by Watsa's prolonged macro hedges and deflation bets that destroyed enormous opportunity cost throughout the decade. Good underwriting. Wrong macro bets. Wrong rate environment. Growth beating value. The engine stalled. The only time when the 5 year investment returns went below 8.6%. Why 9.3% Is Achievable Today – Despite Fairfax Being Much Larger This is where it gets interesting - and where the size question comes in. The obvious objection to Watsa's implied optimism is: Fairfax is vastly larger now. You can't generate the same asset returns at scale. And there's truth in that. In the early decades, strong portfolio returns relied on: - a small, concentrated equity portfolio where a few multibaggers could materially move the overall result, and - a large bond book in a high-rate world as a already high baseline. A $500mn equity portfolio can compound at 20%+ if Watsa makes three brilliant calls. A $20 billion equity portfolio cannot - the universe of ideas shrinks dramatically as the equity portfolio gets bigger. That constraint is real and permanent. But here is what changes the equation: Fairfax no longer needs the same equity alpha to hit strong total portfolio returns. Why? Because the portfolio mix itself has shifted in a way that compensates: - The fixed-income book earns ~5% again instead of 1–2%, generating $2.6bn in annual interest and dividend income - locked in and maintainable for at least four years - A structurally higher share of assets than in the first 25 years now sits in equities and equity-like holdings, reducing the drag from bond allocations, which structurally give lower returns than stocks/equity - (a plus for book value growth: The float itself now generates profit rather than consuming it) In the early years, a 9–10% total return on assets required a handful of exceptional stock picks. But the higher float/credit leverage in the early days was a drag, pulling overall investment returns down. If Prem shot the lights out with equity in the early days, but he was levered 1-to-10 with equity to assets, 9 out of 10 asset parts were giving bond-like returns. So the overall investment return was still near to the bond base, right? At least the gravity of bond like returns is way less in a 1.8 part bonds to 1 part equity situation. And don’t forget: All that happend with the acceptance of underwriting losses. Today, a similar 9–10% is achievable through a healthier, more balanced mix: reasonable bond yields, more equity exposure, and decent - not brilliant - stock selection. That is the real implication of Watsa's sentence. He is not claiming the equity outperformance of 1992 is back. He is saying the return environment and portfolio structure have aligned in a way that makes those asset-level returns possible again – through a different, more durable route. The New Structural Advantage: Float That Pays You For the first time in Fairfax's 40-year history, both compounding components are working simultaneously: - Combined ratio of 93.6% - the best five-year underwriting period in company history, generating ~$1.5 billion annually in profit - Investment return recovering to 6.8% on average, 9.3% in 2025 Let’s run the rough math with an example and the shift becomes clear: > Early years: ~4× float leverage × 9% investment return − 7.5% cost of float ≈ 28.5% (that's pretax; so 22.8% contribution to book value, assuming 20% tax rate) > Today: ~2.5× float leverage × 9% return + 6% profit of float ≈ 28.5% - again. The leverage today is smaller. The quality of each unit of float is dramatically better. A bigger share of overall investment returns on assets is defined by FFHs equity portfolio and not by the bond portfolio as in the past. The net result is similar – through a structure that doesn't depend on very big equity outperformance/returns, like in the early years with a than much smaller equity. Bottom Line „The total return on our investment portfolio of 9.3% in 2025 was well above our 40-year average of 7.7% and closer to the average returns of our first 25 years!" The asset leverage of the early years is gone - and it is not coming back. But Fairfax no longer needs it. A higher equity weight in the investment portfolio, secured back-to-normal fixed-income yields, and structurally profitable underwriting create a different but comparably powerful compounding engine. Addendum: I have a few more questions and points of confusion: Does anyone know why, in the early years, assets relative to equity were so enormous (a factor of 4, 5, ...10) – even though the ratio of float to equity was significantly lower; like only a fraction of overall leverage? Where did this leverage come from? Am I even correct in assuming that the leverage was generally invested in a bond-like manner (as opposed to equity-like)? Or were bond-like returns at least more typical when you factor in the costs of the additional (non-float) leverage? More generally, we still rarely discuss deferred taxes here as a second significant lever, which is now becoming increasingly significant. Just a thought. ... happy to learn from your feedback - I may be a bit off here and there. But that's what makes a discussion, doesn't it?
-
So this a $887mn onetime earnings push for q2, isn‘t it?
-
Thank you very much; what a great idea! So at todays valuation and applying 2025 numbers, MKL ($1983) has a roughly 25% discount to IV and FFH ($1638) even a bit over 50% to IV (I used the $3348 from the pdf). So taking into account the IV numbers of the "orange and blue concept" of Tom Gayner - when would both be fully valued? If MKL would rise 33% tomorrow to a pb ratio of 1.8 (BVPS is $1476 end of 2025) it would be fully valued. FFH (BVPS $1260) could more than double tomorrow to a pb ratio of 2.7 for full valuation. Although I am much more happy with todays valuations, I think paying those prices at full value tomorrow an investor would still outperform the market (at least over the very long run) with both; and the chances are a bit better, when buying FFH. As Buffett said: "It’s far better to buy a wonderful company at a fair price than a fair company at a wonderful price.” I think both are wonderful companies, while Fairfax seems even a bit more wonderful. But wait: Is the price of MKL and FFH fair? No - it's below IV. So we could change Buffetts cite a bit (and I hope he would agree ) "It's far better to buy a wonderful company at a wonderful price than buying the same wonderful company at a fair price." Imagine that: Paying double todays price for FFH and MKLs price rising a third, FFH would still be (much) cheaper than MKL. At least for everyone who thinks FFH IV to grow faster.
-
Agree with everything you write. Otherwise I wouldn’t hold 45% of my portfolio in FFH and only 10% in BRK and another 10% in MKL.
-
You are so right... With all this AI things happening today, one could very quickly forget this very, very old aspect of the internet. I am very happy to be the dinosaur in this sense. Please feel free taking me as your example. Cheers!
-
10 years: Markel: Absolute return: 163%, 10.2% CAGR FFH: Absolute return: 5%, 0.5% CAGR (that's with dividends included, as I now see) 18 years: Markel: Absolute return: 397%, 9.3% CAGR FFH: Absolute return: 443%, 9.8% CAGR "Misleading" clearly did not refer to the result of your explanations (which I agree with; FFH is likely to be the better performer in terms of intrinsic value development for future returns), but to the method you used to derive it. What are the numbers above and why are they so different to yours? They are showing the results with the same logic you applied, but with a different starting date. The end point is always end of 2020 and the starting date end of 2010 or end of 2002 (as you see, the chart isn't reaching further back). So the only difference: The starting and the end point. Yes, they were not chosen at random. I simply took the point where the two curves intersected for the first time. I could have taken pretty much any starting point between 2009 and 2019 and any ending point between 2019 and 2022, and Markel would have looked better. (BTW 1 : Being a longterm shareholder of both I have a vivid memory, that MKL was a way better performer than FFH in the 2010s, when watching the share price development. And I am happy that I have not made my investing decisions on the share price development back than - but on analyzing the company. BTW 2: Even looking at the decisions made by FFH management compared to MKL, or on the Combined Ratio or the equity decisions, I could have easily kicked FFH out of my portfolio somewhere in the mid 2010s. MKL seemed to be the way better business when comparing Management decisions until 2016/2020.) "Misleading" referred to the method, and I just wanted to say two things: 1. You intend that it's no coincidence that they are closed to their hurdle rates - but it is (otherwise why would you ask us to give an estimate of "which horse to pay more"?). So I don't agree with your argument here. It is simply a coincidence that Mr. Market currently roughly reflects the hurdle rates here. Even for long periods of time, this picture can look completely different, even the opposite; and that is exactly what you see when you take other periods as my example shows. 2. Investment decisions should not be made by comparing share prices - even if it's 10 or 20 years you are looking at. But with your subsequent question about which one we would pay more for ("Which horse..."), you are implying that we should decide for either MKL or FFH on that basis. However, in my opinion, this is generally not something one should ever do (unless one is a momentum investor doing that systematically). Share price is simply not a good guide, growth of intrinsic value is much better. So after all, isn't FFH comparing to MKL a perfect case that shows how little you can read about what's the better investment by comparative conclusions from the share price evolution even over loooong periods of time alone? And, to put it quite plainly: You've completely won me over with all the other arguments you made (FFH having much more float, etc.)!
-
In Germany we are not able so easily to put together savings of several people or family members in one basket. But I assist some relatives and now some of them have a combination of these three. It's interesting that we all came to similar conclusions. At least for me. In Germany you are kind of a bit of an oddball if you're interested in money and stocks in your spare time. That's why I love this forum and the input and exchange with you all even more. Thanks!
-
Thank you very much, @Crip1! That resonates a lot with me. I bought my first BRK share in 2007. That was the first time I had really invested after a few very early, very small attempts with only a few hundred Euro (before that, I simply didn't had any money to invest, but I read a lot about investing in the 2000s, as it fascinated me). Buffett inspired me greatly, which is why BRK was my first investment. MKL/FFH followed in around 2012, but only as very small positions in the beginning. After a (very successful) foray into the world of momentum investing (but only combined with strong balance sheets!), I then switched to long-term compounding/quality GARP; and I expanded BRK, MKL and FFH more and more through reallocations, although the other investments performed better over the first years, but weren't as safe from my point of view. In recent years, FFH's run has been to which I now have 65% in the three, whereas previously the three were rather below-average performers. Anyway, that concentration wasn't planned, but now I think I just became a focus investor...
-
We seem to be invested relatively similar. 4 times more FFH than MKL and BRK. What‘s your rational in holding all three? Is it the combination of float investing, relatively high investment into equity (in contradt to other insurers investing more into bonds), value approach and honesty of management, decentralization, culture, diversification/serial acquirer? To me, that similarities define their moats and outperformance.
-
I am a bit surprised. Doesn’t your recent post regarding ressources point in the opposite direction? Positive (or am I wrong?): - Oil, gas, gold - all up. Fairfax holds a lot of stocks with relations to that. - Bond yields are up: So every day the war continues, some bonds role over; those are yielding higher now - good for FFH. (don‘t forget, for every dollar in equity, FFH holds 2 dollar in bonds. Yields were below 4% befire the war began, now they are up to 4.1x%. - inflation goes up (or: don‘t get down that much). Good for premium growth in P&C, as the recovery costs are rising and insurers have to pass the costs to insurance clients. - And there is volatility in stocks - good for FFH as they are a cash machine, having to invest somewhere. So the chances are rising to find interesting, cheaper new investments - There’s also a drag on FFHs stock price - so buybacks are cheaper and returns on buybacks are higher. Negative: - Greece and other countries stocks are down (but not necessarily intrinsic value, or just a bit; so maybe buying opportunities at stocks, where Prem is already interested) - TRS down (so less returns shortterm) So my thinking would be: - TACO scenario would be like a shortterm push on nearly all fronts, so net positive - longerterm positive as well (and following your argument even more buying opportunities occuring) What do I miss?
-
While I would buy FFH and not MKL today, I think such comparisons as an argument can mislead in a major way. Just an example: End of 2010 FFH stood at $300 and 10 years later - again. That's without dividends, but that wouldn't really move the needle. And MKL? Went from $380 to $1,000. More here: https://stockanalysis.com/stocks/compare/mkl-vs-otc:frfhf/ Imagine you would have invested more into MKL back than with that comparison as an argument, and less into FFH. I mean: MKL was way better in that decade, wasn't it? You would have been much more happy holding MKL (and BRK) most of the 2010s than FFH. In the 19 years from 2003 until 2022 the returns of both were equal (That's not totally true, as FFH paid dividends, but you get my point...). What would that have told you? They seem to be really equal (and I don't know about the years before, as the chart begins 2003, so might be even longer equal) And don't forget: Fairfax went through very strong valuation differences during the crisis at the beginning of the millennium... If another share then also experienced opposite valuations, for example, the results are very insignificant, despite the very long observation horizons. I have held both and BRK since around 2012. I currently consider FFH to be the most promising. But things looked different in 2013, 2015, 2017. Markel did a lot of things right, but that changed between 2016 and 2020: FFH suddenly did more and more things right - and at MKL it was just the opposite. They slid into crisis, particularly in the insurance business, missing the change of bond yields etc. I held to both in the 2010s - and happily loaded bigger on FFH in 2020 (I sold other stocks, as I needed cash; so that FFH became a bigger portion; haven't bought than) and the following years (I bought big in 2022). Yes, taxes are a good reason not to sell MKL; but to me on top of that it feels good, don't put all eggs in one basket (FFH currently accounts for around 45% of my portfolio, with BRK and MKL each accounting for around 10%; that feels better than 65% FFH to me).
-
Life can be really tough sometimes!
-
Thank you, I will have a look at them! Danaher brought a CAGR of nearly 12% over the last 10 years, if I include the spin offs (Fortive and Veralto) and dividends. i still think the DBS being worth something, so I just stick to them. Regarding Sweden: Are you referring to Investor AB, LaTour, or others? Again thank you; I’ll have a look on them. My north star are serial acquirers with insurance companies (and those having better than cost free float), not paying dividends (as I have to pay too much taxes), small (but I like a prove. Track record, so that‘s not so easy to find), management with a value focus, that is able and having skin in the game. Seems we are having a similar focus.
-
2025 Annual Report - Greg Abel's first annual letter
Hamburg Investor replied to backtothebeach's topic in Berkshire Hathaway
A lot of good writings here, thanks! Just one add: I like that he doesn‘t try to imitate Buffett. He has to find his own way. I really liked the annual letters of Buffett of course, but that’s the past now. The small errors highlighted here by some of you might be a bad sign, but I don’t think so. At least for now. But definitely something to have an eye on in the future. For now I am much more happy with that than getting some AI „enhanced“ text. To me it seems he’s showing himself and his view and that’s a good sign. It‘s hard to follow after Buffett. I wish him all the best!