Leaderboard


Popular Content
Showing content with the highest reputation on 07/10/2023 in all areas
-
I did the math to solve for the DRIP and the multiple expansion for BRK and contraction for FFH. The spread narrows quite a bit. That’s what I call margin of safety.1 point
-
2023 Invesco Global Sovereign Asset Management Study https://www.fundresearch.de/Invesco-Global-Sovereign-Asset-Management-Study-2023-FINAL.pdf "India exemplifies the attributes sought by sovereign investors. Viewed increasingly positively for its improved business and political stability, favourable demographics, regulatory initiatives, and a friendly environment for sovereign investors, India has now overtaken China as the most attractive Emerging Market for investing in Emerging Market debt"1 point
-
Most self-acclaimed investment experts fail to include dividends in return calculations. Dividends make an unexpectedly extraordinary difference to total return due to compounding. Since Berkshire never paid a dividend, those making these comparisons get yet more Buffett brainwash. Prem had to write the following in 2022 letter (page 31) to remind us for our own benefit: "Don’t forget the dividends in your return calculation!"1 point
-
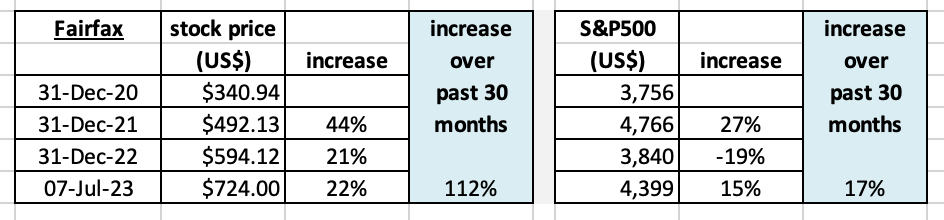
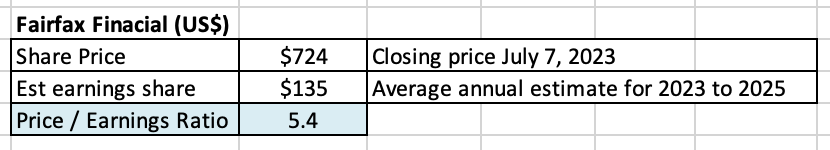
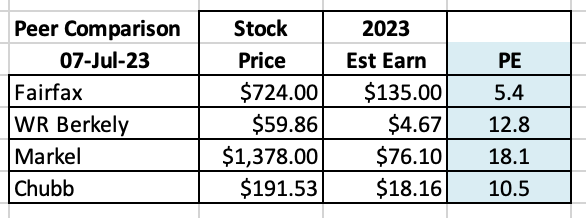
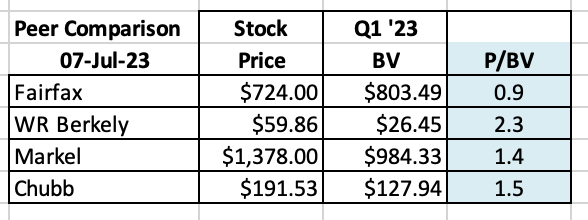
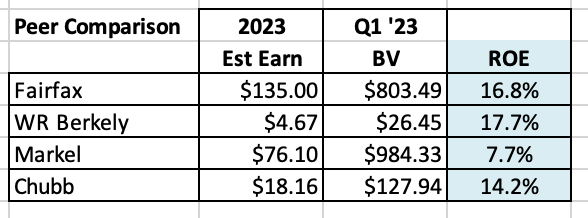
Is the stock priced properly? Efficient market hypothesis: “The efficient market hypothesis (EMH) is a hypothesis that states that share prices reflect all information and consistent alpha generation is impossible. According to the EMH, stocks always trade at their fair value on exchanges, making it impossible for investors to purchase undervalued stocks or sell stocks for inflated prices…” Investopedia A lot has happened at Fairfax over the past 30 months. Let’s do a quick review and see what we can learn. Most importantly, is the stock priced correctly, as the EMH would suggest? How has Fairfax’s stock performed over the past 30 months? First, let’s get some context. Fairfax has been one of the best performing stocks over the past 30 months both in absolute and relative terms. The outperformance has been remarkably consistent each year. Fairfax’s stock has outperformed the S&P500 by 95% over the past 30 months. That outperformance must make Fairfax one of the top performing large cap (in Canada) stocks over the past 30 months. Does this mean the stock is now expensive? The proverbial ‘big fish that got away’ from investors? Let’s find out. Let’s try and keep an open mind. What do the numbers tell us? And what about management? And future prospects? Let’s start by looking at the traditional valuation tools: Price to earnings ratio (PE) My current estimate has Fairfax earning about $145/share in 2023 and $135 in both 2024 and 2025. I view this as a mildly conservative estimate for the next three years. I’ll provide more details in my 3-year earnings forecast for Fairfax - coming in the next week or so. Importantly, the quality of the earnings being delivered by Fairfax are the highest in the company’s history; it is primarily being delivered by record operating earnings (underwriting profit + interest and dividend income + share of profit of associates). All three individually are at record levels. We learn in the chart above that Fairfax is trading today at a forward PE multiple of 5.4 times. That is crazy cheap, especially given the quality and durability of earnings. What is the PE multiple of the overall market? The forward PE multiple of the S&P500 is 20. Fairfax’s stock is trading at a SIGNIFICANT discount to the S&P500. Fairfax’s stock price could double from here and it would still be trading at a 50% discount to the S&P500 multiple. How about compared to some P&C insurance peers? Looking at PE, Fairfax is trading at 48% (Chubb) to 70% (Markel) below peers. Fairfax’s stock looks dirt cheap. But let’s keep digging. Price to book value multiple (P/BV) and return on equity (ROE) Let’s now look at the price-to-book value (P/BV) and return-on-equity (ROE). These two are the preferred metrics used to value insurance companies. Let’s start with P/BV. How does Fairfax stack up compared to peers? Looking at P/BV, Fairfax is trading 36% (Markel) to 61% (WR Berkley) below peers. How about ROE? Looking at ROE, Fairfax is poised to deliver an exceptional 16.8%, at the high end compared to peers. What can we conclude after looking at the valuation metrics? Looking at PE and P/BV, Fairfax’s stock is exceptionally cheap compared to the market and peers. At the same time Fairfax is delivering best-in-class ROE. This makes no sense. Let’s keep digging. What about management? I recently did a long-form post where I reviewed capital allocation at Fairfax over the past 5 years. Bottom line, it can be argued that Fairfax currently has a best-in-class management team (compared to peers). The mystery deepens. What about the future prospects of Fairfax? Fairfax has three engines driving its business: Insurance: Fairfax has grown net premiums written by 400% over the last 9 years. At a 95CR, underwriting profit is on track to be a record $1 billion in 2023. Investments - fixed income: Fairfax has navigated the spike in interest rates masterfully in their $40 billion fixed income portfolio, moving to 1.2 years average duration in Dec 2021 and then pivoting and moving to 2.5 years average duration in Q1 2023, locking in higher yields. As a result interest and dividend income is expected to be a record +$1.5 billion for each of 2023, 2024 and 2025. Investments - equities: Fairfax’s $16 billion equity holdings have been performing very well, lead by Eurobank and total return swaps on 1.96 million FFH shares. Most importantly, all engines are performing very well at the same time, perhaps for the first time in the company’s history. Significant asset sales over the past 12 months have been icing on the cake: pet insurance ($1.4 billion), Resolute ($626 million+$183 million CVR), Ambridge Partners ($400 million). In short, Fairfax’s prospects have never looked better. What are external groups saying? AM Best, the credit ratings agency who specializes in insurance companies, just upgraded Fairfax’s ratings (including those of its two largest subs - Odyssey and Allied) because of its much improved financial profile. Most sell-side analysts have been warming to Fairfax over the past year, repeatedly increasing their estimates and target prices. Most have Fairfax as ‘outperform’ and a few have it as a ‘top pick’. Conclusion What did we learn about Fairfax? The stock price is unambiguously cheap in absolute terms and when compared to peers. The quality of the earnings are high and durable. The management team is best-in-class. Future prospects have never been better. Ratings agencies are drinking the Kool-Aid, with upgrades. Sell side analysts are drinking the Kool-Aid, with upgrades. The cheap stock price stands out like a sore thumb. How do we explain it? The answer is simple: Mr. Market is wrong. Now I know, according to EMT, this is not supposed to happen. What we have today is a real life example of where the efficient market hypothesis is bullshit. At least in the short run. We have situation where Mr. Market is grossly mis-pricing a stock. Now I do think the EMT is generally accurate over the medium to long term… the mis-pricing usually does not last for long. The disconnect with Mr. Market is fundamentals. The fundamentals have been improving at Fairfax for the past couple of years but are just now showing up in earnings. It’s like Mr. Market has been standing on the beach the last couple of years wondering why the water is running out to sea. The answer is we have a tsunami of earnings coming from Fairfax in the coming quarters and years. Mr. Market will figure it out. But in usual fashion, only when the wall of water comes crashing in (wiping out all the wrong-headed thinking on the company in the process). "What a shocker!" everyone will say. "Who could have known?" A similar thing happened to Fairfax in the 2006-2009 period. The coming spike in earnings is not a surprise to those who follow the company closely. So we are in this surreal environment where the future is kind of knowable (a spike in earnings leading to a spike in the share price). What to do? Trust the analysis (be right). Get the correct position size. Have patience (sit tight). ————— “And right here let me say one thing: after spending many years in Wall Street and after making and losing millions of dollars I want to tell you this: it never was my thinking that made the big money for me. It always was my sitting. Got that? My sitting tight! It is no trick at all to be right on the market. You always find lots of early bulls in bull markets and early bears in bear markets . I’ve known many men who were right at exactly the right time, and began buying and selling stocks when prices were at the very level which should show the greatest profit. And their experience invariably matched mine - that is, they made no real money out of it. Men who can both be right and sit tight are uncommon. I found it one of the hardest things to learn. But it is only after a stock operator has firmly grasped this that he can make big money. It is literally true that millions come easier to a trader after he knows how to trade than hundreds did in the days of his ignorance.” Reminiscences of a Stock Operator
 1 point