

zippy1
-
Posts
600 -
Joined
-
Last visited
-
Days Won
4
2 Followers
zippy1's Achievements






-
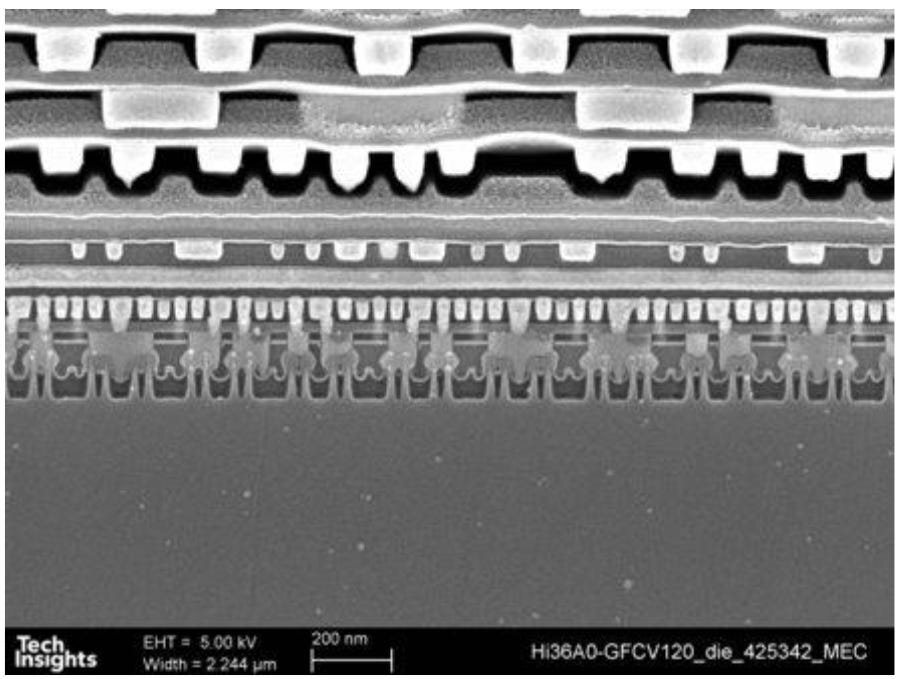
KLA does have e-beam inspection. It just that it missed the opportunity to be the leader about 10-15 years ago when it did have technology but chose not to offer it. That gave the Taiwanese upstart a chance to get into the market. Once the Taiwanese upstart got bought by ASML. Suddenly, the upstart had access to the huge resources of ASML. However, the optical inspection business will continue be there even as the "scaling" continues. If you look at a cross section like below. The smallest parts at the bottom will be scaled and will need e-beam inspection. The top parts will large features will stay with optical inspection. KLA will do fine. This is not an "e-beam inspection replace optical inspection" story.

-
Years ago, we were working on 28nm high-K metal gate. A friend was comparing three vendors on how they can inspect the metal gates. Only the one with E-beam inspection can do it. My friend typed up the memo and our company bought a lot of the e-beam inspection tools.. Of course, my friend can only watch that stock rockets.... The stock got bought out by ASML in 2016...
-
KLA is dominant in the optical inspection. ASML actually is dominant in the e-beam inspection, which is needed for the smallest dimension check. There was a dominant Taiwanese company, who got bought out by ASML in 2016. The legend was the KLA worked on e-beam inspection but did not make it a product for fear of disrupting their own optical inspection business. This Taiwanese upstart worked on e-beam inspection, which got adopted around 28nm node when metal gate structures needs e-beam inspection. it then was bought by ASML. I
-
Most of these other suppliers for othe equipment, the foundries can have second sources.... ASML is a bit different in suppliing EUV. ASML makes EUV and DUV-immersion. Nikon can make DUV-immersion but no EUV. Canon only make DUV and older ... ASML cannot raise price by 50% like many had said since there are only a few customers. However, the customers cannot ask for price cut either since there is only one supplier... The customers can try to double patterning or quaduaple patterning to stay with older machines. However, this just means not using EUV-High NA and stay at EUV. Both EUV-high NA and EUV are from ASML.
-
Doesn't Delta own a refinery? Shouldn't this give them an advantage?
-
By sampling the price-to-fair-value (P/FV) ratio at major "step" intervals on the chart, we can see how the market typically premiums this specific Fair Value estimate: Date Period Estimated Price (C$) Fair Value (C$) P/FV Multiplier Current (May 2026) 2,258.09 1,850.00 1.22x Jan 2026 (Peak) ~2,550.00 ~1,700.00 1.50x July 2025 ~2,450.00 ~1,500.00 1.63x Jan 2025 ~2,000.00 ~1,250.00 1.60x July 2024 ~1,500.00 ~1,150.00 1.30x Jan 2024 ~1,250.00 ~950.00 1.31x July 2023 ~950.00 ~750.00 1.26x The stock price rarely touches the Fair Value line. Instead, it tends to bottom out around a 1.2x to 1.3x multiplier (as seen in July 2023, Jan 2024, and the current May 2026 dip). So now is a good time to buy if you trust Brett.
-
Try google "國進民退"。 People are saying today's China exhibit something similar to what happened in 1950s. Be careful over there.
-
Sanchez seemed to have folded?! I kind of agree with you.
-
Whatever they say you should not do, they are doing it. That is exactly the reason why they don't want you to do it. Cheers!
-
Toshiba? https://www.global.toshiba/ww/products-solutions/nuclearenergy.html
-
Exclusive | China tells EU it does not want to see Russia lose its war in Ukraine: sources https://www.scmp.com/news/china/diplomacy/article/3316875/china-tells-eu-it-cannot-afford-russian-loss-ukraine-war-sources-say Maybe these are related?
-
Oct 2017 was my first B share buy.
-
March 2007. I was wondering who has CDS bets.
-
Sadly, however, I would think this kind of things will continue to happen. I would certainly pay attention to this kind of situation. This kind of shift in the supply chain has created great investment opportunities in Taiwan.
-
Does this German manufacture has a name?