Hamburg Investor
-
Posts
229 -
Joined
-
Last visited
-
Days Won
2
Content Type
Profiles
Forums
Events
Everything posted by Hamburg Investor
-
You’re right, thank you. I misinterpreted the following from the annual report: „We can see sustaining our adjusted operating income for the next four years at $4.0 billion … or about $125 per share after taxes, interest expense, corporate overhead and other costs.“ I didn’t expect the absolute numbers being before taxes and the per share ones after. But I should have known better. Doing the maths with 125 dollar after tax and an assumption of 10% taxes on stocks (what would be realistic?), my back-of-the-envelop maths tells me the return would be around 95% instead of 128%. Still very good and cheap.
-
Looks like we‘re heading for a double in bvps within the next three to five years again: - minimum of 4bn / year adjusted operating income - that’s essentially what Prem writes. That’s 16+bn in 4 years. Let‘s be conservative and say 16bn. - But don‘t forget: There‘s additional compounding happening with the yearly returns within those 4 years. So 4 times 4bn would not end with 16bn additional equity after 4 years; that would compound to 18.6bn at the end of year 4 assuming a cagr of 10% (and 20bn assuming an roe of 15%) and compounding starting after the first of the 4 years. Let‘s be conservative and say 10%. So that’s 18.6 bn after 4 years. - Fairfax has 16.5 bn in stocks (market value). Let’s again assume a roe of 10% (yes, after paying dividends, I don’t have the exact numbers here, do you?). That‘s 9.2bn (13.4bn if invested at a roe of 15%) in additional equity after 4 years. - Okay, so let’s put that together: We have an additional equity of 27.6bn after 4 years for a company with equity of 21.6bn at the end of 2023. That’s 128% or a cagr of 23%. Wow. - Yes, maybe an roe of 10% on stocks excluding dividends is too optimistic. But than there are the greek and indian investments that might give way higher returns. Eurobank has a pe ratio of 6 or so. The digit IPO, Prem might come up with another pet insurance business. And we could be more conservative. Why not round the 128% down to 100%? That‘s a nice margin of safety, isn’t it? The rule of 72 still tells us, that this would be a roe of 18% over that 4 years instead of 23%. Maybe that’s not enough margin of safety? O.K., what if it took one more year for that double, so 100% in 5 years instead of 128% in 4. That’s still 15% roe. At 940 equity, 15% roe would be 141 dollar in normalized earnings. I’d happily pay a PE ratio of 15 for a business with a roe of 15%, while the average S&P500 company has a pe ratio of 27.8. Ups, 15 times earnings… would be 2,115 dollar. Fairfax still has a normalized pe ratio of under 7 assuming not 23% cagr but 15% (141 dollar / 940 dollar). O.K., let’s circle back: I assumed 10% as roe for the reinvested earnings. But if Prem would buy back his stock, and that compounds at a roe of 15% (or way more… ) at a pe ratio of 7, than this easily earns 15% and maybe even 24% or even more with that investments. But if I assume a roe of 15% as a return for the „new“ equity, than the roe for Fairfax as a whole is even better and the buybacks are even cheaper, more attractive. Okay, but Prem will not invest a lot of cash for buybacks, at present. That’s what he said. Not now. But than this only makes sense, if he’s sure finding investments with returns above 10% on equity, even north of 15%. Anyway, my main take away reading the annual report: 2023 was a third fantastic year in a row, and at least four more are coming. That will be a nice 7 year track record looking back in 4 years. Hard to imagine, Fairfax being valued at only 1.2 pb ratio. But it‘s Mr. Market, so we‘ll never know.
-
-Poll- How much Fairfax does the board own?
Hamburg Investor replied to Luke's topic in Fairfax Financial
45% Fairfax Financial, 1.5% Fairfax India -
Thanks, @Cigarbutt, that's really helpful. I know I have to dig deeper into what happend especially at the beginning of the century for getting a deeper understanding. It sounds like you want to name other points - what is it?
-
How do you get to that estimate? Seems a lot to me, but I have no clues whatsoever.
-
What else can you say but: Thank you! The picture gets richer every time thanks to the different perspectives you offer and which are necessary for a deeper understanding. What strikes me when watching your last chart: Every single "Non-Berkalike" (I don't like the term, but still...) exploded in valuation, meaning the Price CAGR exceeds the book value CAGR in that 5 year view by miles: Non-Berkalikes: - Intact: 6.8% (17.7% minus 10.9%) - WRB: 11.7% - Chubb: 7.8% - AIG: 11.9% While the Berkalikes (including the original): - BRK: 1.0% (14.3% minus 13.3%) - MKL: (4.0%) - FFH: 1.0% On average the non-Berkalikes Price increase exceeded Book value growth by 9.6%, while the Berkalikes performed (0.6%) in that category. And Apart from AIG, the non-Berkalikes are currently all valued higher (PB ratio). And AIG should certainly be excluded for other reasons. Is this simply coincidence, as its only seven data points? Or is it due to the unorthodox, difficult to understand structure with "owned businesses" and the high level of involvement in publicly traded companies? A different shareholder structure? Mr. Market is going nuts again? Anyhow I would be quite happy if the share price could stay where it currently is and Prem would buy back the company with the profits from the next few years. In less than a decade, the company would belong to the readers of cobf...
-
Yes - thanks, I changed that.
-
I could not agree more. I just became aware of that mangement change with Andy Benard here at cobf, so this was like an important mosaic for me for getting a deeper understanding. Regarding returns the question appears: If FFH made with, say, 5.5% worse CR that performance of the 1990ies and they had those headwind with low interest starting from 2011 - what will be the "new normal returns", when they manage to hold the quality in insurance and having much less headwind from interest rate etc. And yes, they are bigger today, so that's worse in comparison to the 1990ies, but still - to me that looks more like a tailwind and not like additional risk. I don't think Buffett would have made that strong returns in the 1970ies and 1980ies, if interest rates and inflation were like in the low interest years of the last decade.
-
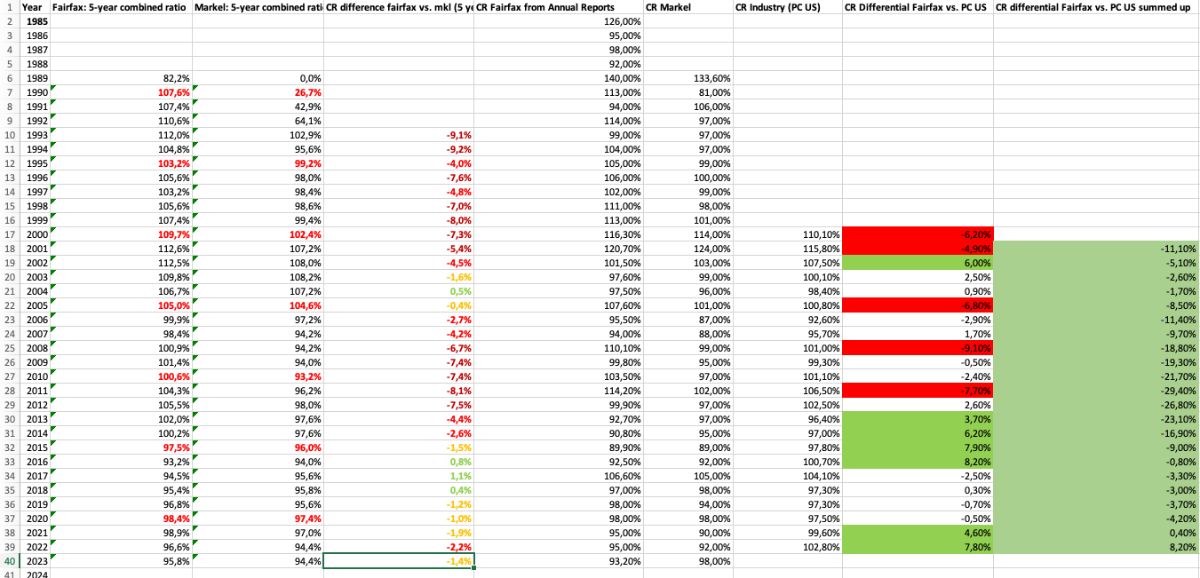
has no longer been lagging behind the market since 2011, but is ahead of it Wow, that's a great work! Attached please find a screenshot and an .xls sheet. Maybe it finds your interest? The question I wanted to find an answer to: How has Fairfax CR developed over the years? What is the trend? In the centre you'll find a comparison of FFH to the US PC market and to Markel (on a 5 year average basis): In the years 2001 to 2011 Fairfax summed up combined ratio was 30 points worse than the markets. Since than it performed 38 points better than the market. It's remarkable how harsh and abrupt this improvement happened. In principle the same development can be watched when comparing FFHs 5 year average CR against that of Markel. Fairfax historically performed poorly from the beginning. The worst 5 year performance against MKL (excluding 1992 and 1993) can be found in 2011: On average FFHs CR was 8.1% higher than MKLs. Than from year to year it goes down: 2011: -8.1% 2012: -7.5% 2013: -4.4% 2014: -2.6% 2015: -1.5% 2016: +0.8% 2017: +1.1%. Since than FFHs lost 2.5% but seems to stay in a range having a CR 1% to 2% above MKL over 5 year timeframes. There's one exception: After 2001 until 2004 FFHs CR ratio improved. My best guess is, that FFH changed its insurance portfolio after 9/11; but I am pretty sure others here know better than me. What are the effects? What is the overall message? Since 2011, Fairfax has developed from a very unprofitable insurance company into a very profitable one. The intrinsic value of the insurance business has thus increased enormously; not only because of the premium growth. But above all because of an enormous increase in profitability. It is often pointed out that lower interest rates mean that all insurers have to work more profitably; so FFHs CR ratio getting better would not indicate an improvement in the business. This seems logical, but can't neither be watched at Markel nor at the US PC Insurance industry. Which I find astonishing; does anybody have better numbers for comparison? Have I taken the wrong numbers? What is evident, however: Fairfax caught up with Markel from 2011 to 2017 and has barely slowed down since then. What is evident, too: Fairfax has no longer been lagging behind the market since 2011, but is ahead of it. Until 2011 FFH was around 2.5% worse than the US PC Insurance market per year on average (which is not perfect as an "index" to compare FFH with; but what would be better, where we get numbers easily?! I have been searching for a long time and would be grateful for any tips). Since 2011 FFH is 3% better on average than this index. That's a differential of 5.5% per year pre-2011 to after 2011. Sorry, if the way I show numbers is not like you do in the US. In Germany we sometimes use "," where you use ".", we use "+" (positive number) and "-" (negative number). etc. On top of that some numbers I use might be wrongt (e. g. the CR change years after they are presented first time; so I tried to find the best I could get). I don't think better CR numbers would change the general direction; I am a bit unsure regarding a better comparison than the US PC market, as I am not an insurance guy. @jeyfox: If you want to add some numbers to your excel, please feel free. Maybe the consolidated CR would fit? And would be intersting to see the 2023 update. 20240221_CR_VergleichFFH_MKL_BRK_Zahlen.xlsx

-
Regarding roe and valuation: The actual pe ratio of the S&P500 is 27. My best guess is, that the average stock has an roe of about a bit above 11. That‘s the return of the S&P500 over 100 years or so, if I remember correctly. So in my eyes the insurance stocks in general are totally undervalued, if compared to the market. If I can buy FFH at a pb ratio of 1.1 and it gets an roe of 15%, that’s a pe ratio of 7, right? What do we normally like to pay for a business with an roe of 15 today? You don’t find a lot roe 15% businesses with a normalized pe ratio under 20 these days. And Fairfax can be bought at a pe ratio of around 7. So a third of what I would think would be a low price in todays markets. So if Fairfax price would triple tomorrow and it could reach an roe of 15% over the next 20 years, than I am pretty sure buying FFH at that three-times todays price you’d beat the market with that investment. Sounds crazy, doesn’t it? But you‘d have an above average business (roe of 15% versus markets roe of 11%) for an under average price (pe ratio of 21 for FFH after tripling versus pe ratio of 27 for the market). That would be a pb ratio of 3.3. But with an roe of 15%, the bvps of Fairfax would 16-fold in 20 years, the markets bvps would just 8-fold. So after this triple, FFH would double the markets return. So bets should be pretty good to beat the market, if FFHs price wouldn‘t tank like in 2020. If FFH could reach the markets roe of 11 it still could outperform the market (you would buy the average business for a cheaper price than average - after FFH trippling). Of course, a pb ratio of 3.3 seems high as we are all not used to pay that normally for an average insurer. Still it’s only buying the average business at below markets pe ratio. I am not saying anybody should buy FFH at those trippled prices; I wouldn‘t. But it shows the downside protection to me. And that insurance is cheap compared to other sectors. And that buybacks are a good idea at todays prices.
-
I don‘t think we are far away from each other and do agree, that returns weren’t good and that it’s worth looking back and not thinking, FFHs future will always be bright. There will be ups and downs. But it‘s important to understand, that the years until 1999 weren’t just normal times; and after they weren’t too either. In particular I think, that what we see in the rearview mirror since 1999 was much more headwind for the insurance sector and value investors (and FFH and Prem are both), than on average since over a hundred years: - a long phase with the lowest interest rates ever; and it weren’t high in the years before. So on average - really low. - growth beating value. Of course that’s a product of low and lowest interest rates. - 2 of the 4 severiest bear markets (and the second best bull market). - the rest is just normal „noise“ over such a long timeframe. It is no coincidence, that Berkshire and Markel weren’t reaching their goals too within that timeframe. All three performed better in the nineties and before. And while Markel and Berkshire were outperforming FFH since 2009, Markel struggles a bit at the moment, and FFH now is catching up with both. So while I agree that the outperformance of all three will not be as good as it‘s been in the 90ies (and before), I also think that the chances are good that the three might outperform the market a little bit more than within the last decades and reach their targets. Maybe we’ll live in another two decades with low interest rates, soft markets and growth beating value. If that happens, I am glad if they are a bit above the market average. But if the circumstances go back to normal (whatever that is…), than I think insurance and in particular the outperformance of the three named should widen and FFH could reach the goal of 15%.
-
I don‘t agree with your phases. It seems attractive at first sight, but it’s too simple: Generally speaking a part of FFHs book value return has always been bound to the stock market. So it is no coincidence, that your first phase tracks the best bull market in history (started in 1987). In the following 10 years 2 of the 4 worst bear markets in over hundred years hit the stock market (tech bubble and financial crisis). Followed by the second best bull market in history, the recovery from the financial crisis with ultra low interest rates, that the world had never seen before. I don’t disagree with the idea, that FFH will not be able to repeat the returns until 1999, as those returns had a lot to do with FFH being small, having a lot more float to assets than in the following years, being in a hard market and having wind from the back with the best stock market returns ever. But by ignoring the tailwinds in the first phase you overestimate FFHs own ability in your first phase and underestimate it in your second (where much more headwind can be seen). Let‘s look at the second phase: - 2000 until 2002: „9/11 and tech bubble crash: Welcome to reality“ These years were very special. Although Fairfax had own problems, the big points were the World Trade Centre (which hit the cr of FFH hard) and the collapse of the markets after the crash of the tech bubble and after 9/11 (so 9/11 hit FFH double, as it not only hit the cr but also hit stock prices) and a hard market (which ended 2003). This would be my second phase. - 2003 until 2009: „Good years again“ From 2003 (so after the bear market from 1999 to 2002) until 2009 (so over a full cycle) the returns of FFH are good, especially if you count in the drag by the soft market kicking in 2003 and lasting until 2010/2017). Prems returns weren‘t special until 2006, but with betting against the housing market became superb until 2009. That would be imho my third phase. - 2009 until 2016: „Turning to black: The lost years“ In the years 2009 until 2011 a lot of things changed to the bad: Interest rates collapsed (so headwind for the insurance sector), the insurance market hardened a bit (only to get soft again some years later until 2017; on average it was a flat market in this phase), „growth outperforming value like never before“ (a drag for Prems stock returns, being a value investor; that ended 2020), bad hedge decisions of management started. This phase ended 2016. „The lost years“, partially through bad management decisions, as discussed here oftentimes - but there were a lot of headwinds to the insurance sector and Prems investment style in particular. - 2016 until 2020: „The hidden turnaround years“ Still growth beat value, even more. But the insurance market began to harden. Management started to turn things around. Management performed maybe better than ever, growing insurance business and widening its international foot print, ending hedges, good investment decisions. But nobody sees it. The headwinds are too strong. Book value doesn‘t reflect, what’s happening under the surface. - 2021 until????: „Fairfax shines again“ Rising interest rates and inflation kicked in, value beating growth again. The market is hard now. So these are again external factors, that gave and give a tailwind to the insurance sector and to FFH in particular. But again Management nailed it: Perfect management of bond portfolio.
-
I'd say "a more riskless version of debt". And leverage and leverage can be very different in terms of risk. Berkshire Hathaway was also heavily float hedged for a long time. I sometimes get the impression that many people forget that. You have to make a decision: Either Warren actually took on too much risk for a long time and got pretty lucky. Or Warren's way of using float was good in terms of risk adjusted returns. You can't say both. As investors, we need to understand how to minimize risk. I think float is a key technology to achieve high risk-adjusted returns. Of course, you can't go too far with float. I've heard a lot of value investors say that a big mistake was not buying Berkshire Hathaway in the 1970s or 1980s because the price was too high for them. Risk is higher with more float, as it is with every "more" of any leverage. We don't disagree on that one. We don't disagree on BRK being a fantastic company and being the last to fall (that's why it's my second biggest holding with 14%). Where we disagree: I think 130% of float like at FFH is ok and the chances are higher than the risks (so higher price is ok); and you say the opposite - the float risk is so high, that even higher "normal" (so the roes in the times where the business is not wiped out nearly totally) returns on equity do not justify a higher price, but the other way around. This is not black or white and everybody has to define his risk tolerance. That's fine. I don't think there are a lot of ways for getting high roes with less risk than by using (not too much) float. There's no free lunch. Without taking risk, no return. Risk comes from not knowing what you're doing. Don't loose money. Don't forget that rule. Of course. Simple rules, but still not easy to do. There are a lot of other risks to consider when comparing Berkshire versus Fairfax. The country risk. I would consider this to be greater at Berkshire than at FFH with its rapidly growing international insurance business and its large positions in India and Greece. The management risk. I would also rate this higher at Berkshire in the long term, as management at Berkshire is likely to change much sooner than at Fairfax; and Prem has a longer track record in his position than Warren's successor (who has experience, but as CEO of Berkshire he starts with a track record of 0 years). BTW: I have a small portion in Protector Forsikring, a Scandinavian investment company that is growing very fast and of course it does so with a high float compared to the assets, the management is great. Sometimes I wonder if I shouldn't have more than just 1.5% in Protector; but I don't as their track record is not long enough for me (20 years. Writing it that way, it does seem quite long now).
-
Isn‘t that thinking about price to book ratios a bit „static“? In the end it‘s all about roe and not equity alone. And I see FFH better positioned fir a high roe: - BRK is more like a conglomerate with an additional insurance arm. I haven‘t the exact numbers, but BRK has around 35 per cent leverage on equity through float; while FFH has around 130 per cent (and MKL is somewhere in between). - Assuming both FFH and BRK get 4% on float and both get 10% on equity, than BRKs return on equity would be 11.5% and FFHs would be 15.2%. If it’s 6%, than BRKs roe is 12.0%, FFHs 17.8%. Even if BRKs „real“ equity would be bigger, it‘s returns on that equity will be lower for sure, so FFH will grow stronger - BRK is 25 times bigger than FFH. It‘s pretty hard getting high roes for BRK over the next 1 or 2 decades on its equity; not so for MKL/FFH. - Just look at 2023 and the next 4 years: It‘s hard to argue for an roe way under 20%. That‘s a double on equity every 3.6 years (with 18% it’s every 4 years). I don‘t know anybody seeing BRK doubling every 3.6 or 4.0 years; that could happen to FFH though (I am not predicting that, but there is a chance). - And today it’s way more normal times than it‘s been with such low interest the years before (if interest is zero, than it‘s way easier for BRK to not loose against MKL and FFH, as float doesn‘t give any returns, but FFH is levered most. - MKL and FFH both grew stronger than BRK since 1986; I don’t see any reason, why that should change ultimately. - Munger once said something like (from memory): In the end kver very long timeframes your CAGR return will be relatively close to roe; regardless if you pay a high or low price. - That’s why I think, I‘d happily pay way higher pb ratios for FFH than for BRK. Let‘s assume an roe of 15% (Prems minimum goal…). What do I like to pay for that? Maybe a pe ratio of 15 to 25, let’s say 20. 15% roe on equity gives earnings of 0.15 at a pe ratio of 20 gives a pb ratio of around 3 to us. And BRK? Let’s say roe of 12% is doable. Than a lower pe ratio seems reasonable - say 15. Than you get a pb ratio of 1.8.
-
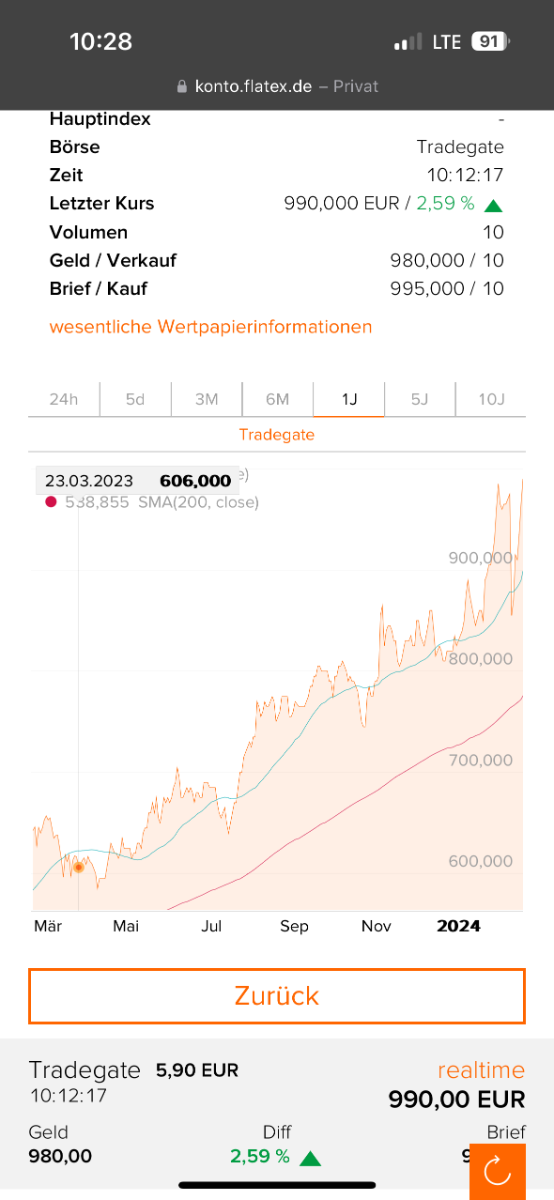
Fairfax trades at 990 Euro at Tradegate in Germany for a record in Euro. That‘s 1.436 cad and would be a new alltime high too. Up around 2.5%. Tradegate Germany is thin trading with stocks from Canada and it doesn‘t always tell you the opening price at TSX; but still - it‘s a record.
-
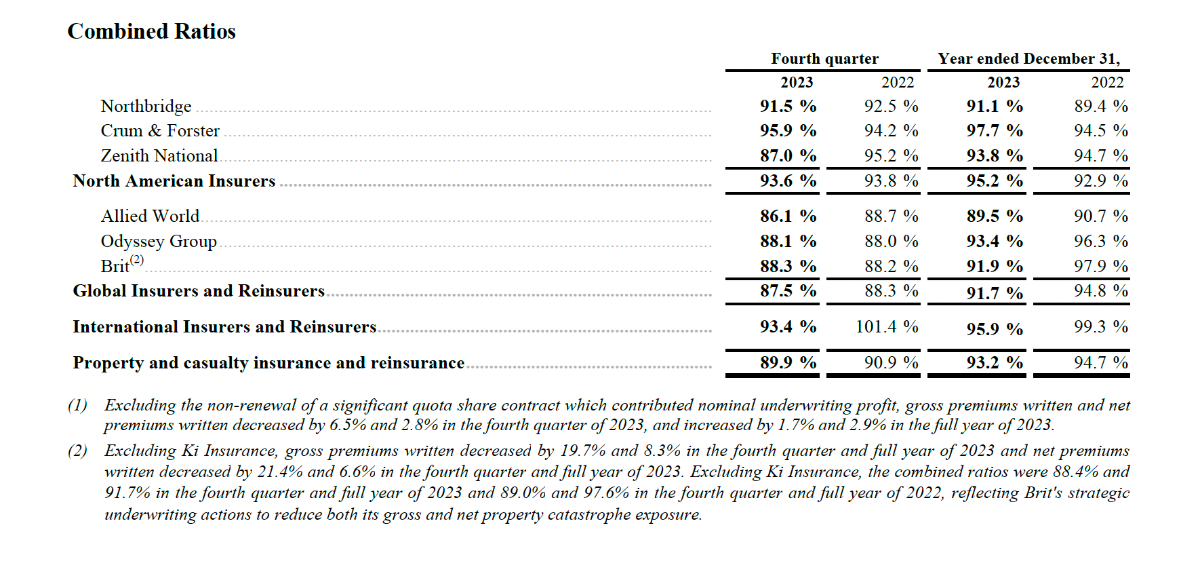
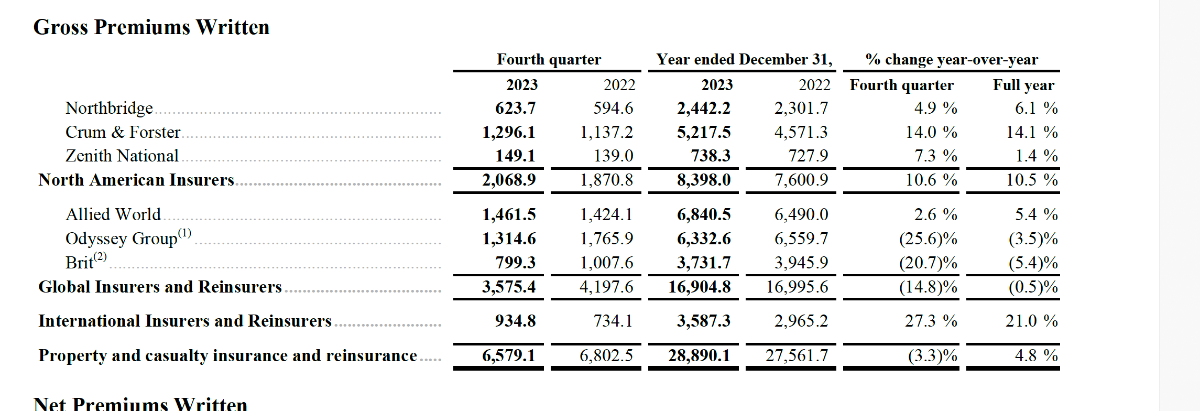
My main take away regarding the insurance segment: "International Insurers and Reinsurers" is taking giant steps from being the third (unrecognized) insurance segment of the three segments to rapidly overtaking the North American Insurers business within a few years. International improves very fast and gets nice CRs. Will International become the crown jewel of the Insurance Business within a few years? Anyway this will be one of the most interesting parts of Fairfax to keep an eye on in the next years and decades. While North American Insurers CR and Global Insureres CR stayed relatively unchanged in q4 in comparison to 2022, Internationals CR improved by 8.0% (!) yoy to 93.4%. FY now is 95.9% GWP within International segment grew by 27.3% in q4 yoy and 21.0% FY 2023. Impressive. As the biggest segment (Global Insurers and RI) shrank sharply by nearly 15% and the North American insurers significantly lagged the enormous international growth, the international segment accounted for 14.2% of Fairfax premiums in q4. (FY 2023: 12,4% / FY 2022: 10,8%). Around half of the premium growth in 2023 in absolute terms has its origin in the International Business. (Have we had that before?) Even though there were special effects in Q4, international business is a significant factor for the first time. It is catching up with the other two segments in terms of profitability and is becoming an important growth driver even in absolute terms. But that's not all: GIG will give another $2.7bn in GWP in 2024 (that's Prems estimate). Add that to the existing $3.6bn from 2023 and give a little bit extra growth and we'll get to around (or maybe above) $6.5bn gwp for the international insurance business in 2024. Compare that number to the $7.6bn GWP in North America in 2023. ... and International is growing stronger (GIG is a strong grower too). ... and International is getting more and more profitable. Why? I don't know, but maybe: economies of scale? The new Insurers are learning from other insurers (Is there a project like at BRK where the CEOs get special meetings)? Is Prem closley watching and investing opporunistically in countries and segments with special "one-time-opportunities"? (With some dozen Countries now, the chances accumulate to get those chances; I would be surprised, if Prem wouldn't like to take those chances) In any case I see some profit in having such a diverse group of insurance companies. It gives diversification, optionality and there's something to learn even for the "old" Fairfax Insurers I guess. OK, I leave it as it is now; it's 2:00 in the morning now and I am really tired. @Viking will give an overview anyway and I am really looking forward to that, so I thought I just pick this topic...
-
"Book value per basic share at December 31, 2023 was $939.65 compared to $762.28 at December 31, 2022 (an increase of 24.7% adjusted for the $10 per common share dividend paid in the first quarter of 2023)." Book value grew $63.10 in q4 alone or 35.6% of the $177.37 bvps of 2023. That's an increase of 8.3% in q4 alone (in relation to year end 2023). Weightes shares outstanding in q4 just reduced by 1.1% / 23,076 in q4 2023 vs. 23,387 in q4 2022 (I don't have the YE numbers of 2022; still that will not move the needle)
-
"By miles" was meant before the catch up of FFH. My other bigger longterm holdings since the crash in October 2011 (that was my - lucky - starting point) are BRK, MKL, DHR (including the Spinoffs), Brookfield (including the Splits) and Smurfit Kappa. They all performed better and the gap widend a lot from the beginning of 2017. Of course, since 2022 Fairfax catched up a lot, still it lags the others, most by miles. But I am hopeful, that will change now.
-
Over all the bad years of Fairfax to me it always felt like the contrarian stock to the mainstream. The inflation hedge (to me fairfax was the insurance against a black swan event back than). Going into greece when it almost collapsed. Going into old style businesses, when the rest of the world was going into tech and growth and china. Going into africa and india felt like a useful diversification (which in a way doesn't make sens, as I view myself as a focus investor...). I wasn't aware that interest would stay so low for such a long time. If I knew I would have maybe sold some FFH stock. But I haven't known and I don't have any idea, where interest will stand in - say - 2026. Maybe there's another war, another Corona, maybe China collapses (housing), maybe the world finds its way back to peace? People in Germany weren't aware in 1920, that they would have a hyperinflation some years later. So maybe people could blame me (us?) for holding the stock so long. But I don't speculate on interest or anything; I just want a business that's robust against the downside.
-
@SafetyinNumbers Yes, thanks a lot, I really appreciate you're taking the time . You guys here are so much longer in the investing world and from time to time I need a little bit of assurance... We have way less people in Germany being interested in investing than you guys on the other side of the atlantic have. So I don't really have a lot of opportunities to get in touch with other people, discuss ideas etc. So I read a lot and feel Buffett, Prem & Co talking to me through the books and annual reports; so I really appreciate gett8ng into contact here (and - way less - at Seeking Alpha). And sorry for my english... @dealraker nice comment; from the investments with over 10 per cent of my portfolio, Fairfax has been my worst performer since 2011 by miles for a long time; still it always felt being on the right train. In fact it helped me to learn, that Munger and Co are right, when saying you make money by sitting around and waiting instead of trading.
-
Same here regarding the cost basis. But I can‘t take FFH private and consolidate it like FFH has done with GIG. Unfortunately…
-
Thank you. But how does this work within the buying process of a whole business? First, the asset (stock) is available for sale (afs) at the stock market. Let’s take the GiG deal as an example. Because that‘s part of what MW is referring to. If I get MW right, than they are saying something like: FFH bought the biggest part (was it 90 per cent?) of GIG at a rather low price. And than they bought the last 10 per cent at a way too high price (that’s not what I am saying… was it at a 2.4 pb?). Than FFH revalues the 90 per cent of GIG it already owns at the higher price and consolidates GIG. So buying a rather small portion of GIG defines the value of GIG in FFHs books later on. That‘s what they are actually saying, right? Is that wrong than or doesn‘t your post adress that question? I don’t think, as I’ve written here, that Prem cooked the books. I just want to understand, how a relatively high/low valuation within the books helps or hurts.
-
I read the report of MW. It doesn’t make me nervous being long with over 40 per cent of my portfolio being in FFH, as I think the MW report is very onesided and I don‘t see that FFHs books are cooked. My understanding is, that FFH has and had a lot of assets that were understated in book value. Like the pet insurance business. If Prem wanted to show a high book value „whatever it takes“ he wouldn‘t have to do illegal or ugly things in 2018 or whenever. Instead he could just activate that hidden value. My understanding ist, that it would cost a bit (of intrisic value); but still not so much of it. Why do illegal things, if you could easily legal things and promote yourself way better? Still I ask myself, if I know enough about how and why FFH values its businesses the way it does. How does it e. g. help to buy a business and have it in your books at a high or low valuation? Let‘s say in an example you own 95 per cent of a business and you buy the last 5 per cent: my understanding is, that paying a high price you can revalue the 95 per cent you own at that price. So does having the business booked relatively high help to get a better rating and pay less interest ? It’s obvious, that one shouldn’t push such things to the limit; still my understanding is, that there is no definite number that’s right and valuing it one dollar higher is wrong etc. There‘s a legitimate rabge I guess. Has anyone an idea, how and why Prem values some businesses relatively high (low seems more a function of time, see the example of the pet insurance business…?!)
-
What I tried to say - and I may be wrong, I am not an account, just an amateur investor - is, the following: - the pet insurance business was bought by FFH at a low price (seen from the point of selling; let‘s say $50mn). It was sold 15 to 20 years later for $1.4bn - and the profit was $1.2bn. - So the book value of the pet insurance business in FFHs grew from $50mn to $200mn ($1.4bn less $1.2bn). - Let’s assume $50mn was a fair price, when FFH bought it. Than for nearly two decades the busines value grew anormously to $1.4bn, but that wasn’t represented within the book value of FFH; the book vakue of the pet insurance business just grew by the amount of the reinvested money; but the business seems to not having needed lots of that and still grew stronger and stronger. In the beginning the difference between the paid price and the business value was low and over the years, that difference grew and grew. - So the real value of the pet insurance business was understated in the books of FFH. What could Prem do to make that hidden value visable? As I said, I am not an accountant, but I think he would e. g. have to sell a part of the business and mark the business to market. There may be other and more technics; but from my understanding, FFH would have to pay taxes (as they sell a part of the business) or/and they would loose the possibility to fully profit from the per business (if you sell e.g. 10 per cent, than you only own 90 per cent…). The point is: Making the value of a wholly owned business visible, you need to mark it to market; but there is no market, if you don‘t sell. But if you sell, you loose intrinsic value. Is my way of thinking correct or not?