Stuart D
-
Posts
456 -
Joined
-
Last visited
Content Type
Profiles
Forums
Events
Everything posted by Stuart D
-
What you’re saying makes sense. Both sides can hold on for a while. Continued oil draws eventually drives oil prices way up. I’m sceptical of the US’s stomach for massively higher prices but then again, I also thought Trump would have bailed out ~1-month ago and I was wrong on that.
-
Not open by the end of June, that’s 8-wk’s of ~20m barrel draws in the US, ~160m total. Assuming last week is the new norm (not sure if it is). That’s crazy & can’t (or won’t) happen right?
-
Thank you - I’ll add him as a follow on Twitter.
-
-20m barrel draw last week. Clearly not sustainable. I’m amazed Trump hasn’t declared victory and retreated from Iran completely. Maybe Iran will concede, but if they don’t, what is trump going to do to fix this (oil crisis)?
-
20m bbl draw last week. Not sustainable, so something’s got to give.
-
Shouldn’t this chart alone (new inventory low’s) be sending crude prices to all time high’s? And the counter case? Iran immediately surrenders and guarantees permanent SoH peace, the US and NATO sweep all mines, production restarts and increased global production immediately restarts and restocks inventories? @cubsfan, appreciate the pushback. My timeline is very biased towards ‘oil prices will be higher’, so im keen to hear other views.

-
Is Iran running out of money? I read somewhere (probably twitter) they had months of oil already on the water - it should keep the cash flowing for quite some time.
-
From this chart +1b barrels (7,800mb pre-covid compared to 8,800mb peak covid), was enough to send oil to $0/bbl. At some point the lower inventories will send prices way higher. Is that point -1b barrels? (6,800mb?). I have no idea.
-
~10m bpd offline and oil isn’t >$250/bbl. Really makes you question the oil investment thesis.
-
Those mines are an issue though. Cheap to plant, expensive to remove?
-
Is there any double counting with ETF’s?
-
I'm not following it closely - is this related to Iran?
-
This is a good point. Reminds me of the Buffett AGM where he called out none of the top 10 names from the index 30-yrs ago bring in the top 10 today. Highlighting the benefits of index’s rotating in and out of names.
-
Yes, 100% agree
-
But is there blood in the streets in terms of valuation? $XOM’s trading north of half a trillion dollars. Oil is down at $60 and XOM’s market cap is higher than when oil was >$100.
-
Yes, that’s right. I’m only selling a put if I’m comfortable buying shares at that price and holding for years to come. If I’m not comfortable with the downside risk of owning the shares, then I’m equally uncomfortable selling a put. For me that disqualifies 99% of results from this screener (and most others), including SPY where it currently trades.
-
just for fun, I’m working on a screener for selling 1x put and buying 10x calls, June-2026 expiry. Both puts and calls are out of the money. Only looking to sell a put at a price that I’d like to own the company/index. So downside is a below market limit order and upside is 10x leverage. Screener results below. The first number is an out of the money percentage. e.g. RYLD, 1x put can be sold for the price of 10x calls, with the call strike being 4% out of the money. 10% out of the money for VCLT, 12% for MBB etc.
-
That’s pretty awesome man. If I dedicated myself 100% to financial gain I don’t think I’d be anywhere near $10m let alone $100m. Would that be mostly through investing in public securities?
-
Not looking too promising for oil investors.
-
I think it’s useful to consider potential production capacity, because if oil ever hits $200 a barrel, every political leader will be doing everything possible to increase global output. While current productive capacity versus current demand drives today’s price, the presence of untapped potential — for example, in countries like Venezuela — limits how long prices can remain elevated.
-
Yeah, if this is true then there’s plenty out there.
-
Thoughts on Venezuela? That’s the real spare capacity right?
-
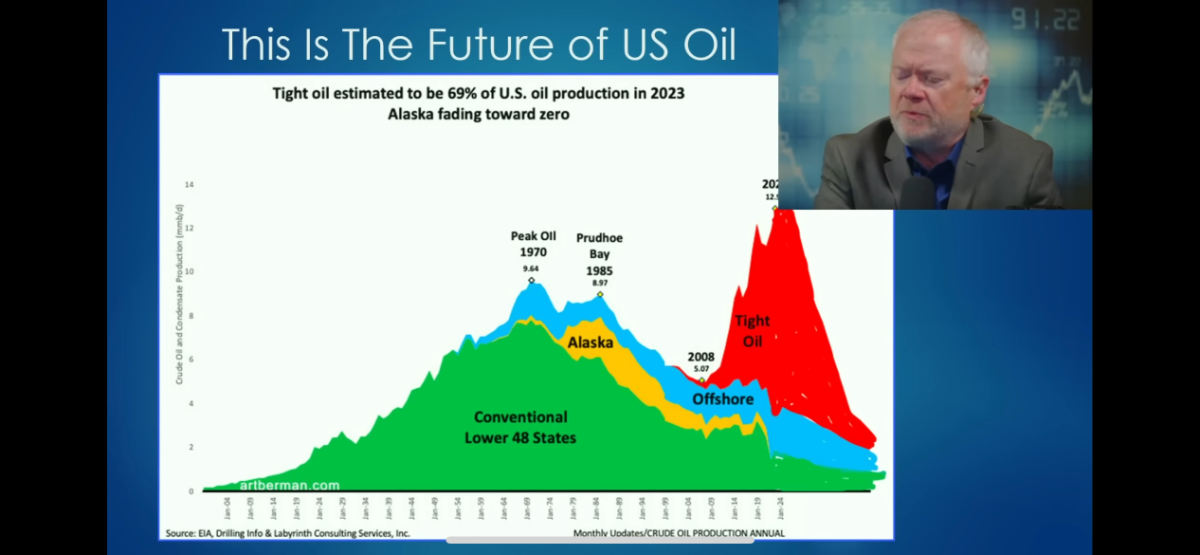
I get the exhaustion from hearing ‘peak shale’ for the last decade but… When US shale isn’t adding +1M bpd but instead declining by 1M bpd…. That’s a huge deal right?
-
Picture below from a recent Adam Rozencwajg YouTube video. Conventional + Alaska + offshore in green/yellow/blue. Shale oil in red. The decline in shale obviously hasn’t happened yet (he’s projecting forward). No comment on the timing of shale’s decline (could be soon, could be many years from now), but gee what happens if that decline curve is even remotely accurate.
-
Well said. +1