


treasurehunt
-
Posts
332 -
Joined
-
Last visited
-
Days Won
1
Content Type
Profiles
Forums
Events
Posts posted by treasurehunt
-
-
3 hours ago, MMM20 said:
Investments
~$40B cash+fixed income @ ~5-6% yield
~$20B equities @ ~8-9% total return
= ~$4-4.5B return on assets
Financed in part by
~$30B float @ ~2-3% net margin (~97-98% combined) = negative $600-900mm
~$10B in debt+prefs @ 7-8% = ~$700-800mm
= ~zero net financing cost
minus opex and taxes
~$3B net income
vs ~$20B equity
= ~15% ROE
I think this is roughly correct, although you are ignoring non-controlling interests. Non-controlling interests run around 10% of pre-tax income, I believe.
But this is just for the first year, right? If Fairfax continues to trade at book, they can theoretically use all $3B in earnings to buy back shares and continue to generate a 15% ROE. But if Fairfax trades at a premium to book, it becomes more difficult to generate 15% year after year. For example, let's say Fairfax retains all $3B in net income so that equity is now $23B. With the same rate of return on investments and the same combined ratio, investments and float have to go up a lot - by around 15% each - to still generate a 15% ROE. How long can this be sustained if Fairfax trades consistently at a significant premium to book? Not very long, I suspect.
-
29 minutes ago, Viking said:
Below is an update to a previous post I did on the TRS-FFH position. In the last couple of days, the position passed the $1 billion mark in gains. I still have a hard time wrapping my head around this investment. It is a mind bender. And a fantastic investment. Could its best days still be ahead?
Viking, thanks for a great recap of the TRS investment. Given that FFH looks undervalued still, the TRS should provide value for a while. Do you know the mechanics of how the TRS works exactly? Is it settled in cash quarterly? I was wondering if it is possible that FFH may have to come up with a bunch of cash if the stock price goes down a lot for some reason. I'm sure management has considered any such possibility, so this is more curiosity than anything else.
I have a vague recollection that this may have been discussed already, but a quick search of the site did not yield anything.
-
5 hours ago, sleepydragon said:
If you are looking for screaming bargains, I have bought Baba at 85 and 120 (down from 200ish) and Porsche (which I have sold) at 70% “NAV”.. not doing too well on those !
Berkshire is almost 25% of my portfolio and I have concluded that my foray into BABA was a mistake, so I am not fixated on screaming bargains. Just pointing out that Berkshire doesn't look particularly cheap. I won't be buying any at the current price, but I have no plans to sell any either.
-
After tax operating earnings are at a $40 billion annual run rate roughly. Add to that about $14 billion in normalized after-tax capital gains from the equity portfolio (6% pre-tax gains on $310 billion and a 25% tax rate). That's $54 billion of total earnings on a normalized basis. At a current market cap of $760 billion, Berkshire is trading at a P/E of 14 or so. Seems fairly cheap and a better value than the S&P 500, but the stock is no screaming bargain. I'm not adding any value for the optionality of holding a lot of cash, as cash is earning 5% right now.
-
@Viking, @UK and @Vinod1, thanks for your comments. They add some very useful context to how I was thinking about Evan Greenberg's comments. It makes sense that most insurers wouldn't benefit nearly as much from higher rates as Fairfax would.
-
16 hours ago, Viking said:
And by the way, if you do the math and you translate the higher yields to what it means to earn the same return, what combined ratio affect you would get to achieve the same return, it's modest in combined ratio relatively, 1 point here, 1 point there. It’s not like, wow, I can raise my combined ratio by 5 points to achieve the same 15%, as an example, risk-adjusted return. No, you can't, and we run the math.
I don't understand this comment by Evan Greenberg. If investment yields have gone up a lot (say by 3 or 4 percentage points), then it should be possible to raise the combined ratio by a lot more than 1 point and achieve the same risk-adjusted return, no? I realize that this depends on the size of the investment portfolio relative to earned premiums, but the math for Fairfax indicates that the CR can go up a lot and they can still earn a good risk-adjusted return. Is it different for most other insurance companies?
-
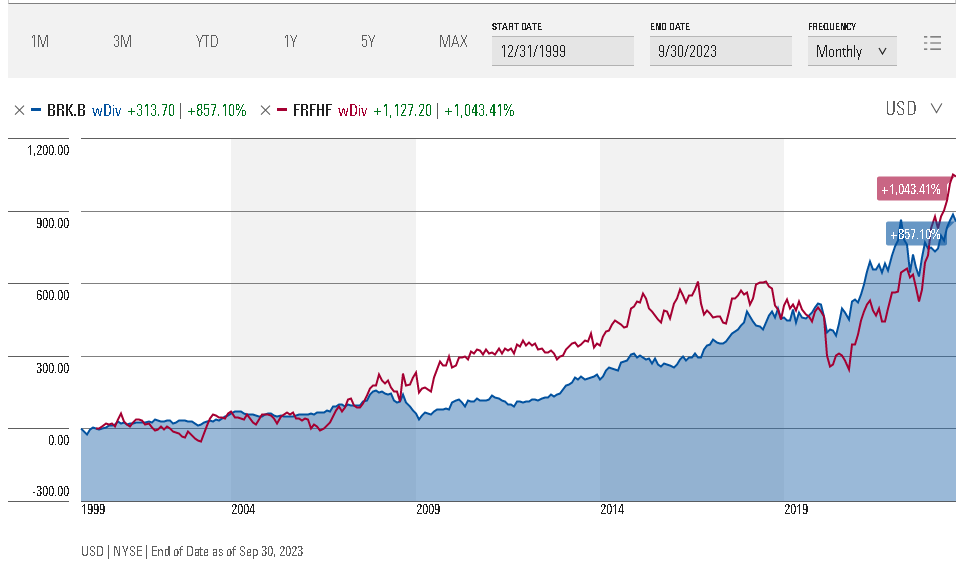
15 hours ago, Haryana said:
Berkshire vs Fairfax, Millennium Till Month

Morningstar's data for Fairfax does not look correct here, probably because there was no FRFHF ticker back in 1999. Here's the same chart for FFH.TO - in USD and with dividends reinvested - for the same period. The total return is quite a bit lower.

-
2 hours ago, Munger_Disciple said:
Happy Birthday Warren! We will raise toast with what else, Cherry Coke. May you live well past 100!
I bought my first share in Berkshire 21+ years ago.I bought my first shares over 23 years ago (Feb 2000). I remember that Warren's longevity was a concern even back then, but he has easily outperformed actuarial expectations since!
-
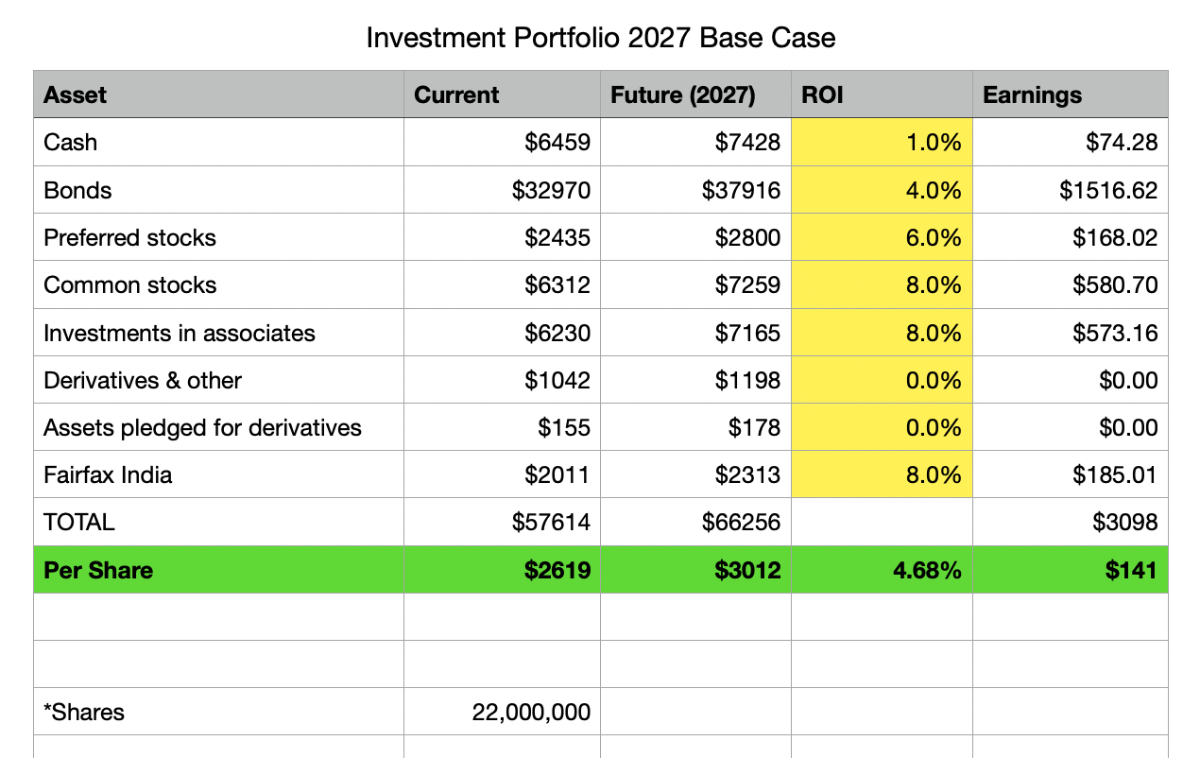
16 minutes ago, Haryana said:
Not Thrifty3000 here but let me take a shot at it for now and see if that hits or makes any sense to you or anyone present -
Apparently that table is talking about only the investment portfolio. The expenses you mentioned are reasonably projected to be more than well covered by their underwriting operations and still have profits left over to be added on the bottom line. Income taxes would be significant but still the normalized earnings are surprisingly quite high with conservative assumption.
Fair enough. Thrifty3000 mentioned $10 to $50 in underwriting profits. I took the midpoint and added $30 to his base investment case to get about $170 in investment returns + underwriting profits. I think this will get whittled down to $100 after all expenses and taxes.
But it may be that the investment base case and/or the underwriting profit estimate are on the conservative side.
-
8 hours ago, Thrifty3000 said:
Now, if we fast forward to 2027, and project a scenario where the hard market has cooled and short term interest rates have moderated, we could easily be looking at something more like this (I simply increased each asset class by a total of 15% to account for 3 years of conservative growth, and I reduced the share count a bit)...
4 years from now, after the cliff of locked in near term interest rates has past us by, the portfolio will still be able to produce $140+ per share without needing to do anything spectacular from an investment standpoint!
You can add, say, $10 to $50 per share for insurance underwriting profits and we really are looking at the normalized 20% returns @Viking has been proclaiming. And, again, the all star investment team barely has to show up to work to produce the kinds of returns I'm forecasting. These estimates are probably too conservative.
Nice analysis. Thanks.
To calculate the final return to common shareholders, however, shouldn't you deduct interest expenses, corporate overhead, income taxes and non-controlling interests? After all that, your base case looks more like $100 EPS attributable to common.
-
2 hours ago, ValueMaven said:
@treasurehunt big issue there has been GEICO - so not really comparing apples to apples imho
It's true that the comparison is not apples to apples, but GEICO by itself does not explain the difference. 2022 was the only bad year for GEICO with an underwriting loss of -$1.9 billion. In the four years prior, GEICO's underwriting profit totaled over $8.6 billion, or almost $2.2 billion per year.
-
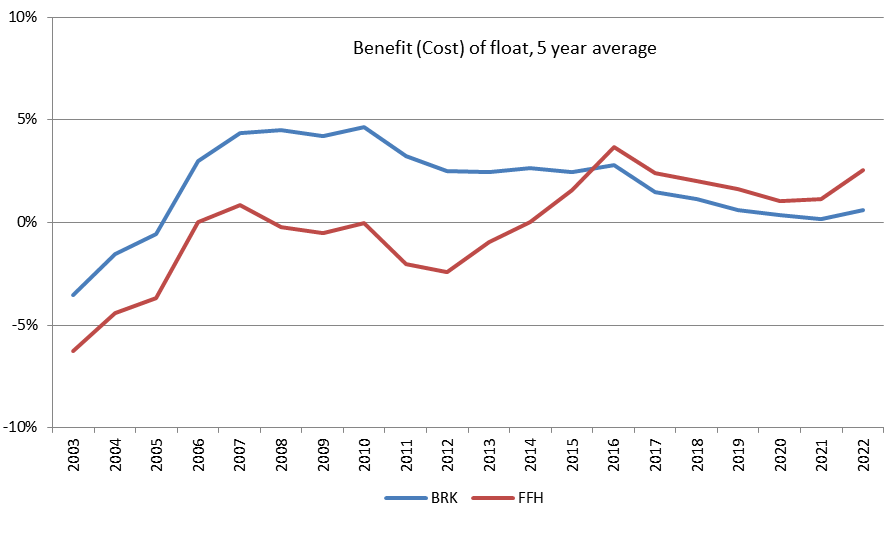
16 hours ago, UK said:
Not sure if I did it without mistakes, but it is quite interesting if you compare this data of FFH with BRK!
ffh brk float.pdf 124.81 kB · 9 downloads ffh brk float.xlsx 37.75 kB · 3 downloads
Nice work! I checked the BRK data for the past ten years and your chart looks correct. Even accounting for differences in the lines of business, I am surprised that Fairfax's underwriting has been noticeably better than Berkshire's in recent years. I mean, Buffett is very proud of the quality of Berkshire's insurance business, but Fairfax has had better underwriting results for the last six years or so. Very impressive.
-
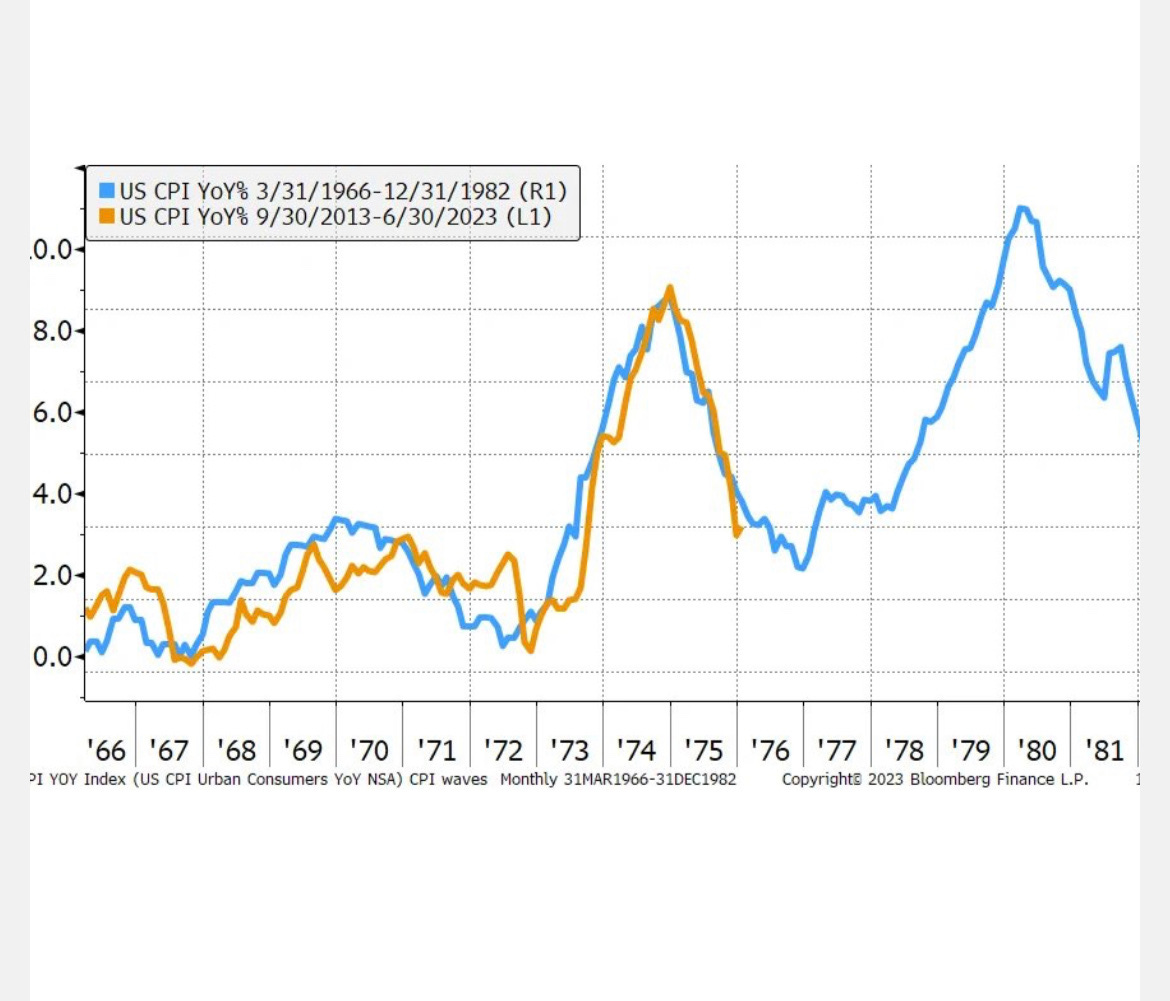
17 hours ago, james22 said:
Data from FRED does not match up with this chart. Any thoughts on why there is a discrepancy?
https://fred.stlouisfed.org/series/CPALTT01USQ659N
-
Does anyone know when Fairfax is scheduled to release Q2 results? I thought today might be the day, but there doesn't seem to be any notification regarding this. So maybe the earnings release is scheduled for Thursday of next week?
-
On 7/20/2023 at 9:15 AM, Spekulatius said:
Sold a bit of USB to reduce my exposure.
I'm curious about this sale as I have some USB in my portfolio and consider it quite undervalued still. Were you just getting your exposure down to a reasonable level or were there other reasons? My main concern with USB is that they may have to increase capital levels quite a bit over the next couple of years, but they showed with their Q2 results that they can build capital rapidly if needed.
-
58 minutes ago, Munger_Disciple said:
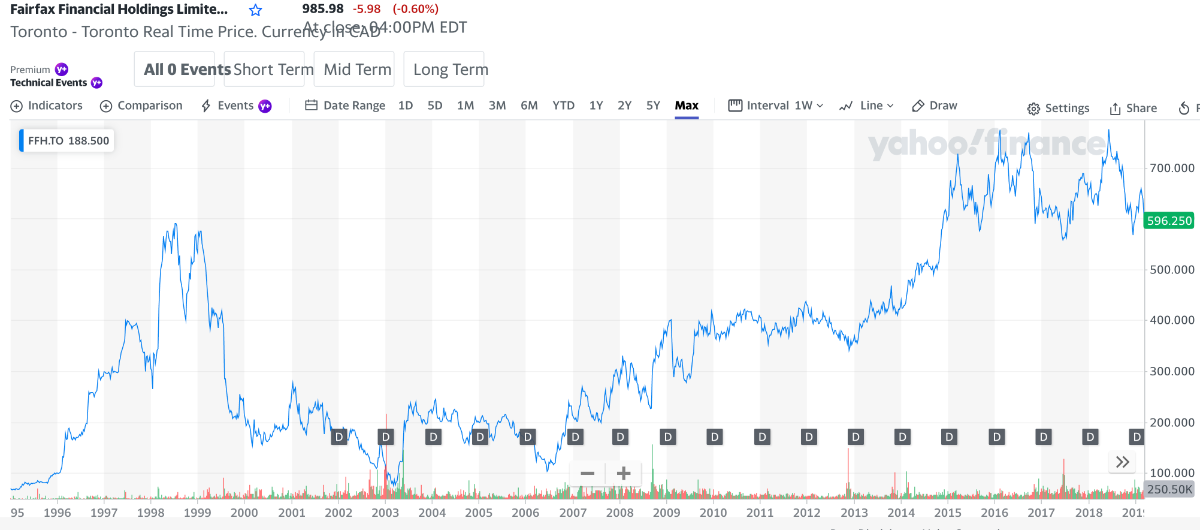
In the case of Fairfax, the CAGR seems to a very strong function of the start date of one's investment even in the very long term. If you zoom out a bit further, the chart looks like this in CAD (it hit a local peak of $540 CAD in 1998). If one invested in Fairfax on 1/1/1999 and kept it until 6/30/2023 for example, the CAGR after 24.5 years is only 4.54%. On the other hand, if you invested in FFH on 1/1/2003 and kept it till 6/30/23, CAGR jumps to 13.4% over the 20.5 year period.
Yes, the stock price has historically been very volatile. Perhaps it is better to look at changes in book value per share (plus dividends) to get a better idea of how the business has been doing over time.
-
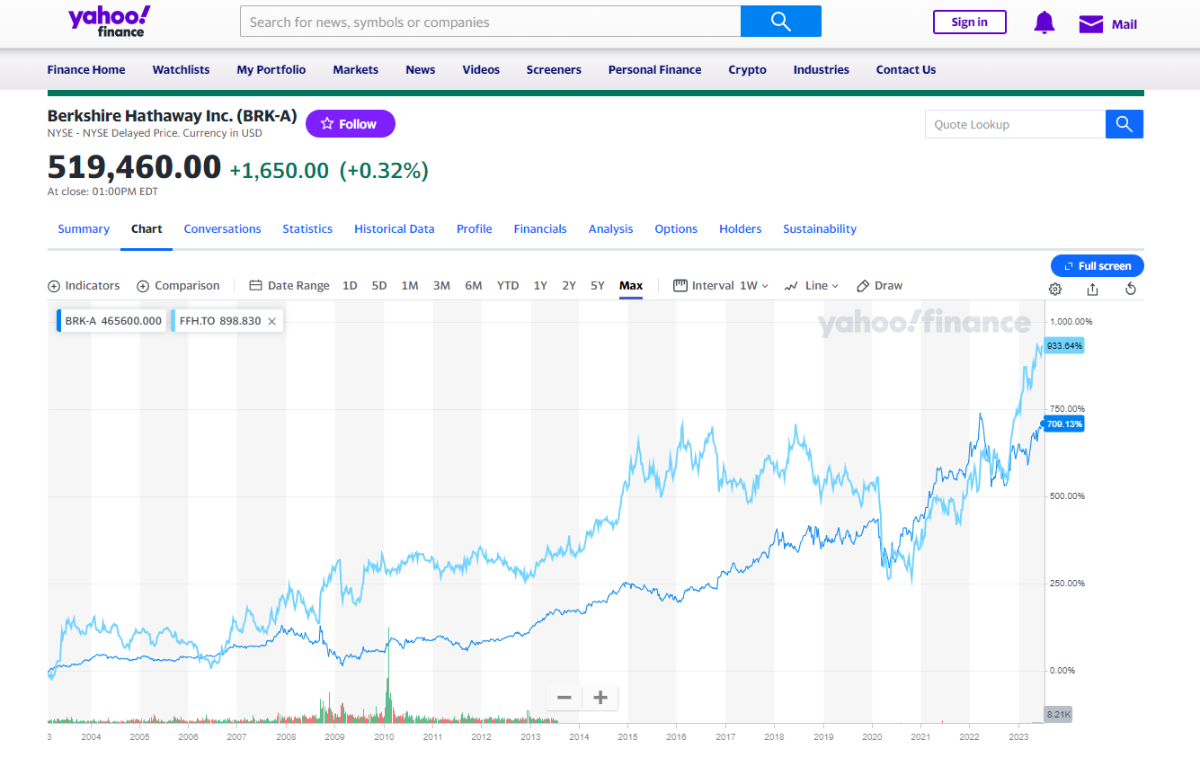
20 minutes ago, Parsad said:
I thought it was wrong too! But take a look on Yahoo Finance as well...without dividends...last 20 years ending around May 2023.
I think FFH critics about performance relative to BRK may have to do a double-take...FFH's returns are now comparable to BRK over the last 20 years and probably will continue to surpass them in the next 20 years simply due to size! Cheers!
Not sure what's going on with the yahoo charts, but they don't match up with yahoo's own historical price data. FFH.TO closed at 200.50 CAD on July 3, 2003. Thus the price return over the past 20 years is about +395% in CAD. The USD-CAD exchange rate was almost exactly the same 20 years ago as it is today, so that doesn't make a difference either. Maybe the chart has a starting date of March 2003; FFH.TO traded at below 80 CAD then according to yahoo's historical data.
-
17 hours ago, Haryana said:
Despite the so called lost decade and current undervaluation, Fairfax seem to outperform Berkshire so far this millennium.
What is the source for this chart? It doesn't look right to me.
BRK.A closed at $56,100 on 12/31/1999 and at $519,460 today. That's a return of +826%.
FFH.TO closed at $245.50 CAD on 12/31/1999 and at $992.29 CAD today. Ignoring dividends, that's a return of +304% in CAD. The return in USD is close to +350%. I don't think Fairfax has paid enough dividends to bring the total return in USD anywhere close to +826%, let alone exceed it.
-
The 13F-HR for Q1 is out.
https://www.sec.gov/Archives/edgar/data/1067983/000095012323005270/0000950123-23-005270-index.htm
Here are some changes that I noticed - added to OXY; reduced ATVI, CVX and GM; sold out of USB and BK but retained position in Citi.
-
6 hours ago, CorpRaider said:
Can I just say that I don't follow this "two clicks to a bank run = new world" stuff? Even from the big guy. Bank of Internet USA was founded in the year 2000.
I guess he was saying that online banking is much more common now than even a few years back. Here's a relevant excerpt from the recently published Financial Stability Report from the Fed. You can find the complete report at https://www.federalreserve.gov/publications/financial-stability-report.htm.
"The runs on SVB and Signature Bank were of unprecedented speed compared with previous runs. During the run on Washington Mutual in 2008—to date, the run that caused the largest failure of an insured depository institution by inflation-adjusted total assets—depositors withdrew about $17 billion over the course of eight business days, with the largest deposit withdrawal in one day reaching just over 2 percent of pre-run deposits. By comparison, the highest one-day withdrawal rate was more than 20 percent in the case of SVB and Signature Bank, at the time the second- and third-largest depository institutions by inflation-adjusted total assets, respectively, that failed due to a bank run (figure B). At SVB, withdrawals would have been even larger had regulators not closed the bank on the morning of March 10."
-
6 hours ago, Spekulatius said:
FHN looks like a decent bank. At sub $8, I am a buyer. I don't think there is anything inherently wrong with it.
My $USB is getting wrecked here.
Yeah, USB is taking it on the chin.
One bit of good news is that two directors have bought shares recently. Scott Wine bought 30K at $32.85 per share; Alan Colberg bought 10K at $34.14 apiece.
-
Bought some more USB
-
On 4/19/2023 at 8:53 AM, crs223 said:
I believe you are saying "because good drivers are moving to Progressive, therefore GEICO is mis-pricing their product".
I could charge $1 for unlimited auto coverage. GEICO would lose all customers to me -- doesn't mean that GEICO is mis-pricing.
Q: What evidence do we have that Progressive is right and GEICO is wrong?
I'm not saying that GEICO is correct -- I have no idea -- I'm just trying to understand how the forum concluded that GEICO is mis-pricing their product.
I guess the evidence is that PGR had a combined ratio of 96% for 2022, while GEICO had a combined ratio of 104.8%. Since auto insurance is mostly a short-tail business, the combined ratio is probably a good indication of underwriting quality.
PGR's combined ratio did rise to 99% in Q1 2023 though.
-
On 2/8/2023 at 2:27 PM, Viking said:
Below is an interesting presentation regarding the energy transition. I am starting to wonder if ‘energy transition’ is not similar to the US housing bubble around 2005 or 2006. In terms of how completely wrong/unrealistic the dominant narrative is/was. And as reality sets in both will have/had enormous impacts on the global economy.
The housing bubble bursting almost took down the global economy in 2008. The ‘energy transition’ is going to result in prices for metals/energy to spike to unheard of levels and that will have an equally enormous impact on the global economy.
The energy transition (as its currently constructed) looks to me like a slow motion train wreck. Using basic logic, it is pretty much an impossibility when you look out just 2 or 3 years. What should an investor do?
1.) buy oil stocks. Oil is going to be needed in INCREASING quantities for decades. But we are massively underinvesting in it. The ‘energy transition’ is going to happen much slower than people currently think (due to shortages of raw materials).
2.) buy metal stocks. Prices are going higher than people can imagine. Bringing new metal supply on stream is even more difficult than oil (takes 5-7 years). The ‘energy transition’ is going to be much, much more expensive that people currently think.
3.) elevated inflation will be the new norm (with lots of volatility). Unheard of prices for metals and oil will drive global inflation.4.) geopolitical strife will increase. China has enormous leverage, especially in processing of metals. At some point they will play that card.
Bottom line, the world over the next 10 years will be very different than the world of the past 20 or 30 years. Not worse. But very different.
—————Humanity is going to continue to invent. Machines need to eat too…
—————
If anyone comes across a video/presentation that provides a counter argument (to the thesis Mark lays out in his video below) please attach it. I remain inquisitive and open minded

I agree with you that the energy transition will be a slow affair and that it makes sense to be bullish on oil. I am not so sure about metal prices going higher than people can imagine; maybe lithium, but I have a hard time seeing any other metal being in extreme undersupply. I think Mark Mills overstates the case for minerals.
Here's the Economist on Cobalt (might be behind paywall): https://www.economist.com/finance-and-economics/2023/02/16/cobalt-a-crucial-battery-material-is-suddenly-superabundant
Even the case for extreme shortages in lithium depends on sodium ion batteries taking a long time to ramp up, I feel. CATL is planning to start mass production of sodium ion this year, so this is not a slam dunk.
https://www.nextbigfuture.com/2022/10/catl-will-mass-produce-sodium-ion-batteries-in-2023.html


Fairfax stock positions
in Fairfax Financial
Posted
Fairfax acquires another 2.5 million shares of Orla Mining.
https://www.fairfax.ca/press-releases/fairfax-announces-acquisition-of-additional-orla-shares-2023-12-11/