jschembs
-
Posts
437 -
Joined
-
Last visited
Content Type
Profiles
Forums
Events
Everything posted by jschembs
-
There are two extensions not related to Graham-esque Margin of Safety IMO 1) Highly predictable FCF businesses - higher margin of safety 2) Businesses with capital allocators able and willing to invest to reinvent / rebuild for future value - higher margin of safety Both present very interesting opportunities, but IMO also a very different way to evaluate businesses.
-
Interesting discussion, but what I struggle with is the whole idea of margin of safety when not applied to its original concept. They try to take a concept that was largely based on tangible assets (what is known and measurable) and try to apply to an unknown future.
-
Agree with this. The story started with growth vs value, then spent the rest of the article talking about how increasingly difficult it is for value to generate excess returns, which doesn't have anything to do with absolute returns of growth vs value. Just spitballing here, but it'd be interesting to see how growth vs value under/outperformance overlaid with rate cycles. As rates have declined since the early 80s, future growth becomes increasingly valuable (and of course more sensitive to changes in assumptions).
-
Can't say I understand the RH purchase. CEO touting a new business model with magical 50+% ROIC for a furniture retailer, while borrowing heavily to repurchase shares and battling short sellers.
-
Negative interest rates take investors into surreal territory
jschembs replied to Viking's topic in General Discussion
Considering what happens on the other side of this is one of the scariest parts of the rate conundrum. WSJ articles will start referencing convexity a lot more frequently. -
But the last seven months of buying after Powell's December commentary signaling future cuts was all rational?
-
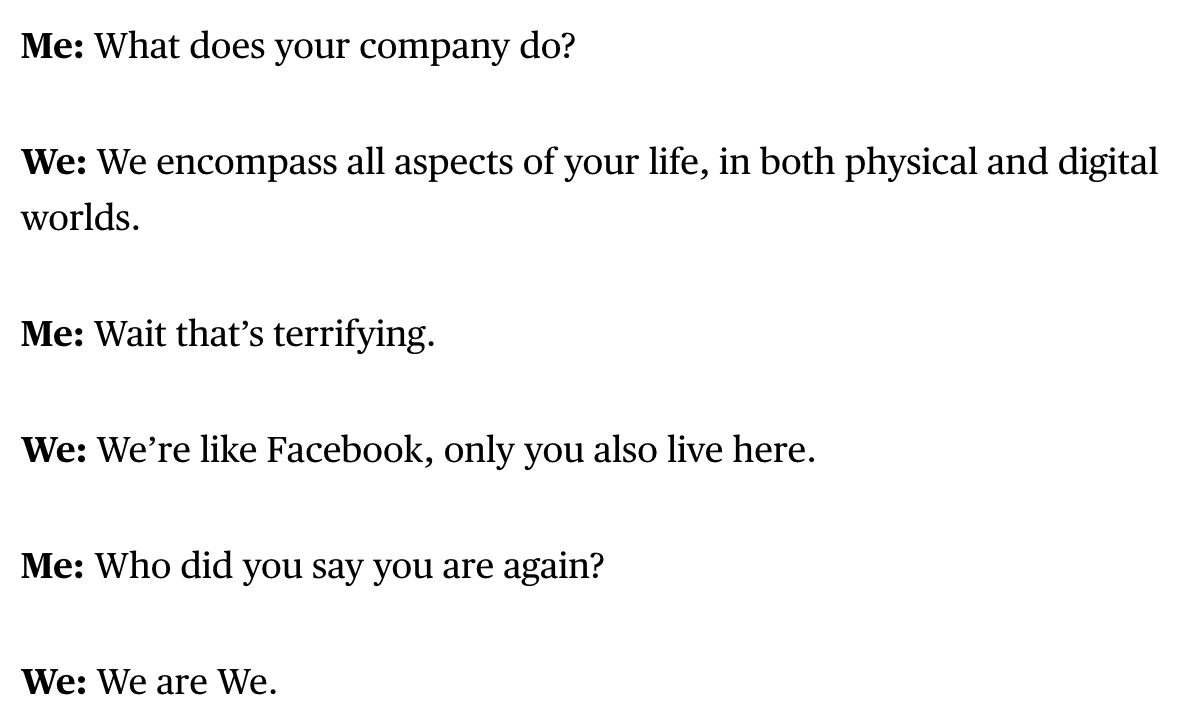
Love Matt Levine

-
What a great story, thanks!
-
This kind of napkin math misses a lot. What are the assets that they bought? Do they have different economic characteristics than what they used to own? Suppose it depends on whether or not you include intangibles and goodwill in your ROIC calcs...yes they've bought more software/higher ROIC assets, but that's still $11 bn in cash out the door...what would the FCF CAGR have been without those acquisitions over the last decade? Is 8.5x revenue a reasonable price to pay?
-
I believe the increased valuation in some stocks is due to the rush into compounders. I believe after one of the longest economic expansion in modern history, a lot of companies look like compounders, but are more cyclical than they seem. We will see after the next recession. Since many of them are roll ups (albeit well run roll ups), there is also reflexivity at work, such that a high valuation enables faster growth through acquisitions, due to lower cost of capital. Example are Heiko, ROP, DHR, TDG, ROK. They are well managed companies well worth keeping an eye on, but the valuation is a couple of bridges too far, since investors now discount many years of current growth rates into their stock prices. I'd agree with that. As an example, ROP has spent $11 bn on acquisitions in the last ~9 years to grow FCF from $471 mm in 2010 to $1.3 bn today. Meanwhile, EV/rev has more than doubled (~8.5 now from ~3.5x in 2010) and EV/FCF has nearly doubled (upper teens in 2010 to low 30s today).
-
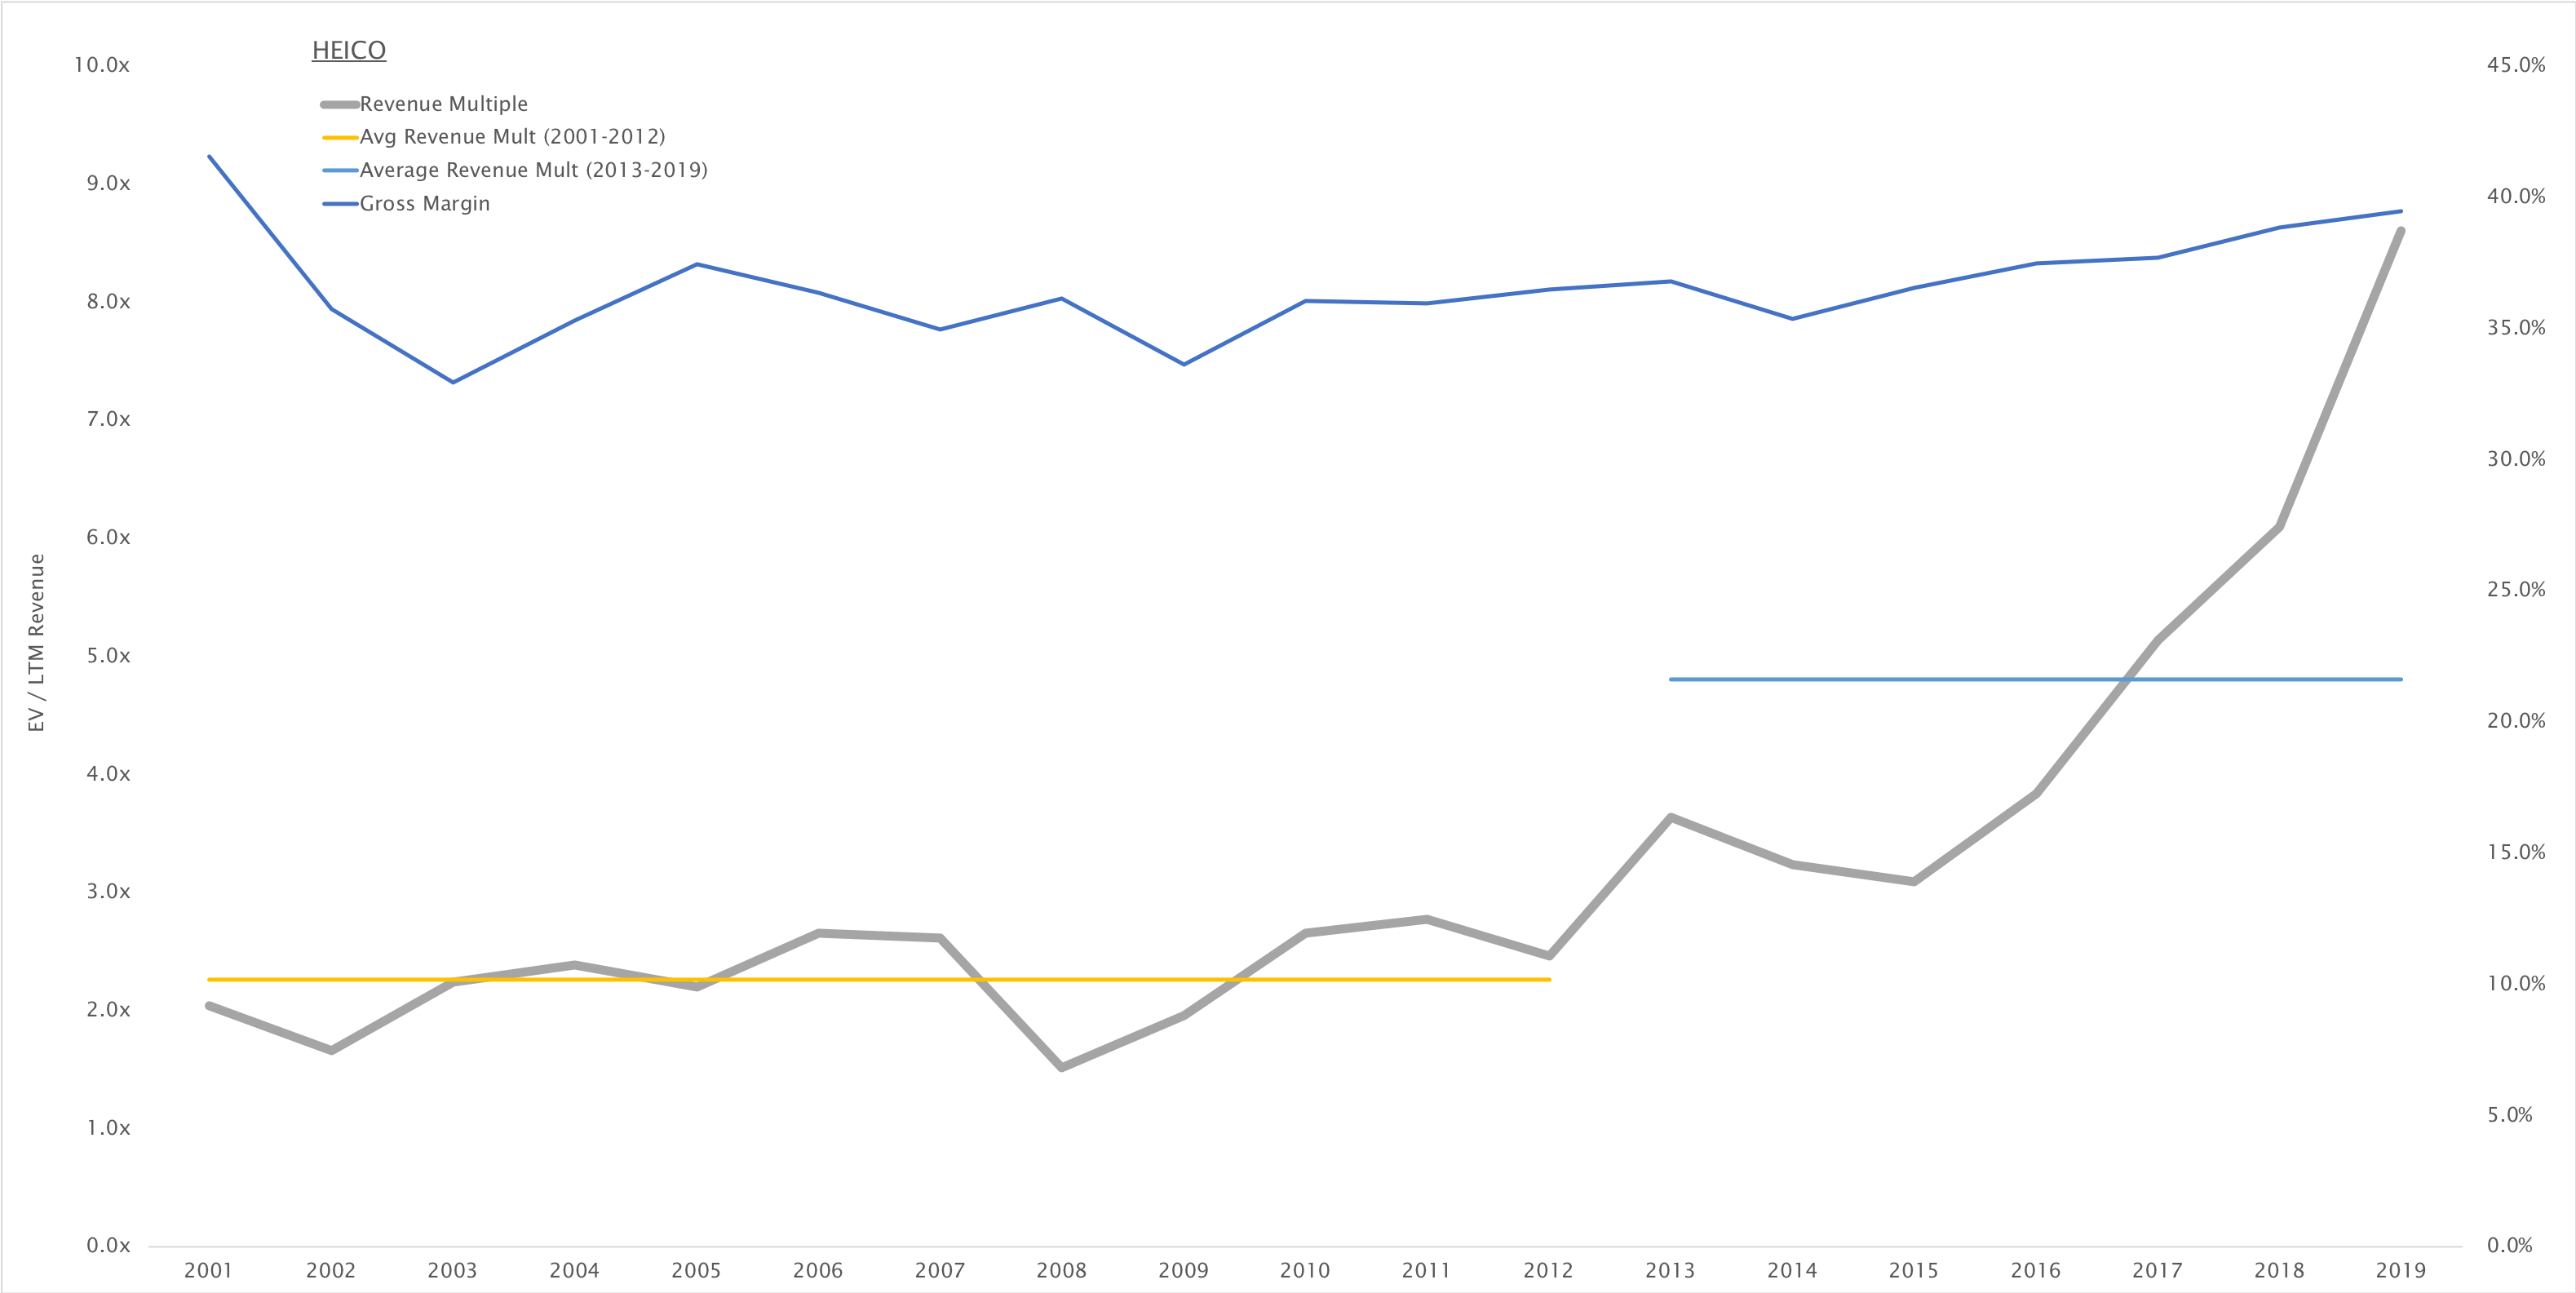
Great find. What I find interesting is comparing those EV/revenue numbers (which curiously are 2012 estimates, as he writes the post in May 2011) to today's market. I looked at some of today's highly-valued (EV/rev) R1K names, and was surprised to see Heico at 8x revenue! Gross margins have hovered around 35-40% over the last 15+ years, revenue growth has averaged 13% annually ($171 mm in 2001 to $1.9 bn today, boosted via $2 bn cash spent on acquisitions). Quite the ramp in EV/revenue over the last six years. Not sure what's different about the business over that time. EBITA margins are a bit higher in recent years, but they're 25% today vs 23% in 2001. The market historically valued the business at 2-3x revenue, now 8.6x. Not meaning to pick on Heico in particular, just a name that jumped out at me that seems hard to justify valuing at nearly 10x revenue (plus, the 10 year today is roughly where it was in 2011-2012)...
-
What I find interesting is that for a subject heading of "1999 again," the discussion has almost exclusively focused on valuations. The late 90s were certainly a time of euphoria in the capital markets, which gave plenty of startup enterprises a long leash of funding that otherwise wouldn't have existed. With that leash came jobs, office leases, computer equipment, consultants, etc. I see plenty of parallels today. While we can argue whether or not a "pets.com" exists today, there are plenty of very questionable business models being funded, which, whenever the cycle turns (and it will), results in shuttered businesses, lost jobs, unpaid leases, and plenty of excess capital spending. Even for the well-regarded business models, as growth slows and the market begins to demand profits, opex cuts will be the first place to look. The double-edged sword of high margin SAAS companies is that operating leverage cuts both ways. I know I'm jaded from having graduated college around the time of the dot com bubble, and I acknowledge we're nowhere near that time, but I am honestly surprised to see little to no consideration of how these factors may play into the current cycle.
-
Quite the tome from Mr. Livermore, thank you. Interesting that for all of that work, he ends up with a measure that largely tracks CAPE (which seems to be discarded as a useless metric by the new guard).
-
I'm more so talking about nearing inflection points in earnings where forward multiples become far less predictive.
-
I'd certainly agree the S&P is not nearly as frothy as the R2K or R3K. And of course, use of forward earnings this late in a cycle should be taken with a grain of salt. Look at forward earnings in mid-2007 through 2008. https://www.yardeni.com/pub/sp500trailpe.pdf
-
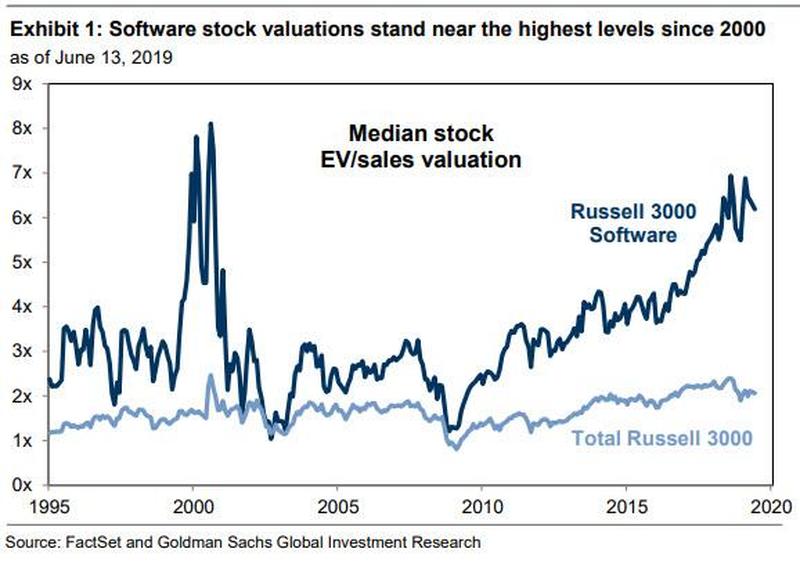
I'd love to see the underlying data. Even when you exclude industries like REITs, financials, and O&G E&P companies, whose cash flow statements are not comparable to other operating companies, you still have data integrity problems. I pulled the Russell 1000 data from CapIQ. Excluding the above industries, the average / median P/FCF is 30x / 21x (25x / 22x if excluding SBC). The valuations go down when excluding SBC because of the numerous FCF negative companies, where deducting SBC makes their valuations less negative. If you exclude negative FCF companies, average / median P/FCF is 48x / 22x (46x / 24x excluding SBC - 46x is lower than 48x because a number of companies have positive FCF, but negative if deducting SBC). Remember, these valuations EXCLUDE the highly valued growth stocks like TWLO (24x revenue, negative FCF) and NFLX (9.5x revenue, negative FCF). Those are the ones most susceptible to the 50+% declines. It's always hard to compare valuations over time, particularly when accounting rules change (no longer amortizing goodwill, now expensing SBC). Here's the data. I also excluded a few names that recently reported earnings where CapIQ hadn't updated their LTM financials, but the impact is insignificant. More food for thought - given the prevalence of negative earnings / FCF constituents, EV/sales perhaps more enlightening? At least you can include more of the constituents in the data set.
-
I'd love to see the underlying data. Even when you exclude industries like REITs, financials, and O&G E&P companies, whose cash flow statements are not comparable to other operating companies, you still have data integrity problems. I pulled the Russell 1000 data from CapIQ. Excluding the above industries, the average / median P/FCF is 30x / 21x (25x / 22x if excluding SBC). The valuations go down when excluding SBC because of the numerous FCF negative companies, where deducting SBC makes their valuations less negative. If you exclude negative FCF companies, average / median P/FCF is 48x / 22x (46x / 24x excluding SBC - 46x is lower than 48x because a number of companies have positive FCF, but negative if deducting SBC). Remember, these valuations EXCLUDE the highly valued growth stocks like TWLO (24x revenue, negative FCF) and NFLX (9.5x revenue, negative FCF). Those are the ones most susceptible to the 50+% declines. It's always hard to compare valuations over time, particularly when accounting rules change (no longer amortizing goodwill, now expensing SBC). Here's the data. I also excluded a few names that recently reported earnings where CapIQ hadn't updated their LTM financials, but the impact is insignificant. R1K_Data.xls
-
I'd love to see the underlying data. Even when you exclude industries like REITs, financials, and O&G E&P companies, whose cash flow statements are not comparable to other operating companies, you still have data integrity problems. I pulled the Russell 1000 data from CapIQ. Excluding the above industries, the average / median P/FCF is 30x / 21x (25x / 22x if excluding SBC). The valuations go down when excluding SBC because of the numerous FCF negative companies, where deducting SBC makes their valuations less negative. If you exclude negative FCF companies, average / median P/FCF is 48x / 22x (46x / 24x excluding SBC - 46x is lower than 48x because a number of companies have positive FCF, but negative if deducting SBC). Remember, these valuations EXCLUDE the highly valued growth stocks like TWLO (24x revenue, negative FCF) and NFLX (9.5x revenue, negative FCF). Those are the ones most susceptible to the 50+% declines. It's always hard to compare valuations over time, particularly when accounting rules change (no longer amortizing goodwill, now expensing SBC).
-
Wanted to introduce a new idea. Early-stage compounder with a great jockey story. Has had some issues with racism, but seems to have put those behind him. Company working on a robust rubber bladder system to mitigate oil spills. Still in early urban testing, largely from residential rooftops. Downside is lack of people resources - struggling to retain top intern talent.
-
Thanks a lot for the explanation. How about the actual numbers? For example, for the declining business, would you increase the taxes in the next couple of years if you think the DTLs will decline and you will have to pay higher cash taxes? Exactly.
-
I don't think that's a dumb question at all. It really depends on whether or not you think the company will continue to operate in a manner that created the DTL. For example, a growing manufacturing enterprise will likely continue to grow its DTL as it depreciates a growing asset base more rapidly for tax purposes than book purposes. Obviously Buffett believes his DTL, largely due to unrecognized capital gains, will continue as he holds those positions and they grow in value over time. In these situations, the DTLs should probably be treated more like equity. On the other hand, if you've got a business in decline with large DTLs, those should probably be treated more like debt.
-
What's behind the question? That's tricky, because as we know, value means a lot of different things to different people. If you're talking "deep value" (i.e. cheap assets), Sun, Platinum, Gores, etc are all well known in that space. If you're talking about trying to buy good businesses at reasonable values, that's much more difficult to pin down. A lot of that depends on a PE's ability to directly source deals, because you're highly unlikely to get a reasonable price in an auction. Endeavour Capital based out of Portland is a good example of a firm that tends to source most of their deals themselves, and as such tends to get a better deal (lower price), although of course that doesn't necessarily mean it'll turn out well.
-
Typically valued based on book value.
-
CNBC is such horseshit. I've been fairly bearish the last year, but that felt like some real panic selling yesterday. By far the largest volume on SPY.
-
That's another interesting question, but my main interest was gauging what cycles most folks have been through. I interned on the PHLX option exchange floor in 2000, so I very vaguely remember the dot com euphoria, but I wasn't really investing my own money until the mid-2000s. 2007 felt nothing like what I remember 2000 was like, which is why I don't think folks can say today whether or not a top is forming just because it isn't as euphoric as 2000.