thepupil
-
Posts
5,006 -
Joined
-
Days Won
6
Content Type
Profiles
Forums
Events
Everything posted by thepupil
-
Where is Jay Powell, is he dead or alive?
thepupil replied to RuleNumberOne's topic in General Discussion
He lives in Chevy Chase Village, about 1.5 miles from my house. You want me to go check on him? His wife is quite involved in the community; she has had to resolve many an important dispute. https://www.washingtonpost.com/local/no-excessive-barking-a-chevy-chase-dog-park-divides-the-rich-and-powerful/2019/08/27/0b9fd242-c4e5-11e9-9986-1fb3e4397be4_story.html My dog and I are going to miss that park. -
I agree with you in that it's a good metric and agree that it is helpful to contextualize valuations. I would temper anyone using it as "bullish" evidence with that it is covered by earnings, but only barely. I would temper anyone using it as "bearish" with the other stuff I've posted about a lack of leverage in the S&P 500 and that large corporations are not taking an undue amount of leverage to buy back stock. I've posted a bunch of that stuff in the "wilshire 5000 market cap to GDP thread. CSX's debt to EBITDA has been between 2.0 and 2.6 for the last decade. It is at the higher end of the range. Should we be bearish because CSX is now 2.6x levered? In my view, considering they just raised 10 year and 30 year money at t+97 and t+145 (2.4% and 3.4%, pretax), we should be okay with them raising that money. https://www.bamsec.com/filing/119312519236655?cik=277948 https://www.gurufocus.com/term/debt2ebitda/NAS:CSX/Debt-to-EBITDA/CSX-Corp
-
https://www.yardeni.com/pub/buybackdiv.pdf Buybacks + dividends are just below 100% of operating earnings for S&P 500, which is about the most it’s been excepting brief period in 2015/16 and in the crisis when earnings collapsed. Cash yield is about the same as earnings yield; stocks aren’t in bottom quartile valuation; corporations are just paying out more than normal.
-
Wilshire 5000 market cap / GDP exceeds dot-com peak
thepupil replied to RuleNumberOne's topic in General Discussion
https://www.gurufocus.com/global-market-valuation.php?country=JPN Also, what’s your data source? I think JApan Market cap to GDP got to over 300% according to the link. -
Wilshire 5000 market cap / GDP exceeds dot-com peak
thepupil replied to RuleNumberOne's topic in General Discussion
Yes but if you are comparing Japan to US market cap to GDP that normalizes sales / margins between the countries. Given the differences in culture and company composition, this would be very mistaken, in my opinion. Why does the US have higher market cap to GDP than Japan bubble time but somewhere between 1/4 and 1/6 the PE ratio? Huge difference in earnings an margins. I think US corporates are over earning but to make the comparison between US and Japan is to say they are overearning to an extreme degree. I think the comparison has little relevance or analytical merit. -
Wilshire 5000 market cap / GDP exceeds dot-com peak
thepupil replied to RuleNumberOne's topic in General Discussion
Large cap Japan was at 120x CAPE ratio and while market was at 70-80x PE; to compare the US stock market of today to 1989 Japan is to believe that company earnings will decline by some 60-75% via an extreme combo of margin compression/ sales decline to get to similar valuations as then. http://siblisresearch.com/data/japan-shiller-pe-cape/ -
I manage my parents accounts and they own both. I consolidate the look through Apple owned by Berkshire and the directly held apple as one position in order to guesstimate total AAPL exposure, even though in theory Berkshire could sell AAPL any time. Because both Berkshire and Apple have gone up (Apple moreso) this has led to trimming of the consolidated position, primarily via direct sales of apple. I have never personally liked Apple; have been completely wrong on it. I am personally a levered holder of Berkshire. I'd prefer Berkshire take some gains on the Apple and use after tax proceeds to buy back stock (along with excess cash, you could do $120 billion tender or something). But I assume that won't happen.
-
I also really liked this book. I read somewhere, however, that the accuracy is somewhat debatable and that it's possible to have been "tampered" with by the family that found the diary. I recall someone sayign it has several anachronisms in it. Of course, I can't find where I read that now. I really really liked the book though. Even if you told me it was 30% made up I wouldn't care. And since I can't actually find the article making those claims it could be 100% real after all.
-
Wilshire 5000 market cap / GDP exceeds dot-com peak
thepupil replied to RuleNumberOne's topic in General Discussion
I’ve been trimming my family’s apple and google, but does the fact that these have re-rated to a low to mid 20’s PE really signal the end is near? I’m not trying to be Pollyanna, but these just all seem like weak arguments to me. I’ll probably end up looking like Bill Miller or PZena pre GFC in all these posts and everyone calling for a big cyclical downturn will be right, but I think it’s actually hard to find real excess that is material portions of the indices. The one thing that I really agree with is that leveraged loans and junk bonds and their borrowers (some small caps but mostly private equity companies) look awful and downright bubbly. As part of my job I see the nitty gritty in these (detailed breakdowns of add backs and pro-formas, the contrived consultant due diligence reports, the lack of covvies etc). I think that the losers will be: institutions and retail investors who are investing in direct lending, mezz debt, CLO mezz tranches, business development companies, etc. Winners will be adept distressed debt investors and well positioned corporates. But as I mentioned earlier, the excesses in stucured credit are likely to hurt small portions of people’s institutional portfolio’s. If a pension throws 5 or 10% of their HY allocation into CLO BB’s for some spread pickup, I don’t think it’s going to be a huge issue when that unwinds. JApanese banks love them some CLO AAA but the 40 points of credit enhancement will insulate them just fine. Otherwise the banks don’t seem to be wearing all that risk; systemic risk from excesses in private / junk credit seems low to me Long CLO tangent aside, I’d also point out that EM and Devloped International stocks trade for 12-14x earnings and their currencies have all underperformed. I am not super bulled up; just Not buying these bearish arguments...unless the dems win, then its guns gold and canned food of course :) -
Wilshire 5000 market cap / GDP exceeds dot-com peak
thepupil replied to RuleNumberOne's topic in General Discussion
https://www.pionline.com/article/20190204/PRINT/190209967/fixed-income-still-prized-in-asset-mix-of-corporate-funds here's an article re the trend toward immunization and increase in fixed income; basically pensions have been taking equity profits, front loading contributions, and de-risking for the past few years. some more info https://us.milliman.com/insight/2019-Corporate-Pension-Funding-Study -
Wilshire 5000 market cap / GDP exceeds dot-com peak
thepupil replied to RuleNumberOne's topic in General Discussion
tax rates don't affect EBITDA, so I don't think tax reform really distorts net debt to EBITDA https://www.investors.com/etfs-and-funds/sectors/sp500-ge-not-alone-25-companies-owe-trillion-pension-payments/ Largest 25 pension obligations collectively owe $1 trillion, and have a funding gap of $150 billion ($1 trillion of liabilities against $850 billion of assets) Those 25 have a market cap of $3.5 trillion and $238 billion of EBIT, and $390 billion of EBITDA. Most of these, their funding gap would add maybe half a turn or less to their leverage ratios. GE the data is wrong because they have negative EBITDA so it messes up the calculation. For the companies that have the largest funding gaps as expressed in EBITDA, 4/4 of the top ones are defense contractors (Lockheed, Raytheon, Northrup, and Boeing). Many defense contractors utilize cost plus contracts that INCLUDE the cost of the pension benefits. The federal government is responsible for some portion of those folks pensions. Lockheed has the biggest funding gap, adding 1.3 turns to its leverage. I recognize that the funding gap can really blow it if rates go down and stocks go down since that increases the liability and decreases the assets, but given the trend toward immunization, the very long term nature of funding a pension, and the low absolute numbers here as a percentage of these companies earnings power, I see very little risk in terms of corporate pensions. Fear not the corporate pension "problem". Let's say you think EBITDA is bullshit, so I'll use $240 billion of EBIT. I'll stress that down to $180 billion for fun. I'll increase the obligation by 20% and decrease the assets by 10%. then these collectively could get to 100% funded with just over 2 years of EBIT. And of course they don't have to do it like that. Lockheed Martin -1.330194232 Raytheon -1.161483702 Northrop Grumman -1.091703057 Boeing -1.085029431 DuPont -1.015721604 Delta Air Lines -0.745312682 United Parcel Service -0.660816813 General Motors -0.634868058 Ford Motor -0.538615238 Exelon -0.405309555 Exxon Mobil -0.328415521 Caterpillar -0.316484311 Pfizer -0.250183959 United Technologies -0.227562352 3M -0.218516389 Johnson & Johnson -0.181629476 Merck -0.117022936 AT&T -0.067857536 Verizon -0.04536176 Citigroup -0.03108909 Honeywell 0.166219154 General Electric 1.852617649 International Business Machines -0.521864315 -
Wilshire 5000 market cap / GDP exceeds dot-com peak
thepupil replied to RuleNumberOne's topic in General Discussion
RuleNumberOne, which companies/sectors/etc. do you think are severely overvalued and/or overearning? Cigarbutt, appreciate the feedback; I’ll have a look at the papers. -
Wilshire 5000 market cap / GDP exceeds dot-com peak
thepupil replied to RuleNumberOne's topic in General Discussion
I’m also sort of confused as to why the “debt bubble” = don’t own stocks. If corporate debt is a bubble, the biggest beneficiaries of that bubble popping could be healthy corporate borrowers, who could presumably buy back that bubble era debt at good prices or pay very low rates on that bubble era debt for in some cases 30 or more years until maturity. Imagine the dollar prices of debt that these low spread long duration borrowers could get to if you’re right about inflation/ rates really picking up (at least that’s what I think you’re getting at) Do you think there will be a deflationary depression when the bubble pops, therefore you cant own stocks? then why are you harping on inflation? -
Wilshire 5000 market cap / GDP exceeds dot-com peak
thepupil replied to RuleNumberOne's topic in General Discussion
Why? If inflation goes to say 3% and rates back up 100 bps, then the investment grade bonds which comprise the bulk of corporate debt might sell off by...wait for it...7 or 8 points, and they yield 2.8%. So that "poof" may be more like a -4 or -5% total return. What kind of inflation are you talking about? 10%? -
Wilshire 5000 market cap / GDP exceeds dot-com peak
thepupil replied to RuleNumberOne's topic in General Discussion
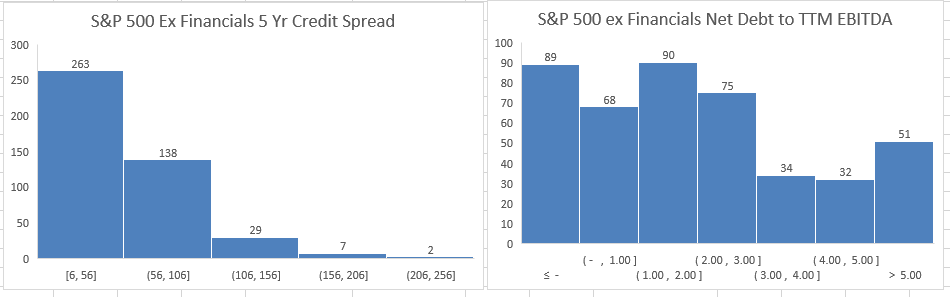
I see little credit risk in the entirety of the S&P 500. I'm not talking just the top 10, not talking about my holdings, I'm talking all of it. In the S&P 500 ex financials (439 companies), 263 have 5 yr CDS spreads below 56 basis points, and a further 138 ar between 56-106 bps, so 400 / 439 have credit spreads below 106 bps. There are like 3 companies above 200 bps: Apache, Occidental and L Brands. Now we are on COBF so we don't believe in perfect market efficiency and that low credit spreads is necessarily evidence of low credit risk, so let's take a look at some fundamentals. 247 of those companies are less than 2x levered using trailing EBITDA. Only 80 are above 4x. the median is 1.7x levered. Even at higher borrowing rates, these companies will be fine. Listed below are the scary companies that are over 5x levered and that's just using bloomberg dumb data, not adjusted or anything. I see a bunch of well covered real estate companies and some onese that actually carry a fair bit of leverage (TDG for example). I'm not trying to completely dismiss the macro risk. But the data is the data. I see a bunch of very healthy credits in publicly traded corporate america; i see a bunch of highly levered private equity portcos where the lenders are CLO's and private debt funds that themselves aren't levered and comprise a small portfion of various institutional investors portfolios. Perhaps the risk of LBO, CLO, etc. will bleed into the economy there'll be a recession and stocks go down. But don't look to big publcily traded corporate america to start experiencing credit events. fear not the all time high corporate debt ratios if you hold broad indices. if you hold individual stocks you can avoid that too. I happen to have a large position in the 4th most levered company on this list. I think it has virtually no net corporate debt. Equifax Inc Newell Brands Inc Edison International Vornado Realty Trust Alliance Data Systems Corp CarMax Inc Williams Cos Inc/The Zimmer Biomet Holdings Inc SL Green Realty Corp Campbell Soup Co General Electric Co Digital Realty Trust Inc Hologic Inc Harley-Davidson Inc Apartment Investment & Management Co Dominion Energy Inc TransDigm Group Inc Western Digital Corp Kimco Realty Corp Healthpeak Properties Inc Boston Properties Inc Molson Coors Beverage Co Welltower Inc Noble Energy Inc Dollar Tree Inc SBA Communications Corp NiSource Inc Essex Property Trust Inc Ventas Inc American Airlines Group Inc Entergy Corp Alexandria Real Estate Equities Inc Conagra Brands Inc Extra Space Storage Inc AES Corp/VA CMS Energy Corp Federal Realty Investment Trust Duke Energy Corp Simon Property Group Inc PPL Corp Realty Income Corp Constellation Brands Inc Kinder Morgan Inc/DE Sempra Energy Eversource Energy Duke Realty Corp MGM Resorts International Microchip Technology Inc Equity Residential Prologis Inc TechnipFMC PLC
-
Wilshire 5000 market cap / GDP exceeds dot-com peak
thepupil replied to RuleNumberOne's topic in General Discussion
Which companies in the S&P 500 are overlevered? What percent of the market cap and earnings power do they comprise? Banks are in the best shape they’ve been. Publicly traded corporate America is not overlevered, in my opinion. Debt has been well termed out. Rates are super low, interest coverage is high. Show me otherwise. PE/LBO’s are another story, but not big companies https://www.cornerofberkshireandfairfax.ca/forum/general-discussion/buybacks-have-exceded-free-cash-flow-for-the-first-time-since-the-financial-cris/msg377459/#msg377459 -
Well I certainly won't argue with that! I'm arguing with the idea that anyone that invest in scale in hedge funds really expects to outperform the market. The goals of institutional investors investing in hedge funds is not to beat the market. Here's some more modern stuff from the folks at Yale. They outright say that they have a slightly lower return expectation for "absolute return strategies" than equities. And I'd say their estimate for absolute return strategis of 4.8% real is high and builds in a lot of "manager selection alpha" (perhaps justified by their long term record). https://static1.squarespace.com/static/55db7b87e4b0dca22fba2438/t/5c8b09008165f55d4bec1a36/1552615684090/2018+Yale+Endowment.pdf In July 1990, Yale became the first institutional investor to define absolute return strategies as a distinct asset class, beginning with a target allocation of 15.0%. Designed to provide significant diversification to the Endowment, absolute return investments are expected to generate high long-term real returns by exploiting market inefficiencies. The portfolio is invested in two broad categories: event-driven strategies and value-driven strategies. Event-driven strategies rely on a specific corporate event, such as a merger, spin-off, or bankruptcy restructuring, to achieve a target price. Value-driven strategies involve hedged positions in assets or securities with prices that diverge from their underlying economic value. Today, the absolute return portfolio is targeted to be 26.0% of the Endowment, above the average educational institution’s allocation of 21.7% to such strategies. Absolute return strategies are expected to generate a real return of 4.8% with risk of 8.6%. The Barclays 9 to 12 Month Treasury Index serves as the portfolio benchmark. Unlike traditional marketable securities, absolute return investments have historically provided returns largely independent of overall market moves. Over the past twenty years, the portfolio exceeded expectations, returning 8.3% per year with low correlation to domestic stock and bond markets. Equity owners reasonably expect to receive returns superior to those produced by less risky assets such as bonds and cash. The predominant asset class in most U.S. institutional portfolios, domestic equity represents a large, liquid, and heavily researched market. While the average educational institution invests 20.4% of assets in domestic equities, Yale’s target allocation to this asset class is only 3.0%. The domestic equity portfolio has an expected real return of 6.0% with a standard deviation of 18.0%. The Wilshire 5000 Index serves as the portfolio benchmark. Despite recognizing that the U.S. equity market is highly efficient, Yale elects to pursue active management strategies, aspiring to outperform the market index by a few percentage points, net of fees, annually. Because superior stock selection provides the most consistent and reliable opportunity for generating attractive returns, the University favors managers with exceptional bottom-up, fundamental research capabilities. Managers searching for out-of-favor securities often find stocks that are cheap in relation to fundamental measures such as asset value, future earnings, or cash flow. Yale’s domestic equity portfolio has posted returns of 11.8% per year over the past twenty years.
-
I don't agree. I have a copy of Pioneering Portfolio Management here, published in 2000, in the heyday of hedge fund alpha and before the huge growth in assets and number of funds that preceded the ultimate decline of industry alpha. this quote is in the context of a seemingly normal 4% cash rate, so cash +6-8% The dream sold to institutional investors to invest in hedge funds was never "beat the market". It was "keep up with the market, make more than bonds with little duration risk, and make a significant premium to the cash rate"; get a diversifying return stream (not the duration of bonds or beta of stocks) without sacrificing too much return. I say a dream, because alpha/premium to cash/bonds has declined significantly because too many people read Pioneering Portfolio Management in 2000 and wanted to be like Yale. I share everyone's negative view of the industry as a whole, but I think it's important to understand what most of them are trying to actually do. Few hedge funds try to beat the stock market in a given short term time frame. all try to add value realtive to whatever they consider their sandbox. in aggregate value add is probably close to 0 before fees and negative thereafter.
-
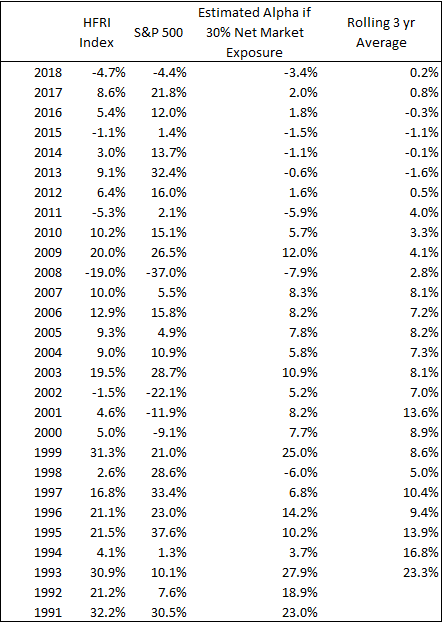
Here's the annual return of the HFRI Fund Weighted Composite Index versus the S&P 500 with an "estimated alpha" assuming the HFRI runs on average 30% net (so if market =10% and the HFRI does 3%, that's 0% alpha, no value add relative to market exposure). Again this is just a simplified spitball analysis. My point is that this is not news. Alpha has been near zero since 2012. Hedge Funds have not outperformed a strong up market on an absolute basis since 1999 when they made 31% to the S&P's 21%.
-
Why would you think that? They take less market exposure and alpha for a diversified index of hedge funds is and has been trending toward zero to negative for about twenty years, plus there are fees. To expect hedge funds to keep up with a 100% net long market that's up 30% would be to roll back about 2 decades of industry decline in alpha generation. Gross Returns = Beta * Net Exposure +/- alpha Net Returns = Gross Returns - Fees The people in the thread are for the most part running 80-100%+ net long, so return from beta = 30% for the US folks and mid 20's on a global basis; the people in the thread don't charge themselves fees. The hedge fund universe might run 30% net exposure in aggregate. I have no idea whther this number is 10% or 30% or 50%, but I assure you it's not 100% (most hedge funds hedge). So let's just assume 30%. Then the hedge fund universe in a year like 2019 should make about 10% from beta +- zero alpha in aggregate, minus some fees. I believe the 8.5% number includes all manner of hedge funds: long/short, global macro, fixed income arb, event driven, etc. so we may even be overestimating their equity exposure. 8.5% seems about right given what the market did. imagine if you invested in every actively managed mutual fund, doubled the fee burden and shorted out 70% of the market exposure. You'd do pretty terribly. hede fund indices should pretty much never put up high absolute returns in a given year. EDIT: here's some data for ya https://www.hedgefundresearch.com/family-indices/hfri-500-hedge-fund-indices#
-
2019 Consolidated IBKR account: 22.6%. Got rid of my Fido taxable and rolled that back into IBKR, have another IRA that's all in TGONF (12% or so return) and a work 401K that's completely in Vanguard Emerging Markets, which returned about 18%, so my overall investments did slightly worse than IBKR accounts. I'd regard this to be a pretty terrible relative result that will more or less wipe away a few years of S&P 500 outperformance. Reasons for underperformance are easy to spot; my biggest positions lagged the market in a big way. My largest positions (on a notional basis) are hedged Berkshire, hedged VNO, Tetragon Financial, none of which did all that great, all of which I'm excited about continuing to hold. Over the past 6.5 years, consolidated IBKR accounts is about 13.3% / year (literally right on top of the S&P 500), which includes a taxable account at 11.5%/year, an IRA at about 14.8% / year and a another IRA at 17.1% / year. The IRA's have always been super concentrated. The taxable started out long/short and ended up with me just using hedges and call options to limit drawdown rather than shorting.
-
you could also buy Scottish Mortgage, 37 bps fee, liquid 7 billion pound market cap global growth fund. it's obviously done very well lately given its growthy/techy. I'm more biased to the AVI type of stuff. https://www.bailliegifford.com/en/uk/individual-investors/funds/scottish-mortgage-investment-trust/performance/portfolio/ There's templeton EM fund, for just plain old EM at a slight discount (and higher than ETF fee). F&C for global growth (similar to Scottish Mortgage) Again this falls in the "low cost, liquid, diversified investment in UK without investing in the UK". Here's a list of the UK closed end funds >200mm pound market cap in order of market cap SMT LN Equity SCOTTISH MORTGAGE INV TR PLC FCIT LN Equity F&C INVESTMENT TRUST PLC RCP LN Equity RIT CAPITAL PARTNERS PLC HICL LN Equity HICL INFRASTRUCTURE PLC ATST LN Equity ALLIANCE TRUST PLC 3IN LN Equity 3I INFRASTRUCTURE PLC INPP LN Equity INTERNATIONAL PUBLIC PARTNER UKW LN Equity GREENCOAT UK WIND PLC TRIG LN Equity RENEWABLES INFRASTRUCTURE GR MRC LN Equity MERCANTILE INVESTMENT TRUST MNKS LN Equity MONKS INVESTMENT TRUST PLC PCT LN Equity POLAR CAPITAL TECHNOLOGY TR TEM LN Equity TEMPLETON EMERGING MARKETS-O WTAN LN Equity WITAN INVESTMENT TRUST PLC FGT LN Equity FINSBURY GR&INC TRUST-ORD CLDN LN Equity CALEDONIA INVESTMENTS PLC CTY LN Equity CITY OF LONDON INVESTMENT TR WWH LN Equity WORLDWIDE HEALTHCARE TRUST P SEQI LN Equity SEQUOIA ECONOMIC INFRASTRUCT MYI LN Equity MURRAY INTERNATIONAL TR-O TRY LN Equity TR PROPERTY INVESTMENT TRUST SSON LN Equity SMITHSON INVESTMENT TRUST SYNC LN Equity SYNCONA LTD HVPE LN Equity HARBOURVEST GLOBAL PRIVA BPCR LN Equity BIOPHARMA CREDIT PLC PIN LN Equity PANTHEON INTERNATIONAL PLC ASL LN Equity ABERFORTH SMALLER COS-ORD JMG LN Equity JPMORGAN EMERGING MKTS-ORD FCSS LN Equity FIDELITY CHINA SPECIAL SITUA BNKR LN Equity BANKERS INVESTMENT TRUST GCP LN Equity GCP INFRASTRUCTURE INVESTMEN PNL LN Equity PERSONAL ASSETS TRUST PLC EDIN LN Equity EDINBURGH INVESTMENT TRUST BBGI LN Equity BBGI SICAV SA VEIL LN Equity VIETNAM ENTERPRISE INV LTD-C FEV LN Equity FIDELITY EUROPEAN VALUES PLC HGT LN Equity HGCAPITAL TRUST PLC HRI LN Equity HERALD INVESTMENT TRUST PLC JAM LN Equity JPMORGAN AMERICAN INVEST-ORD TMPL LN Equity TEMPLE BAR INVESTMENT TRUST JEO LN Equity EUROPEAN OPPORTUNITIES TRUST GSS LN Equity GENESIS EMERGING MARKETS BGSC LN Equity BMO GLOBAL SMALLER COMPANIES APAX LN Equity APAX GLOBAL ALPHA LTD AGT LN Equity AVI GLOBAL TRUST PLC OTV2 LN Equity OCTOPUS TITAN VCT PLC BRSC LN Equity BLACKROCK SMALLER COMPANIES HSL LN Equity HENDERSON SMALLER COMPANIES JII LN Equity JPMORGAN INDIAN INV TRUST FSV LN Equity FIDELITY SPECIAL VALUES PLC SDP LN Equity SCHRODER ASIA PACIFIC-ORD JFJ LN Equity JPMORGAN JAPANESE INV. TRUST BGFD LN Equity BAILLIE GIFFORD JAPAN TRUST LWDB LN Equity LAW DEBENTURE CORP PLC-ORD NESF LN Equity NEXTENERGY SOLAR FUND LTD PEY LN Equity PRINCESS PRIV EQTY HOLD LTD PLI LN Equity PERPETUAL INCOME & GROWTH-O FSFL LN Equity FORESIGHT SOLAR FUND PLC ICGT LN Equity ICG ENTERPRISE TRUST PLC SOI LN Equity SCHRODER ORIENTAL INCOME IEM LN Equity IMPAX ENVIRONMENTAL MARKETS BRWM LN Equity BLACKROCK WORLD MINING TRUST TPOU LN Equity THIRD POINT OFFSHORE INVESTM PSSL LN Equity POLLEN STREET SECURED LENDIN SCIN LN Equity SCOTTISH INVESTMENT TRUST BBH LN Equity BB HEALTHCARE TRUST PLC VOF LN Equity VINACAPITAL VIETNAM OPPORTUN SAIN LN Equity SCOTTISH AMERICAN INV COMP JLEN LN Equity JLEN ENVIRONMENTAL ASSETS GR JESC LN Equity JPMORGAN EUR SMALLER COMPANI TFIF LN Equity TWENTYFOUR INCOME FUND LTD MRCH LN Equity MERCHANTS TRUST PLC SLS LN Equity STANDARD LIFE UK SMALLER CO MUT LN Equity MURRAY INCOME TRUST PLC EWI LN Equity EDINBURGH WORLDWIDE INV TR ATT LN Equity ALLIANZ TECHNOLOGY TRUST PLC SLPE LN Equity STANDARD LIFE PRIVATE EQUITY UEM LN Equity UTILICO EMERGING MARKETS TRU OCI LN Equity OAKLEY CAPITAL INVESTMENTS BSIF LN Equity BLUEFIELD SOLAR INCOME FUND DGN LN Equity ASIA DRAGON TRUST PLC BGS LN Equity BAILLIE GIFFORD SHIN NIPPON THRG LN Equity BLACKROCK THROGMORTON TRUST HFEL LN Equity HENDERSON FAR EAST INCOME LT GABI LN Equity GCP ASSET BACKED INCOME FUND CGT LN Equity CAPITAL GEARING TRUST-ORD TRG LN Equity TR EUROPEAN GROWTH TRUST PLC JPGI LN Equity JPMORGAN GLOBAL GROWTH & INC NAS LN Equity NORTH ATLANTIC SMALLER COMP JCH LN Equity JPMORGAN CLAVERHOUSE IT SONG LN Equity HIPGNOSIS SONGS FUND LTD DIG LN Equity DUNEDIN INCOME GROWTH INV TR SIGC LN Equity SHERBORNE INVESTORS GUERNSEY SWEF LN Equity STARWOOD EUROPEAN REAL ESTAT NAIT LN Equity NORTH AMERICAN INCOME TRUST NBLS LN Equity NB GLOBAL FLOATING RATE INC RICA LN Equity RUFFER INVESTMENT COMPANY LD BIOG LN Equity BIOTECH GROWTH TRUST PLC/THE HONY LN Equity HONEYCOMB INVESTMENT TRUST P JEMI LN Equity JPMORGAN GLOBAL EMERGING MKT BHMG LN Equity BH MACRO LTD BUT LN Equity BRUNNER INVESTMENT TRUST PLC EAT LN Equity EUROPEAN ASSETS TRUST PLC LWI LN Equity LOWLAND INVESTMENT COMPANY DIVI LN Equity DIVERSE INCOME TRUST PLC/THE AAIF LN Equity ABERDEEN ASIAN INCOME FUND L ATR LN Equity SCHRODER ASIAN TOTAL RETURN JAI LN Equity JPMORGAN ASIAN INVEST-ORD ADIG LN Equity ABERDEEN DIVERSIFIED INCOME AAS LN Equity ABERDEEN STANDARD ASIA FOCUS BGEU LN Equity BAILLIE GIFFORD EUROPEAN GRO BCI LN Equity BMO CAPITAL & INCOME INVESTM PAC LN Equity PACIFIC ASSETS TRUST PLC BRGE LN Equity BLACKROCK GREATER EUROPE INV BGLF LN Equity BLACKSTONE/GSO LOAN FINANCIN USA LN Equity BAILLIE GIFFORD US GROWTH TR RSE LN Equity RIVERSTONE ENERGY LTD BRFI LN Equity BLACKROCK FRONTIERS INVEST JRS LN Equity JPMORGAN RUSSIAN SECURITIES CCPG LN Equity CVC CREDIT PARTNERS EUROPEAN HINT LN Equity HENDERSON INTERNATIONAL INCO JMF LN Equity JPMORGAN MID CAP INV TRUST SUPP LN Equity SCHRODER UK PUBLIC PRIVATE IIT LN Equity INDEPENDENT INVESTMENT TRUST FAIR LN Equity FAIR OAKS INCOME LTD BHGG LN Equity BH GLOBAL LTD-GBP SHRS BGUK LN Equity BAILLIE GIFFORD UK GROWTH FU SQN LN Equity SQN ASSET FINANCE INCOME FUN FAS LN Equity FIDELITY ASIAN VALUES PLC FEET LN Equity FUNDSMITH EMERGING EQ TRUST PCFT LN Equity POLAR CAPITAL GLOBAL FINANCI SST LN Equity SCOTTISH ORIENTAL SMALL COS PCGH LN Equity POLAR CAPITAL GLOBAL HEALTHC ANII LN Equity ABERDEEN NEW INDIA INVESTMEN ABD LN Equity ABERDEEN NEW DAWN INV TRUST HEFT LN Equity HENDERSON EUROPEAN FOCUS TRU LTI LN Equity LINDSELL TRAIN INV TRUST TIGT LN Equity TROY INCOME & GROWTH TR BPET LN Equity BMO PRIVATE EQUITY TRUST-O AEMC LN Equity ABERDEEN EMERGING MARKETS IN JPE LN Equity JPMORGAN ELECT PLC-MGD GRWTH SHIP LN Equity TUFTON OCEANIC ASSETS LTD MWY LN Equity MID WYND INTERNATIONAL IT TORO LN Equity CHENAVARI TORO INCOME FUND L NCYF LN Equity CQS NEW CITY HIGH YIELD FUND HNE LN Equity HENDERSON EUROTRUST PLC-ORD JPEL LN Equity JPEL PRIVATE EQUITY LTD SJG LN Equity SCHRODER JAPAN GROWTH FUND MNP LN Equity MARTIN CURRIE GLOBAL PORT HHI LN Equity HENDERSON HIGH INCOME TR-ORD JZCP LN Equity JZ CAPITAL PARTNERS LTD IBT LN Equity INTERNATIONAL BIOTECHNOLOGY JMC LN Equity JPMORGAN CHINESE-ORD VSL LN Equity VPC SPECIALTY LENDING INVEST JPS LN Equity JPMORGAN JAPAN SMALLER CO TR MTU LN Equity MONTANARO UK SMALLER COS INV SCRF LN Equity SME CREDIT REALISATION FUND KIT LN Equity KEYSTONE INVESTMENT TRUST FJV LN Equity FIDELITY JAPAN TRUST PLC JMI LN Equity JPMORGAN SMALLER COSIT PLC SCP LN Equity SCHRODER UK MID CAP FUND PLC UTL LN Equity UIL LTD CCJI LN Equity CC JAPAN INCOME & GROWTH TRU STS LN Equity SECURITIES TRUST OF SCOTLAND SCF LN Equity SCHRODER INCOME GROWTH FUND WPC LN Equity WITAN PACIFIC INVESTMENT TR USF LN Equity US SOLAR FUND PLC
-
You could buy AVI global, the old British Empire Trust*, which is a diversified closed end fund of funds that over time will generate the return of the ACWI ex US +or-, would be diversifying to your other holdings with its emphasizing s on Japanese special situations and discounted funds. It charges 85 bps + the underlyings have fees, so that is a warning and contradictory to your ask, I am more recommending it because it is truly set it and forget it and you’d be investing in the U.K. without really investing in the U.K. the U.K. has an abundance of diversified closed end funds that are of decent scale and charge not entirely egregious fees. https://www.aviglobal.co.uk/content/uploads/2019/11/AVI-Global-Trust-Annual-Report-2019.pdf *why did they ever change that cool name? Foreign & Colonial had to change their name. British Empire Trust did not!
-
US listed, >$100mm market cap, down 30% or more year to date. ALKERMES PLC DEL TACO RESTAURANTS INC GOODRICH PETROLEUM CORP AGM GROUP HOLDINGS INC MEREDITH CORP SENIOR HOUSING PROP TRUST ON DECK CAPITAL INC DXC TECHNOLOGY CO GLOBAL CORD BLOOD CORP READING INTERNATIONAL INC-A KINDRED BIOSCIENCES INC WESTERN MIDSTREAM PARTNERS L ADTALEM GLOBAL EDUCATION INC AMC NETWORKS INC-A MYLAN NV EVENTBRITE INC-CLASS A AMC ENTERTAINMENT HLDS-CL A ETFMG ALTERNATIVE HARVEST DESIGNER BRANDS INC-CLASS A RENEWABLE ENERGY GROUP INC SYNCHRONOSS TECHNOLOGIES INC PRIORITY TECHNOLOGY HOLDINGS STARCO BRANDS INC REALOGY HOLDINGS CORP ADVISORSHARES RANGER EQ BEAR PROSHARES ULTRASHORT DOW30 PLURALSIGHT INC - A SIEBERT FINANCIAL CORP YOUNGEVITY INTERNATIONAL INC IDEANOMICS INC PACIFIC BIOSCIENCES OF CALIF VIRTU FINANCIAL INC-CLASS A BIG LOTS INC RAMACO RESOURCES INC GLOBALSTAR INC GREENHILL & CO INC NATURAL GAS SERVICES GROUP FARMERS & MERCHANTS BANCO/OH MSG NETWORKS INC- A LIBERTY OILFIELD SERVICES -A APPLIED OPTOELECTRONICS INC EZCORP INC-CL A AMERICAN SUPERCONDUCTOR CORP MITEK SYSTEMS INC TWIN DISC INC MACERICH CO/THE ALLIANCE RESOURCE PARTNERS NATIONAL BEVERAGE CORP TERADATA CORP CRINETICS PHARMACEUTICALS IN GAIN CAPITAL HOLDINGS INC FINVOLUTION GROUP COVENANT TRANSPORT GRP-CL A GAP INC/THE ORASURE TECHNOLOGIES INC VIEWRAY INC SUPERNUS PHARMACEUTICALS INC ENDO INTERNATIONAL PLC REPUBLIC FIRST BANCORP INC SINA CORP HIMAX TECHNOLOGIES INC-ADR NOAH HOLDINGS LTD-SPON ADS LOVESAC CO/THE SPIRIT AIRLINES INC US CELLULAR CORP VANDA PHARMACEUTICALS INC MCEWEN MINING INC VEONEER INC TABULA RASA HEALTHCARE INC DANAOS CORP SIENTRA INC GRANITE CONSTRUCTION INC OCCIDENTAL PETROLEUM CORP CARE.COM INC MODINE MANUFACTURING CO HEALTHCARE SERVICES GROUP RUBIUS THERAPEUTICS INC PERMIAN BASIN ROYALTY TRUST SUNCOKE ENERGY INC MOSAIC CO/THE FARMER BROS CO LEXICON PHARMACEUTICALS INC SIRIUS INTERNATIONAL INSURAN NU SKIN ENTERPRISES INC - A USANA HEALTH SCIENCES INC UPWORK INC AXOVANT GENE THERAPIES LTD PROSHARES ULTRASHORT S&P500 LAREDO PETROLEUM INC LIFETIME BRANDS INC NEXTIER OILFIELD SOLUTIONS I SAGE THERAPEUTICS INC THERAPEUTICSMD INC KULR TECHNOLOGY GROUP INC GANNETT CO INC MOVADO GROUP INC DYNAVAX TECHNOLOGIES CORP B&G FOODS INC GLYCOMIMETICS INC HOUGHTON MIFFLIN HARCOURT CO CONSOL COAL RESOURCES LP AGROFRESH SOLUTIONS INC CHEETAH MOBILE INC - ADR DRX DLY 20+ YR TREAS BEAR 3X FIESTA RESTAURANT GROUP RANPAK HOLDINGS CORP CYTODYN INC CASTLIGHT HEALTH INC-B ENDURANCE INTERNATIONAL GROU SIGNET JEWELERS LTD COOTEK CAYMAN INC-ADR FORTEM RESOURCES INC TRIPADVISOR INC NEKTAR THERAPEUTICS 360 FINANCE INC -ADR CONDUENT INC QEP RESOURCES INC CBL & ASSOCIATES PROPERTIES NATURAL GROCERS BY VITAMIN C SUCCESS ENTERTAINMENT GROUP TURTLE BEACH CORP CORP AMERICA AIRPORTS SA BITAUTO HOLDINGS LTD-ADR OWENS-ILLINOIS INC CARRIZO OIL & GAS INC DIAMOND OFFSHORE DRILLING DENBURY RESOURCES INC CONCERT PHARMACEUTICALS INC GASLOG LTD CIVEO CORP GOLAR LNG LTD TITAN INTERNATIONAL INC LIONS GATE ENTERTAINMENT-A CALLON PETROLEUM CO CHINA XUEFENG ENVIRONMENTAL BRIGHT MOUNTAIN MEDIA INC AKCEA THERAPEUTICS INC ATLAS AIR WORLDWIDE HOLDINGS CARS.COM INC INOVIO PHARMACEUTICALS INC ABIOMED INC ALDEYRA THERAPEUTICS INC CNX RESOURCES CORP ARBUTUS BIOPHARMA CORP INOGEN INC SOUTHWESTERN ENERGY CO RIBBON COMMUNICATIONS INC SIGA TECHNOLOGIES INC LIVENT CORP RETROPHIN INC SOHU.COM LTD-ADR RITE AID CORP NATURAL RESOURCE PARTNERS LP BOINGO WIRELESS INC MARKER THERAPEUTICS INC CHEMOURS CO/THE EQM MIDSTREAM PARTNERS LP INFORMATION SERVICES GROUP PROSHARES ULTRASHORT QQQ NEMAURA MEDICAL INC DASAN ZHONE SOLUTIONS INC CONCRETE PUMPING HOLDINGS IN PROSHARES ULTPRO SHRT DOW30 POTBELLY CORP SM ENERGY CO BLOOM ENERGY CORP- A FARFETCH LTD-CLASS A AVALON GLOBOCARE CORP GRITSTONE ONCOLOGY INC BIOCERES CROP SOLUTIONS CORP PINGTAN MARINE ENTERPRISE LT STAMPS.COM INC MACY'S INC AERIE PHARMACEUTICALS INC CAPITAL SENIOR LIVING CORP OVERSTOCK.COM INC AKAZOO SA VOCERA COMMUNICATIONS INC TRUECAR INC ENLINK MIDSTREAM LLC IROBOT CORP POWER SOLUTIONS INTERNATIONA OPKO HEALTH INC RESIDEO TECHNOLOGIES INC MERIDIAN BIOSCIENCE INC VAPOTHERM INC GAMESTOP CORP-CLASS A GRUBHUB INC RESOLUTE FOREST PRODUCTS FLUOR CORP WINS FINANCE HOLDINGS INC EQUITRANS MIDSTREAM CORP UXIN LTD - ADR DIREXION DLY SM CAP BEAR 3X GAMIDA CELL LTD XERIS PHARMACEUTICALS INC MERIT MEDICAL SYSTEMS INC RTI SURGICAL HDS INC PROQR THERAPEUTICS NV CLEAR CHANNEL OUTDOOR HOLDIN XT ENERGY GROUP INC CERAGON NETWORKS LTD FLUENT INC ORBCOMM INC CLOVIS ONCOLOGY INC ANGI HOMESERVICES INC- A TUNIU CORP-SPON ADR ZEONS CORP US SILICA HOLDINGS INC PROSH ULTRAPRO SHORT S&P 500 DIREXION DLY S&P 500 BEAR 3X GTY TECHNOLOGY HOLDINGS INC WEIDAI LTD-ADR SAN JUAN BASIN ROYALTY TR AVEO PHARMACEUTICALS INC ELOXX PHARMACEUTICALS INC TARGET HOSPITALITY CORP ORGANOGENESIS HOLDINGS INC NUCANA PLC-ADR CALYXT INC TRIVAGO NV - ADR 2U INC MARTIN MIDSTREAM PARTNERS LP FERROGLOBE PLC DERMTECH INC BENEFITFOCUS INC PENN VIRGINIA CORP EQT CORP HIGHPOINT RESOURCES CORP PLAYAGS INC SANDRIDGE ENERGY INC FOSSIL GROUP INC GRAN TIERRA ENERGY INC ANTERO MIDSTREAM CORP CELCUITY INC AUTOLUS THERAPEUTICS PLC MICHAELS COS INC/THE COOPER-STANDARD HOLDING CYTOSORBENTS CORP OASIS PETROLEUM INC TENNECO INC-CLASS A QUTOUTIAO INC-ADR DIREXION DAILY FIN BEAR 3X GTT COMMUNICATIONS INC UNITI GROUP INC LIBERTY TRIPADVISOR HDG-A RIGNET INC QURATE RETAIL INC-SERIES A UNITY BIOTECHNOLOGY INC CALIFORNIA RESOURCES CORP NII HOLDINGS INC NAMI CORP NCS MULTISTAGE HOLDINGS INC YIREN DIGITAL LTD UNION BRIDGE HOLDINGS LTD DIPLOMAT PHARMACY INC COVIA HOLDINGS CORP NOBLE CORP PLC LIVEXLIVE MEDIA INC P G & E CORP CONSOLIDATED COMMUNICATIONS X FINANCIAL-ADR CYTOMX THERAPEUTICS INC FIVE PRIME THERAPEUTICS INC BRIGGS & STRATTON RPC INC CONSOL ENERGY INC 22ND CENTURY GROUP INC QUAD GRAPHICS INC TAILORED BRANDS INC PROSHARES ULTRAPRO SHORT QQQ ATARA BIOTHERAPEUTICS INC ABEONA THERAPEUTICS INC DULUTH HOLDINGS INC - CL B RANGE RESOURCES CORP GULFPORT ENERGY CORP NEW AGE BEVERAGES CORP SILVERBOW RESOURCES INC NOVO INTEGRATED SCIENCES INC RING ENERGY INC SENSEONICS HOLDINGS INC EXTRACTION OIL & GAS INC PROSHARES VIX SHORT-TERM FUT IPATH SERIES B S&P 500 VIX PUMA BIOTECHNOLOGY INC JIANPU TECHNOLOGY INC- ADR RAYONIER ADVANCED MATERIALS NIO INC - ADR KINIKSA PHARMACEUTICALS-A FINCERA INC SCHOLAR ROCK HOLDING CORP SUMMIT MIDSTREAM PARTNERS LP EVELO BIOSCIENCES INC LAIX INC - ADR CHESAPEAKE ENERGY CORP OBSEVA SA BP PRUDHOE BAY ROYALTY TRUST MONTAGE RESOURCES CORP EVOLENT HEALTH INC - A PEABODY ENERGY CORP TUANCHE LTD-ADR ALTEROLA BIOTECH INC BIOCRYST PHARMACEUTICALS INC VALARIS PLC NESCO HOLDINGS INC XYNOMIC PHARMACEUTICALS HOLD EXTERRAN CORP ARLO TECHNOLOGIES INC DRX DLY S&P BIOTECH BEAR 3X CHINA TRAVEL RESORT HOLDINGS DRX DLY GOLD MINERS BEAR 3X GREEN DOT CORP-CLASS A CENTENNIAL RESOURCE DEVELO-A DRX DLY OIL & GAS BULL 3X KUSHCO HOLDINGS INC AURORA MOBILE LTD-ADR EROS INTERNATIONAL PLC AT HOME GROUP INC FLUIDIGM CORP FANG HOLDINGS LTD - ADR TYME TECHNOLOGIES INC AJIA INNOGROUP HOLDINGS LTD FORUM ENERGY TECHNOLOGIES IN INTELSAT SA CASA SYSTEMS INC COMSCORE INC AMNEAL PHARMACEUTICALS INC TILRAY INC-CLASS 2 COMMON ALTUS MIDSTREAM CO -A MULIANG AGRITECH INC VELOCITYSHARES 3X INV CRUDE DIREXION DLY JR GOLD BEAR 3X VELOCITYSHARES 3X LG NAT GAS TUPPERWARE BRANDS CORP APTINYX INC PACIFIC DRILLING SA BETTER CHOICE CO INC ANTERO RESOURCES CORP ANAPTYSBIO INC NINE ENERGY SERVICE INC EXELA TECHNOLOGIES INC MALLINCKRODT PLC DIREXION DAILY SEMI BEAR 3X CYMABAY THERAPEUTICS INC WHITING PETROLEUM CORP ADAPTIMMUNE THERAPEUTICS-ADR PROSHARES ULTRA VIX ST FUTUR NOBLE VICI GROUP INC AMERICAN BRIVISION HOLDING C ROAN RESOURCES INC PARTY CITY HOLDCO INC MARIMED INC SOLID BIOSCIENCES INC FTS INTERNATIONAL INC MCDERMOTT INTL INC NOVAVAX INC SEADRILL LTD MOGU INC-ADR VELOCITYSHARES 2X VIX SH-TRM CONTURA ENERGY INC FUELCELL ENERGY INC SINCERITY APPLIED MATERIALS
-
Why not just use P/E which does conform to GAAP? the more bearish like to use price to sales because margins/tax rates/interest rates have all moved in a way that is favorable to earnings. the more bullish like to use PE as simple TTM and forward PE's appear to be, for the most part, reasonable under any historical context and pretty cheap in today's rate environment. The truth is probably somewhere in between. Corporations are probably over-earning, but to assume complete mean reversion in margin, interest burden or tax rates, is likely to make one overly bearish of stocks. There have been legitimate shifts in sector composition that hsould lead to structurally higher margins, the trend in lower tax and interest burden appears structural to a certain extent, etc. etc. Google should have a higher long term margin than the top index components of 2000, 1990,1980, etc. At least in my opinion.