Leaderboard
Popular Content
Showing content with the highest reputation on 03/01/2023 in all areas
-
How are Fairfax's equity holdings doing so far in Q1? The positions I track are up about $1.074 billion, with the following split: - mark to market = $382 million = $16/share - associates = $660 million = $28/share - consolidated = $32 million Portfolio is up about +7.2%. Solid performance. Yes, it will be volatile. What were the big movers? 1.) Eurobank = +$543 million - This position has been on fire and is now valued at $1.85 billion. Atlas is at $2 billion. Not that long ago @glider3834 suggested Eurobank may pass Atlas as Fairfax's largest equity holding and he might be proven right in 2023. Looks like the turnaround at Eurobank is complete. 2.) FFH TRS = +$198 million - this is turning into a brilliant purchase. As a reminder, this position gives Fairfax exposure to 1.96 million Fairfax shares at an initial average cost of US$354. FFH shares are trading today at $695 = a double in a little more than 2 years. Since inception, this position is up about $670 million (with a notional value of $1.36 billion). 3.) Stelco = +$136 million - as was pointed out by another board member, HRC steel prices are back up over $1,000. As a result, Stelco is up. As a reminder, Fairfax bought 13.7% of Stelco in Nov 2018 for US$193 million. Since then Fairfax has been paid more than $40 million in dividends. Despite putting no new money in, they now own 23.6% of Stelco that is today worth $560 million. Stelco also has $800 million in cash on its balance sheet. With all the infrastructure spending happening in North America the next decade, Stelco is exceptionally well positioned. Looks like a pretty attractive acquisition target to me I have attached my Excel spreadsheet below. In addition to most of Fairfax's equity holdings, lots of additional tabs that board members might find interesting. Fairfax Equity Holdings March 1 2023.xlsx1 point
-
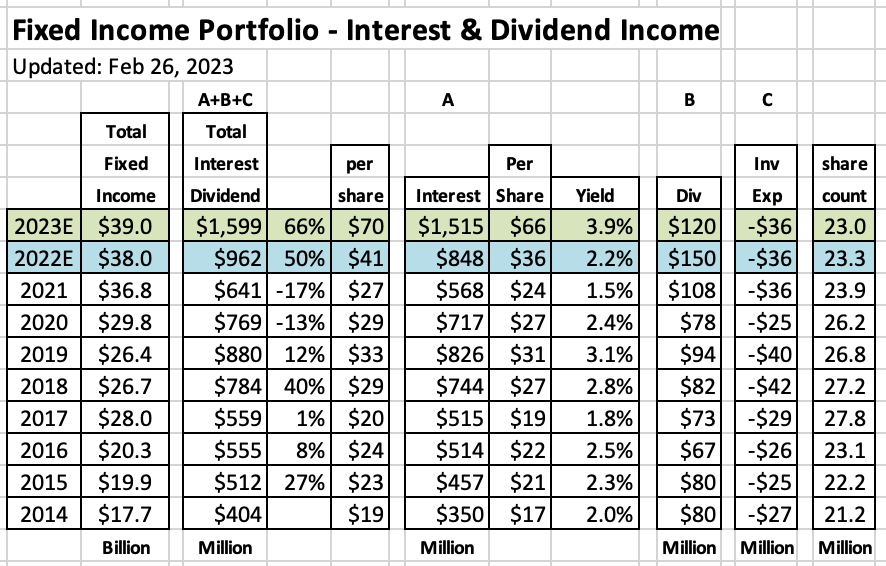
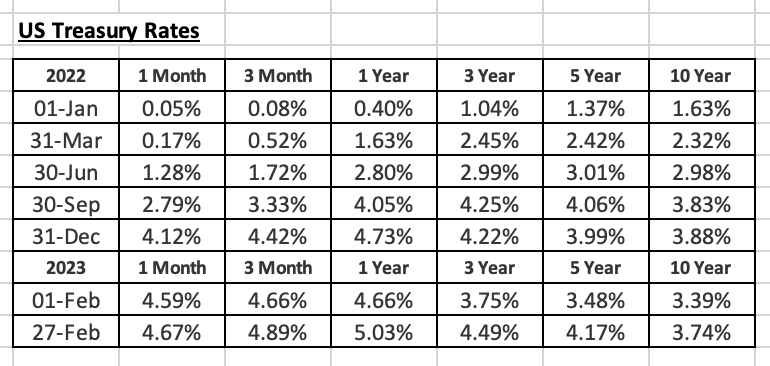
A couple of days ago I provided an update on how underwriting profit was tracking at Fairfax. Let’s now take a look at interest and dividend income. Of all of the many positive developments at Fairfax over the past 12 months, the increase in interest rates (and interest income) is one of the most exciting developments for shareholders. ————— Summary: In 2022, Fairfax earned $962 million ($41/share) in interest and dividend income. This is a new annual record. In 2021 Fairfax earned $641 million ($27/share). For 2023, my estimate for interest and dividend income is $1.6 billion ($70/share), or +66% year-over-year. Put simply, that is a massive increase. ————— Interest & dividend income = interest income + dividends - investment expenses. ————— A.) Interest Income: In 2021, Fairfax earned $568 million in interest income = 1.5% yield on their $36.8 billion fixed income portfolio. In 2022, Fairfax is on track to earn $850 million in interest income = 2.2% yield on their $38 billion fixed income portfolio (we will know the exact amount when they publish the 2022 annual report in March). In 2023, my estimate is Fairfax will earn $1.6 billion in interest income = 3.9% yield on their $39 billion fixed income portfolio. What has driven this significant increase in interest income? 1.) spiking interest rates: see table below of ‘US Treasury Rates’. 2.) extremely low duration of bond portfolio: 1.2 years at Dec 31, 2021 and 1.6 years at Dec 31, 2022. 3.) steadily growing size of fixed income portfolio: increased from $17.7 billion in 2014 to $38 billion in 2022. Fairfax timed their move to short duration in the fixed income portfolio exceptionally well. With rates spiking higher, the low duration allows Fairfax to roll their large fixed income portfolio more quickly from very low yielding into much higher yielding securities (spiking interest income higher). Most P&C insurers have an average duration on their fixed income portfolio of closer to 4 years on average (so it will take them many years to fully realize the benefit of higher bond yields via higher interest income). B.) Annual dividend income: Fairfax currently earns about $110-$120 million per year in dividends from its equity holdings. In 2022, Fairfax earned about $150 million in dividends driven by a special dividend in Q4 from Stelco of +$30 million. C.) Annual investment expenses: Fairfax incurs investment expenses of about $36 million per year. How has ‘interest and dividend income’ trended at Fairfax over 2022? - Q2 report: run-rate had increased to $950 million per year. - Q3 report: run rate had increased to $1.2 billion per year. - Q4 report: run rate had increased to $1.5 billion per year. Given bond yields have continued to move higher in Q1 2023, my guess is when Fairfax reports Q1 results in April we will learn the run rate has increase further to $1.6 billion or higher. What is the average duration of the bond portfolio at Fairfax? How is it changing? - at Dec 31, 2021, the average duration of the bond portfolio was 1.2 years. - at Dec 31, 2022 the average duration of the bond portfolio had increased to 1.6 years. Fairfax communicated during the Q4 conference call that they would like to increase the average duration to 2 years during 2023. Extending the duration will allow Fairfax to lock in current high yields for years into the future. In February 2023, bond yields have been spiking again approaching the highs last reached in Oct and Nov 2022 (yields on 3 year Treasuries are at 4.49%). It appears Fairfax is currently being given a wonderful opportunity by the bond market to extend the duration of their bond portfolio.1 point


