CRHawk
-
Posts
24 -
Joined
-
Last visited
Content Type
Profiles
Forums
Events
Everything posted by CRHawk
-
I'm an beginning / intermediate investor who relies heavily on ValueLine and Morningstar. I have a few questions. 1) I understand that the "Line" on Value Line reports is essentially a regression to the mean valuation. If we assume that the market is rational when averaged over time the line is a reasonable valuation. Clearly you still have to do your own thinking to avoid $KO at 30 PE. When I take the average PE they state, average dividend, and a reasonable growth assumption, I can calculate the Dividend Adjusted PEG based upon the mean valuation. This leads to an interesting result. The average valuation implied DAPEG of something like $NSRGY is 2.57. For $DIS it is 1.17. If these are the average DAPEG values investors are buying at over time, doesn't that mean there is a HUGE premium put on the stability/dividend of $NSRGY? It seems to me that if I tended to buy when stocks drop below the Value Line aren't I *much* better off buying low DAPEG stocks like $DIS, $CVS, $SBUX, $SHW, $NKE rather than high DAPEG stocks like $KO, $PEP, $UL, $NSRGY? Is this just the effect of investors reaching for dividend yield, or does the market know something I don't? 2) Using reversion to the mean valuation implies the business is running at a fairly steady state - growth isn't changing. If I wanted to know if growth was slowing for a company like $SBUX or $NKE, what would I look for? 3) I know that using a reversion to the mean valuation isn't as useful for cyclical companies, very new companies, or companies that are more interest rate sensitive like REITs. I'm okay with that. I also avoid trouble by leaning towards high moat companies and low debt companies. I have enough sense to stay away from $KO trading at 30 PE even if that is the current Value Line. But is there something else I'm missing with my approach? 4) Reversion to the mean seems to imply something else interesting. Let's say you have two stable growth stocks. One "should/usually" trades at 15 PE, and another that trades at 25 PE. You can use DAPEG to value them. But if they tend to revert to the same PE, shouldn't you value them as (Current Difference from PE average) + (Dividend) + (Growth)? Meaning the *absolute* PE doesn't really matter? Only the difference from the average PE?
-
Bought some more DIS on Thursday.
-
In this speech: https://www.farnamstreetblog.com/2015/03/charlie-munger-academic-economics/ Charlie Munger says: "In this vein, I next want to mention a strange Latin American case of a dysfunctional economy that got fixed. In this little subdivision of Latin America, a culture had arisen wherein everybody stole everything. They embezzled from the company, they stole everything that was loose in the community. And of course, the economy came practically to a halt. And this thing got fixed. Now where did I read about this case? I’ll give you a hint. It wasn’t in the annals of economics. I found this case in the annals of psychology. Clever people went down and used a bunch of psychological tricks. And they fixed it." Any idea what country he is talking about? -Jeff
-
Thanks! It looks like at least two of these screen for puts. -Jeff
-
Liability for financial bloggers / Seeking Alpha authors?
CRHawk replied to CRHawk's topic in General Discussion
Thanks everyone! That helped. I have some further questions, but will probably need to speak with a lawyer for those. -Jeff -
I figured the topic of potential liability for financial bloggers and Seeking Alpha authors would be well discussed on the internet. Obviously you need to avoid pumping and dumping, but I figure there are other issues, right? I've searched and can only find information about general liability insurance for bloggers. If I write up my investment idea for Seeking Alpha, and make $10, what is my liability? Why are so many people writing for Seeking Alpha, and this isn't discussed? Is it really not an issue? I see very few writers posting under the name of an company or LLC. -Jeff
-
I was wondering if anyone knew a method to screen options by yield? For instance if I wanted to sell a put option on Disney for a minimum of 5% APR is there a way to find that? -Jeff
-
Measuring / comparing cash & debt for companies...
CRHawk replied to CRHawk's topic in General Discussion
Thank you all! Good stuff to think about and look at. -
Resources on asset protection and tax planning
CRHawk replied to dabuff's topic in General Discussion
Some basics of asset protection and tax planning come up on Joshua Kennon's sites and Mr. Money Mustache. You might want to search those. -Jeff -
I like ValueLine for this. It gives a very good visual presentation of cash flow changes in most cases. Morningstar is good too. Both of them can be accessed for free from many libraries. I can even get access online from my house with my library card or university login. -Jeff
-
I want to look at debt when I am comparing the quality of companies and looking to invest in higher quality companies. So far, the method I like the best is to compare debt and and cash to yearly earnings. I would think this measures a companies ability to pay down debt if it wants to/ needs to. So... (Numbers based upon Value Line reports) JNJ is about 1 x E for debt, and about 2.5 x E in cash. Great! AMGN is about 3.5 E for debt, and about 4 x E for cash. Nice. AGN is about 8 x E for debt and about .2 x E for cash. RED ALERT! DEO is about 3 x E for debt, and about .2 x E in cash. Hmmm.... Not great, but probably okay for consumer staples. WTW is about 40 x E for debt and about 5 x E in cash. Zoinks! I have doubts even Oprah can fix this. Is this a reasonable way to look at debt? I started doing this because it felt like % of capital was misleading when different companies / industries have such different needs for capital. I do know I need to look at when debt is due when things are marginal. Do you have a favorite way of looking at debt? Am I misleading myself? Thanks! -Jeff
-
Thanks! The link to the OTC market does help! As for the ADR, yup... I am aware of that :) Strangely I've found F ADRs harder to buy than Y ADRs. -Jeff
-
Cheapest reliable tax filing software
CRHawk replied to Mephistopheles's topic in General Discussion
I really like Excel 1040 - Free and you can see what the heck the software is doing as it only does formulas. I've used it for years. https://sites.google.com/site/excel1040/ That said, this year I think I will need to go with a CPA due to sale of a house, marriage, my employer over-contributing to my 403b, etc. -
So, I'm looking at the Google Finance chart on a thinly traded stock, to see if you get any unusually high or low trades... and I found some. But when I look at another source (say NASDAQ) I don't see a matching high/low for the day. In this case it is LDSVF on Nov 21, 2014. How do I found it if this trade really happened? Maybe it was a case of a trade that happened, and then got canceled afterwards? -Jeff
-
I just checked Value Line sheets for HSY, JNJ, UL, DEO... Margins I see are maybe a tiny bit high... maybe 10% over average by eyeball? I don't see a huge margin problem. Where do you see high margins?
-
Frommi, I don't understand where you are getting the " i need 14-15% pretax returns with value investing to get the same results as just buy and hold indexing after taxes." What do you mean?
-
Er, where yesterday = last trading day = Friday. :)
-
Bought some TIF yesterday.
-
Whaaaa? How the heck does that happen? Without some sort of penalty or recourse? -Jeff
-
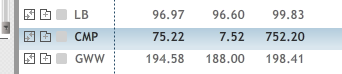
In pre-market trading a couple of days ago, I saw CMP with a last of $75.22, a bid of $7.52 and an ask of $752.20. Volume 0. Was this traders who fat fingered their orders? Or traders who hoped other traders would miss the decimal point and put in a market order? What the heck? Any ideas?

-
I've been wondering about that... and then he bought Phillips 66. I'm wondering if he feels that the amount of oil available will be so high that the only bottleneck (and place to make money) will be in refining.
-
Picked up some more AAPL.
-
Understanding high cash flow, "low earnings" accounting (ie KMI)
CRHawk replied to CRHawk's topic in General Discussion
Thanks everyone! Great point about looking for the split of maintenance and growth capex. As for circle of competence, I've decided that "high debt" is well outside of it, so will be staying away from KMI and CHK. I am very interested in learning operator earnings, and understand the theory but need more work at it. Are there any good "workbooks" for analyzing company accounting that includes the answers so I can gauge my competence? I've been looking at this one - http://www.amazon.com/Art-Science-Value-Investing-WORKBOOK/dp/1304802809/ref=sr_1_4?ie=UTF8&qid=1447763769&sr=8-4&keywords=buffett+workbook I will also find the Seth Klarman PDF. -Jeff -
Hi all! I’m fairly new to value investing, and this is my first post here. If I’m missing something that can be answered by reading something, please suggest readings. I’ve searched a lot, but haven’t found anything that addresses my questions. Anyways. I’m trying to make sure I understand some concepts about a high cash flow, “low earnings” company. I’ve been looking at KMI, but I suspect the lesson is applicable to other accounting situations. Right now KMI has a high P/E ratio – about 45 according to Google, despite the huge drop in share value. The 2014 annual report for KMI states “We believe the primary measure of company performance used by us, investors and industry analysts is cash generation performance.“ Pay no attention to earnings, in other words. I know that earnings can be manipulated, at least in the short term. But don’t earnings matter eventually? Here’s what I’m thinking: Joe’s Oil Transport company borrows 100 million dollars, and spends 90 million buying a pipeline. Next year, they earn 10 million in transport fees and pay 3 million in interest, giving them a cash flow of +7 million. But they also write off 6 million in pipeline depreciation, assuming a 15 year lifetime. Net earnings a paltry 1 million. This can go on for a few years… lots of cash, low earnings. But I figure eventually either.... a) Your depreciation was artificially high, the pipeline lasts far longer, and your earnings shoot through the roof at year 15. Or… b) You depreciation was accurate and your pipeline needs to be replaced at year 15. To value a high capex company, don’t you need to know what the asset lifetime really is? Is this a situation like rental real estate where depreciation isn’t a real cost but is useful for lowering taxes? I appreciate any hints or clues I can get! Thanks! -Jeff