

djokovic1
-
Posts
298 -
Joined
-
Last visited
-
Days Won
3
Content Type
Profiles
Forums
Events
Everything posted by djokovic1
-
Thanks!
-
Thanks! The article was a pretty good summary actually though it missed that I recommended 2 books not one, and stressed that @Viking's compendium is a must read for anyone who wants to learn deeply about Fairfax.
-
Pitched Fairfax at a Value Investing Conference in Italy last week. Got picked up by Bloomberg (attached). Will share slides and video if interesting. VIS Bridgewater Vet Pitches_BBG_Article_Fairfax.pdf
-
Can you use that framework to estimate what Fairfax’s multiple will be in five years?
-
The bank is essentially renting out leveraged economic exposure to FFH shares to Fairfax. It earns the floating rate on the notional (its “spread” above its own cost of funds is its profit), while being neutral on the share price because it hedges by holding the physical shares. The bank takes on counterparty credit risk against Fairfax (mitigated by collateral) and liquidity/execution risk in managing the hedge, but has no directional view on FFH’s stock price.
-
yes 100% agreed in the short term. But the supply demand view will give ‘no’ real information on what the multiple will be in 3-5 years. Which is what I am solving for and I believe that multiple is much more likely to be driven by fundamental value with that time horizon. which ties into the buffet quote..voting machine short term, weighing machine long term
-
maybe, maybe not. We can try to rationalize it in hindsight. The true test is if you can predict when it happens ex ante. I would suggest that’s impossible. for example consensus was Fairfax added to TSX will lead to multiple expansion but that didn’t happen
-
Terravest: Flat multiple for many years below 10x and then boom. Lindbergh, Sygnity, NGTG, Tasmea, Chapters group
-
This post might not age well (or it may!) but when multiple expansion happens it usually happens rapidly and when people least expect it. And there isn’t necessarily a reason you can clearly point to even with hindsight. I have seen it multiple times. It’s just price matching up with value (the only law in investing) . We just don’t know if it will happen next month or in 5 years. With buybacks we can (mostly) sit back and relax regardless.
-
Personally, I think 2x+ book or 15x P/E+ is roughly right. Based on first principles. Using relative valuation of other insurers as a reference, even that might be low. I don’t spend much time at all thinking about what multiple the market will assign my stocks. (This only works if the business understands capital allocation and their own intrinsic value and aggressively repurchases share if they are mispriced)
-
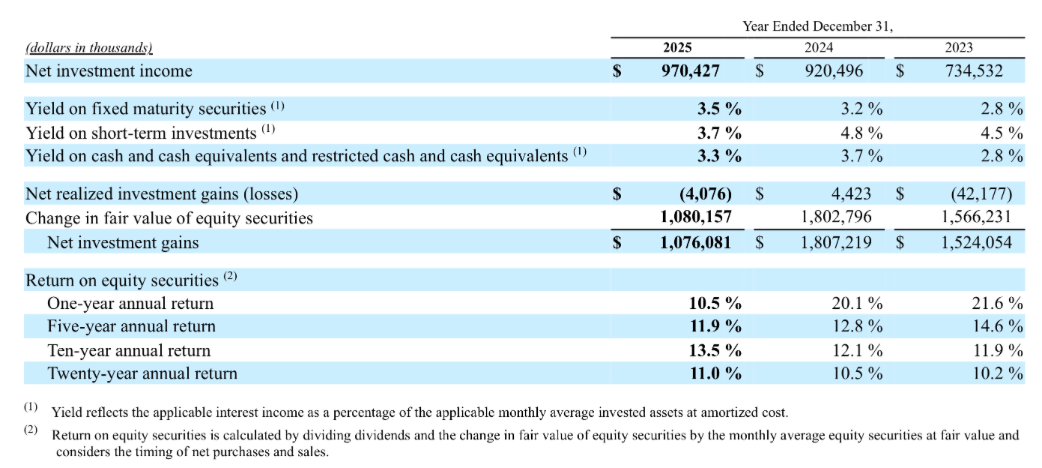
I am not so sure about this. Markel breaks down their equity returns pretty clearly, the below is from 2025. The 20 year return is pretty good but based on my calculations Fairfax has done better, ~15% CAGR including the negative impact of hedging and positive impact of CDS and TRS. I include all those elements because they are all active decisions taken which either add or detract from alpha.

-
Agreed. In general the clarity of thought w.r.t capital allocation and compounding is much higher at Berkshire (of course) and Fairfax.
-
They have mentioned it but definitely less than BRK and FFH. The Q1 2010 earnings calls has specific commentary in the Q&A on float growth, leverage, and equity allocation and its worth reading. Generally they have prioritised a higher allocation of equities in the book than higher investment leverage. They will do better than Fairfax in a zero interest rate environment all else equal but Fairfax is much better positioned in the current environment. Here are some of the instances using AI re their mention of float: 1. Status update presentation — "More float, more earnings power" Andrew Crowley (President of Markel Ventures) explicitly tied float growth to earnings power compounding: > "During the same timeframe, operating cash flows exceeded operating income by $5 billion, mostly due to the power of increasing insurance float. More float, more earnings power." The accompanying investor presentation slide also frames growth in float as one of several distinct levers for increasing earnings per share over time, alongside Markel Ventures, public equities, and share repurchases. 2. Q3 2023 earnings call — maximising investment return on float Jeremy Noble (President of Insurance): > "The insurance engine also continues to generate significant operating cash flows, and we have been intentional about taking the cash and maximizing the investment return on the float generated by our underwriting operations and attractive market yields." 3. Q1 2022 earnings call — the float spread as the core economic model Richie Whitt (Co-CEO) articulated the fundamental spread model clearly: > "We're making a spread of return between the positive yields on the bond portfolio and the negative cost of float that we get through underwriting profitability. And as long as we keep that spread a positive number, things add up to the good over time."
-
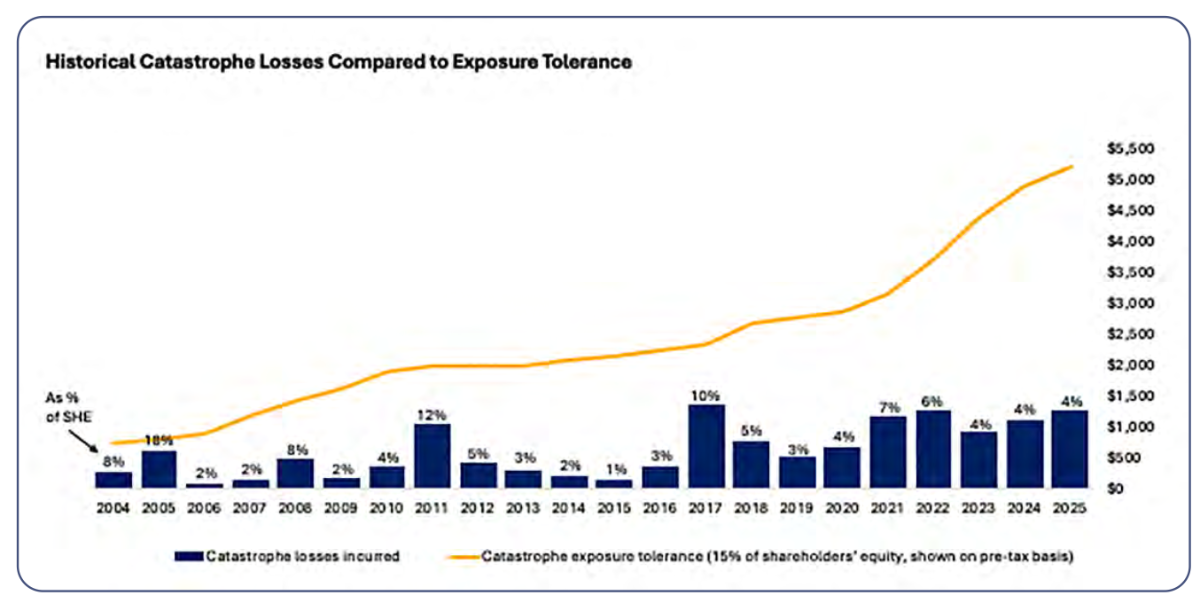
@SafetyinNumbers I love this chart. It shows how much more resilient Fairfax is today relative to its history to Cats. Shareholder equity has grown faster than premiums over the past 20 years. Since 2005: Shareholder equity 10x: $2.4bn -> $26bn Premiums 6x: $5bn -> $30bn. Same for float $6.6 ->$40. This is an additional reason that explains the widening gap and buffer i.e shareholder equity has grown faster than premiums/float. (interestingly buybacks will have the effect of reducing this buffer but of course increase per share value). The other aspect is that Fairfax will have 1-2% exposure to any Global catastrophe based on its size. There isn't idiosyncratic exposure as cat risk is shared across insurers. This is the latest one (a bit hazy) from the 2025 sustainability report.
-
My personal opinion is there is a big difference between Fairfax and Fairfax India. 2 big ones. 1) Fairfax doesn’t need great equity investments to be a great investment. A mediocre equity performance there will lead to a more than satisfactory result ie 15%+ because of the float/investment leverage and locked in income streams. Fairfax India doesn’t have that. It’s an investment vehicle and its performance is directly correlated to its equity investments and at this point majority of it is linked to Bial. If you look 10 years out you have to trust their investment acumen much more than you have to do for Fairfax. 2) Fairfax can solve its own problems re low valuation by buying back its own shares. Fairfax India cannot do this as its cashflow poor ie its an investment vehicle. This is a major disadvantage. For Fairfax India you have to rely on a multiple rerate which again is most likely dependent on BIAL and its IPO and that will be a one time uplift. A third one is with Fairfax India you are always fighting against the headwind of currency depreciation. So structurally there are big differences. Of course I am rooting for Fairfax India but for me the investment case is much clearer for one than the other.
-
Depends. if you are an aggressive seller sometimes regardless of price, happens all the time with institutions you will be willing to act opportunistically on block liquidity when it’s available. Even if your participation on previous days was much lower (because there was no matching block from Fairfax). Plausible scenario: Fairfax raised debt capital and potential sellers were made aware big block is available. also plausible: it was the trs also plausible but less likely: Fairfax not involved at all
-
Well Mr. Market can surprise you The share price was 10% lower 3 weeks ago i.e there was a lot of selling at much lower prices too.
-
I would be very surprised / unhappy if it’s the TRS. Would be amazing if it’s a 2% buyback in 1 swoop.
-
Yeah the higher yields go, the equity book has to do less and less for Fairfax to be a great investment from an already comfortable starting point. Additionally two of the biggest equity investments, Eurobank and TRS are positively geared to higher rates.
-
I agree with most here (strongly so) that the beauty of investing in Fairfax today is that you don't need to rely on above average equity returns for realising great ROE and compounding given that other income streams are locked in and the inherent investment leverage in the business model. For me that point is moot. I still find it a useful and interesting exercise to separate out the source of the returns as the data is there. At a high level, figuring out fixed income returns vs everything else. The everything else comprises of equity returns including TRS (positive), CDS (positive), hedging (big negative) + realised gains on assets held on book value which are worth more. The below analysis obviously doesn't incorporate the potential future returns from assets for example Poseidon and BIAL held at Book value which will show up sometime in the future when realised at market value. @Marco Van Basten Dude ...if you like to be called that I have to thank you for your push back because you are right, I was being approximate in my calculations for efficiency and you pushed me to be more specific. I still think you are very wrong in assuming Fairfax's non fixed income investments have underperformed the S&P over the long term, hopefully the below will help. I was able to go back to 1996 using CapIQ and Claude, so 30 years to calculate specific FI returns by year to 2025. I also have the total investment returns from 1996 to 2025. Using those pieces in the puzzle you can approximate the returns from everything that can't be attributed to fixed income for the 30 year period. Here are the results: 1996-2025 (30 year period) geometric annualised returns Total investment return: 7.0% Fixed income return: 3.9% Average 5 year fixed income US treasury yield: 3.2% Equity return + everything else (TRS, hedging, CDS): 16.6% S&P Return including dividends: 10.3% Note: this is assuming 75% / 25% fixed income equity split which I think is accurate. If you want to be conservative and use a 70%/30% split, the equity + other bucket return goes to 14.4%, still well well above the S&P return. The fixed income returns are higher than the average 5 year fixed income yields for reasons pointed out by Marco ie higher yielding FI, but not by much and the overall conclusion remains the same as my initial intuition with rougher assumptions. For anyone who says Fairfax is mediocre investor, these long term results should provide further evidence over and above the stock price performance that they know what they are doing (clearly a lot of people still don't get it! as they judge Fairfax based on the lost decade and don't realise the handbrake of hedging is gone). Additionally these stellar returns are after the impact of the lost decade and hedging in there. I too find investments like UA and KW questionable today. But in a similar vein there is also zero probability I would have invested in Eurobank 10+ years ago or Poseidon or Orla Mining and missed big gains. The best non biased evaluation of an investor is their long term track record. The above is further evidence for trusting in their process for value creation and compounding.
-
And I 100% agree with this. I am lucky to have spent some 1-1 time with him and discussed investments with his team. will also be seeing /meeting him at a conference tomorrow. Excited! His book is my investment bible and assessing capital allocation is the most important aspect in my investment decision making.
-
I agree it’s hard to be precise but I find it an interesting endeavor. Personally, I would include the CDS, hedging, TRS all of it and not exclude them. They were decisions taken by management at the time to maximize risk reward of the model. So I would first calculate the all-in number and then if you wanted to strip out specific items you can. I don’t think it would be impossible to approximate a rough FI returns using historic financials (though it will take time and I may make an attempt), and if you have that number you will also have a directionally correct equity return. It would be nice if management did the hard work for us as I’m sure they have the numbers ~15% CAGR of equity compounding for 40 years is mind blowing and so is 19% of bvps and share price compounding for 40 years.
-
Do you have a more accurate number? Where does the 6% come from precisely? Even if 5 year bond yields average 4.5% over the last 40 years, Fairfax has always run much shorter duration than that. How do you factor that in to your analysis? Btw, even with your 6% assumption the equity returns are 12%+ which beats the S&P over 40 years.....can't argue with that? Why didn't Buffett do this?
-
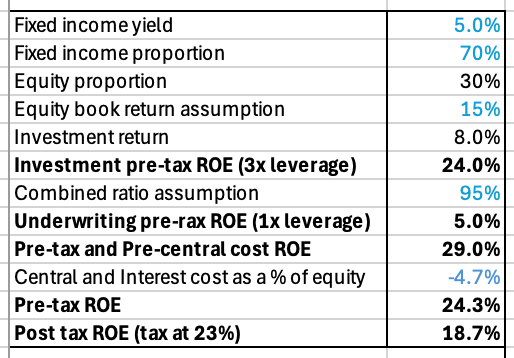
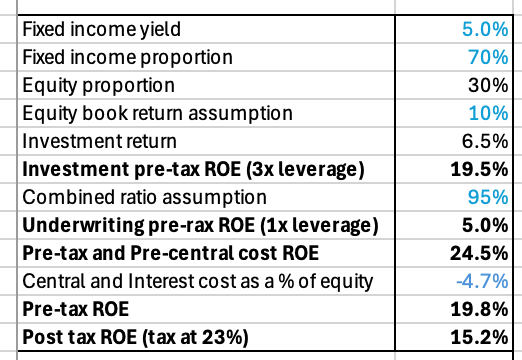
I agree I am a big fan of buybacks too given where the share price is. The good news is assuming a 10% forward equity return you can estimate a ~15% forward ROE, assuming a 15% forward equity return you can estimate a ~19% forward ROE. And this is before any additional unlock of latent value eg. Bangalore airport and situations like Poseidon where book value << market value.
-
Btw @Maverick47 I just had Claude estimate the Geometric return based on the AGM chart, and historical annual reports and given the low volatility in returns (due to high FI %), it calculated the Geometric return is 7.5%, not far off from the average.